


1. Introduction
Cryptocurrency is a type of digital currency that utilizes cryptography to validate transactions and maintain records, operating on a decentralized network instead of being regulated by a singular, centralized authority. The decentralized nature allows cryptocurrency to operate outside the traditional centralized system and potentially provides greater user autonomy and freedom from regulations. The first and most famous cryptocurrency is Bitcoin, which was launched in 2009 by pseudonymous developer Satoshi Nakamoto [1]. Since then, plenty of other cryptocurrencies, such as Ethereum, BNB, and Dogecoin have merged. Conversely, unlike conventional asset categories, cryptocurrency values aren't largely influenced by tangible metrics, such as earnings. Research also indicates that the cryptocurrency market is primarily controlled by speculative investors who base their investment choices on market emotions and sentiments [2]. Therefore, we want to figure out if sentiment from social media can also influence the cryptocurrency market.
Cryptocurrency markets are highly volatile and overreact to external events. Studies have shown that local and worldwide shocks influence cryptocurrency activities and trading volatility within specific regions, providing that outside happenings have an effect on cryptocurrency markets [3]. In the past years, social media has impacted human lives in a manner that is unprecedented in its scale and magnitude. In a recent research study, through the development and distribution of a questionnaire, it was found that social media usage escalated across all demographics. The study reveals that during the early phase of the pandemic in 2020, 70% of the participants reported an uptick in their social media activity, while 25% experienced no change in their usage patterns. In the second wave of the pandemic in 2021, the researchers found 89% of respondents reported their social media use had either increased or remained at the same higher level as during 2020 [4]. Given these percentages, it is reasonable to conclude that people were more active on social media during the epidemic era.
Twitter, as one of the most popular social media, is used by numerous people and has some correlation to the price of cryptocurrency. One example of Twitter influencing the cryptocurrency market is Elon Musk and dogecoin. Elon Musk, the founder of Tesla, developed an interest in dogecoin and frequently posts humorous tweets about it on Twitter. Musk’s tweets would often lead to fluctuation on the price of Dogecoin. In the following research, we are trying to find out if tweets from Twitter related to cryptocurrency affect its price using sentiment analysis and machine learning models. Based on the result for each model, the correlation between sentiment analysis of tweets and cryptocurrency price can be determined. Then, the Granger causality test is used to examine if a causation between tweets and cryptocurrency price exists.
2. Literature Review
Recent studies have examined the potential of using social media, such as Twitter, to analyze and forecast cryptocurrency price fluctuations. In this part, several projects that analyzed the relation between sentiment analysis and cryptocurrency price is introduced. One of the most related research projects is “The Impact of Twitter Sentiment Analysis on Bitcoin Price during COVID-19 with XGBoost” [5], which specifically analyzed Bitcoin prices during COVID-19. This paper used VADER sentiment analysis on Bitcoin tweets and got the results as positive, negative, and neutral. XGBoost models were built to classify if the price will rise or fall in the next minute. Models with Twitter data performed significantly better than without sentiment analysis, with 6% higher accuracy on 3-month dataset and 3% higher accuracy on 1-year dataset. Statistical testing and features of the importance of sentiment analysis proved that tweets correlate to the price for Bitcoin. The limitation for this research is it only took one cryptocurrency in the research and a single machine learning model. In the future, more models and more currencies can be applied to examine the correlation for tweets and cryptocurrency price. The paper “Cryptocurrency Price Prediction using Social Media Sentiment Analysis” [6] gathered data of tweets and prices for 7 major cryptocurrencies over 2 months. After preprocessing and VADER sentiment analysis, they checked the time series stationary and tested for causality using Granger causality tests. The result of the Granger causality test proved that the price of cryptocurrencies’ price (Bitcoin, Ethereum, and Polkadot) was correlated to sentiment analysis. Then, Vector autoregression (VAR) models were used to predict the price for Ethereum and Polkadot. A 12-hour forecast of 99.62% and 99.17% was achieved, indicating that the VAR model worked well in predicting the price for cryptocurrency. The limitation of this research was the short time span of data. It only collected data from September 2021 to November 2021. Social Media Impact on Cryptocurrencies [7] implemented ARIMAX models to analyze the impact of social media activity on Dogecoin and Ethereum log-returns. Strong influence was found for Dogecoin but not Ethereum. The paper hypothesized Dogecoin's volatility and recent popularity on social media led to a greater impact.
In summary, multiple studies have found social media analytics, especially sentiment analysis of relevant tweets, can help to predict cryptocurrency price fluctuation. Causality testing is important to establish relationship. Accuracy varies across currencies and timeframes. Overall, the field shows promise for leveraging public mood to forecast these volatile assets. More research is needed to be done with more machine learning models and larger datasets covering more cryptocurrencies.
3. Data Processing
3.1. Data Collection
This research mainly focuses on two datasets. Both of the datasets are collected from Kaggle, and the first is the cryptocurrency market [8]. Since this research focuses on the impact of sentiment analysis on Bitcoin price, only data about Bitcoin is used from the dataset. Therefore, before data cleaning and data analysis, it is necessary to delete data about other cryptocurrencies and regenerate a new dataset with only Bitcoin price data named “Bitcoin Price”. As shown in Figure 1, this dataset has 11 columns. In this research, variables “YEAR_AND_MONTH” are used to represent time and the “CLOSE” variable is set as the target variable for the Bitcoin price. The second dataset is bitcoin tweets [9], which contain text and results of sentiment analysis collected from Twitter that have #Bitcoin and #btc hashtag. The collection starts from February 5 2021 up to January 10 2023. Also shown in Figure 1, bitcoin tweets dataset has 10 columns. Since the sentiment analysis has already been done in this dataset, the result for each sentiment analysis can be utilized directly.
3.2. Data Analysis and Data Cleaning
3.2.1. Data Analysis
The bitcoin price dataset is extracted from the Cryptocurrency Data dataset, which provides K-lines data from Binance with 1 minute timeframe. Bitcoin price dataset contains data from October 2017 to January 2023. By making a histogram for CLOSE price and time, the trend for Bitcoin price fluctuation can be easily recognized – the price increases from 2017 to 2021 and decreases from 2021 to 2023. Based on the introduction, there are several factors that are correlated to this phenomenon, such as COVID-19, social media, and technology. The following part of this paper will try to find the correlation of social media (Twitter) and Bitcoin price.
Bitcoin Tweets dataset is collected directly from Kaggle. It contains data from February 2021 to January 2023. Since the data was preprocessed before collection, the result of sentiment analysis is used directly in this research. In the preprocessed dataset, VADER sentiment analysis and AFINN sentiment analysis are applied to the bitcoin tweets and the final sentiment data is calculated by 0.4*VADER sentiment+0.6*AFINN sentiment.
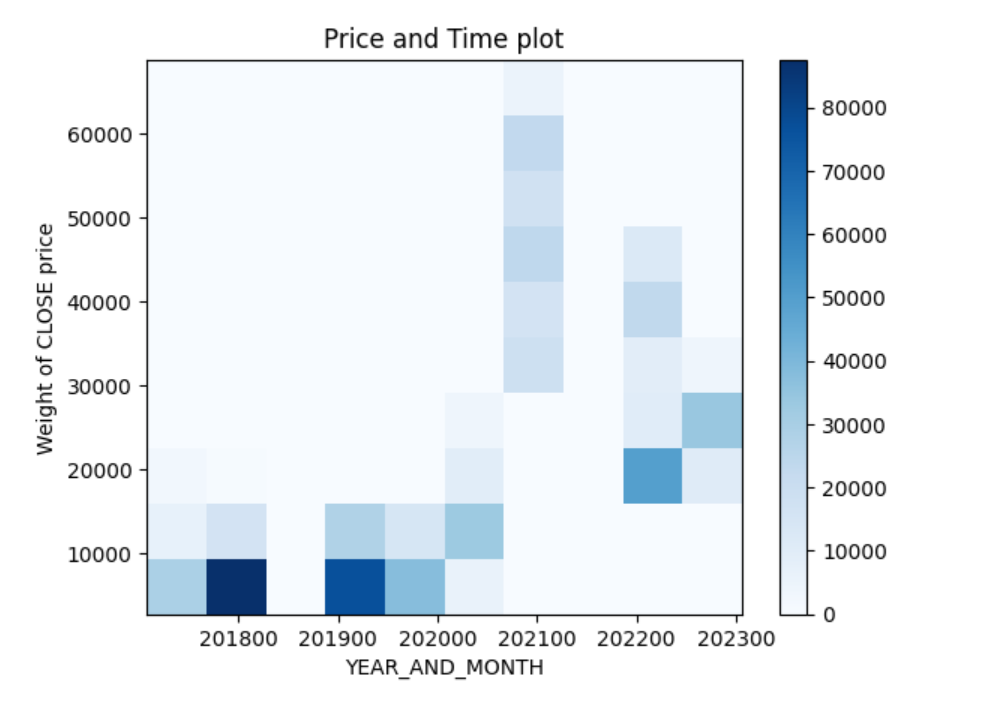
Figure 1: Histogram for bitcoin price and time
3.2.2. Data Cleaning
Bitcoin Price dataset has 612278 rows of data and Bitcoin tweets dataset has 3540245 rows of data. To combine them together, the time of these data needs to be standardized and noncoincident data are dropped due to mismatching of time. In this research, time are standardized based on year and month. In order to ensure the consistency of data, only data from February 2021 to January 2023 are selected. Since numbers of data in each month is different after grouping each dataset by year and month, some data has to be dropped in order to combine these two datasets. The last step for data cleaning is combining Bitcoin price and Bitcoin tweets datasets into one combined dataset based on the YEAR_AND_MONTH variable, which indicates the time for each data.
3.3. Data Processing
3.3.1. Correlation of Sentiment Analysis and Price
To find out the correlation between Bitcoin sentiment analysis and price, Bitcoin price dataset is set to be the control group and the combined dataset is set to be the experimental group. Five machine learning models are used in this research, which are linear regression, polynomial regression, random forest, ridge regression, and XGBoost. Each model uses 80% data to train and 20% to test. Mean absolute error, mean squared error, root mean squared error, and R-squared values are calculated to evaluate the performance.
3.3.2. Causation of Sentiment Analysis and Price
Above all, checking time series stationary for sentiment and CLOSE price using Kwiatkowski-Phillips-Schmidt-Shin (KPSS) test. Since both variables are non-stationary on time series, log transformation is taken to fulfill the requirement for the granger causality test. Then, the causation relationship between sentiment and price can be checked with Granger causality test.
4. Methodology
4.1. Sentiment Analysis
In this research, VADER sentiment analysis and AFINN sentiment analysis are used to determine the sentiment of texts. The final sentiment is calculated by 0.4*VADER sentiment+0.6*AFINN sentiment.
4.1.1. VADER Sentiment Analysis
VADER (Valence Aware Dictionary and sEntiment Reasoner) is a lexicon and rule-driven tool for sentiment analysis, specifically designed to decipher emotions conveyed in social media content [10]. It performs faster than machine learning algorithms since it requires no training [11]. Four sentiment scores (negative, neutral, positive, compound polarities) will be generated for each text. Negative, neutral, and positive are in the range of 0 to 1, while compound polarity is in range of -1 to 1 [12]. In this research, compound polarity is used as the result of VADER sentiment analysis so that the underlying sentiment of a text can be easily determined.
4.1.2. AFINN Sentiment Analysis
AFINN sentiment, developed by Finn Arup Nielsen, is a straightforward yet widely utilized lexicon for sentiment analysis. It encompasses over 3300 words; each assigned a polarity score to assist in evaluating emotional expression [13]. The polarity score for AFINN is in the range of -5 to 5.
In this research, the final result for this two-sentiment analysis is calculated by equation (1). After combining the Bitcoin price and Bitcoin tweets datasets, sentiment can be imported as one of the factors that might influence the CLOSE price, which is the target variable.
\( sentiment=0.4*VADER sentiment+0.6*AFINN sentiment \) (1)
4.2. Machine Learning Models
4.2.1. Multivariate Linear Regression
Multivariate linear regression (MLR) is a statistical method utilized to forecast the outcome of a dependent variable based on several independent variables [14]. MLR aims to establish a linear relationship between the independent variable x and the dependent variable y. The basic model for MLR with n predictor variables x1, …, xn is equation (2) and the formula for determining the formula matrix is equation (3) [15].
\( y=β0+β1x1+…+βnxn+ε \) (2)
\( \hat{β}={({X^{T}}X)^{-1}}{X^{T}}y \) (3)
4.2.2. Polynomial Regression
Polynomial regression involves the analysis of the n-th degree polynomial relationship between dependent and independent variables. It is a special instance of Multivariate linear regression and employs a polynomial equation to encapsulate the curvilinear interaction between the dependent and independent variables [15]. The general for of polynomial regression can be expressed as equation (4). \( ε \) is called random deviations or residuals, x is independent variables, y refers to the dependent variable, a is the coefficient of the polynomial, and m is the order of the polynomial [16].
\( y={a_{0}}+{a_{1}}x+{a_{2}}{x^{2}}+…+{a_{m}}{x^{m}}+ε \) (4)
4.2.3. Random Forest
Since the variables in this research is continuous, only a regression type of random forest is introduced here. Random forest is a supervised machine learning algorithm that leverages ensemble learning and can be applied to both regression and classification problems. It functions by creating numerous decision trees during the training process and outputs the average prediction from the individual trees when applied to regression tasks. The random forest algorithm is as follows [17]:
1) Draw ntree bootstrap samples from the original data
2) For every bootstrap sample, develop an unpruned regression tree, introducing a modification: at each node, instead of selecting the optimal split among all predictors, select a random subset of \(m_{try}\) predictors and determine the best split from within those variables.
3) Predict new data by aggregating the predictions of the ntree trees
4.2.4. Ridge Regression
Ridge regression is a technique for calculating the coefficients in multiple regression models when the predictor variables exhibit high correlation. The simple ridge estimator is given by equation (5), where y is the independent variable, X is the regressor matrix, I is the identity matrix and λ is the ridge parameter [18].
\( {\hat{β}_{R}}={(X{X^{T}}+λI)^{-1}}{X^{T}}y \) (5)
4.2.5. XGBoost
XGBoost (eXtreme Gradient Boosting), initially developed as a research project spearheaded by Tianqi Chen and part of the Distributed (Deep) Machine Learning Community group [19], is an application of the gradient boosting decision tree algorithm. The gradient boosting approach incrementally introduces new models to predict the residuals of preceding models, amalgamating them to formulate a final prediction. It's dubbed "gradient boosting" due to its use of gradient descent to minimize the loss function while integrating new models [20].
4.3. Time Series Stationery and Granger Causality Test
4.3.1. Time Series Stationary, Kwiatkowski-Phillips-Schmidt-Shin (KPSS) Test
The Kwiatkowski-Phillips-Schmidt-Shin (KPSS) tests in econometrics serve as statistical assessments to examine the hypothesis that a time series exhibits stationarity around a deterministic trend, as opposed to possessing a unit root, which would signal non-stationarity. [21] Check stationarity for both signals using Kwiatkowski-Phillips-Schmidt-Shin (KPSS) test:
Null hypothesis (H0): The time series is stationary because there is no unit root (if p-value > 0.05)
Alternative hypothesis (H1): The time series is not stationary because there is a unit root (if p-value ≤ 0.05)
4.3.2. Granger Causality
The Granger causality test, as defined, is a statistical hypothesis test used to ascertain whether one time series can be useful in predicting another. Per Granger causality, if a signal X "Granger-causes" another signal Y, it implies that X contains information that assists in forecasting Y. Granger causality test are used when the data is stationary in time series. Check Granger causality for 10 lags based on the hypothesis test:
Null hypothesis (H0): sentiment does not Granger-cause CLOSE (if p-value > 0.05)
Alternative hypothesis (H1): sentiment Granger-cause CLOSE (if p-value ≤ 0.05)
5. Result and Discussion
Colab is used as the compiler to process the data and apply machine learning models to the dataset. Pandas package is imported for access the data and merge two datasets. The Sklearn package is used to fit the dataset with five machine learning models mentioned in the methodology. The result with MAE, MSE, RMSE, and R-squared values is acquired by putting the bitcoin price dataset and the combined dataset into each machine learning model respectively. Based on the result on Table 1, the difference MAE, MSE, RMSE, and R-Squared values for five machine learning models is significantly small, indicating that whether the bitcoin price dataset includes sentiment analysis does not influence the performance of the model. Therefore, a feature of importance for each model is calculated to determine the weight of sentiment analysis in each model. The rank of sentiment analysis is listed in Table 2, and the full feature of importance is posted on appendix 1. With the rank listed figure, it is obvious that sentiment analysis in on the top 5 for 3/5 of the machine learning models. Therefore, the correlation between sentiment analysis and bitcoin price can be prove to exist.
Table 1: Result for 5 machine learning models
result | bitcoin only | combined | difference | |
linear regression | MAE | 25.14148396 | 25.14276944 | -0.00128548 |
MSE | 1767.415156 | 1767.468459 | -0.053302545 | |
RMSE | 42.04063696 | 42.0412709 | -0.000633936 | |
R-Square | 0.999991034 | 0.999991034 | 2.704E-10 | |
polynomial regression | MAE | 25.13551723 | 25.1585354 | -0.023018167 |
MSE | 1943.044522 | 1921.956829 | 21.0876927 | |
RMSE | 44.07997869 | 43.84012807 | 0.239850627 | |
R-Square | 0.999990143 | 0.99999025 | -1.06976E-07 | |
Random Forest | MAE | 27.05196204 | 27.1764689 | -0.124506859 |
MSE | 2178.136529 | 2170.573447 | 7.563081924 | |
RMSE | 46.67051027 | 46.58941346 | 0.081096806 | |
R-Square | 0.99998895 | 0.999988989 | -3.8367E-08 | |
Ridge regression | MAE | 25.14148397 | 25.14276925 | -0.001285288 |
MSE | 1767.415156 | 1767.468433 | -0.053277191 | |
RMSE | 42.04063696 | 42.0412706 | -0.000633634 | |
R-Square | 0.999991034 | 0.999991034 | 2.70272E-10 | |
XGBoost | MAE | 38.55306375 | 39.34322589 | -0.790162134 |
MSE | 3465.965888 | 3511.73744 | -45.77155165 | |
RMSE | 58.87245441 | 59.25991427 | -0.387459865 | |
R-Square | 0.99998248 | 0.999982249 | 2.31368E-07 |
Table 2: Rank of sentiment analysis in 5 models
machine learning model | sentiment analysis rank |
linear regression | 3 |
polynomial regression | 4 |
random forest | 7 |
ridge regression | 3 |
XGBoost | 7 |
After ensuring the correlation exists, the granger causality test is used to find out the causation between sentiment and bitcoin price. Before Granger causality test, time series stationarity for sentiment and bitcoin price needs to be checked. By KPSS test, raw data of sentiment and price are both likely non-stationary. In order to fulfill the prerequisite for the granger causality test, log transformation is taken for sentiment and price data and the modified data is time series stationary when retaking the KPSS test. The result of granger causality test is shown in figure 2, indicating that sentiment does not granger-cause bitcoin price for 10 time lags.
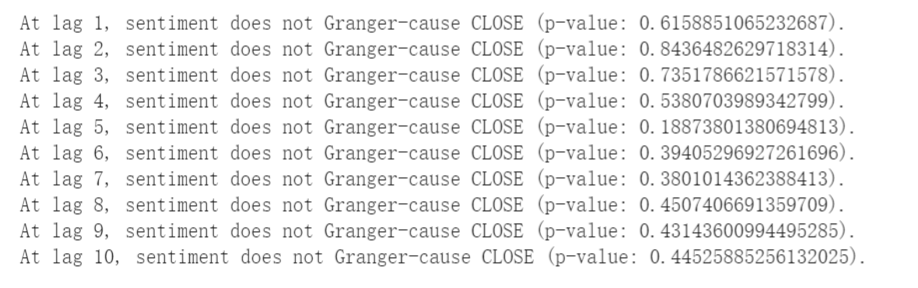
Figure 2: Granger causality result
The result of fitting the machine learning models and the features of importance for each model exhibits the correlation for sentiment analysis and bitcoin price. But the result of the Granger causality test reveal that no Granger causation relationship exists. This phenomenon might be caused by data misprocessing when combining these two datasets. The majority of bitcoin tweets data is dropped when adding sentiment analysis to the bitcoin price dataset in order to fit the data with the time variable “YEAR_AND_MONTH”. These abandoned data might produce bias in sentiment analysis and generate incorrect causation relationships. Meanwhile, the dimension used in the machine learning model and Granger causality is limited by the dataset. Only 11 variables are entered into the models, 5 from the bitcoin price dataset, 5 from the sentiment analysis dataset, and 1 is the time variable. Due to the limitation of variables, the result for training and testing models might have some bias and the causality test also can be influenced.
6. Conclusion
In conclusion, we believe that tweets from Twitter have some impact on cryptocurrency prices. In this research, data collection and data cleaning are done in the first place. After combining bitcoin tweets and bitcoin price together, the combined dataset and raw bitcoin price dataset are entered into 5 train-and-test machine learning models separately. Subsequently, KPSS test and granger causality test is taken by sentiment variable and price variable. The result of machine learning models and granger causality test prove that correlation between sentiment analysis and bitcoin price exists, while the causation relationship does not present. For the future work, larger dataset with more dimensions for both tweets and price should be considered and applied into the correlation and causation testing. And future work can include more social medias and more cryptocurrencies to provide a full picture about how sentiment analysis can impact the price of cryptocurrency.
References
[1]. Nakamoto, S. (2008). Bitcoin: A peer-to-peer electronic cash system. Decentralized business review.
[2]. Almeida, J., & Gonçalves, T. C. (2023). A systematic literature review of investor behavior in the cryptocurrency markets. Journal of Behavioral and Experimental Finance, 100785.
[3]. Qureshi, K., & Zaman, T. (2023). Social media engagement and cryptocurrency performance. PLOS ONE, 18(5). https://doi.org/10.1371/journal.pone.0284501
[4]. Rosen, A. O., Holmes, A. L., Balluerka, N., Hidalgo, M. D., Gorostiaga, A., Gómez-Benito, J., & Huedo-Medina, T. B. (2022). Is social media a new type of social support? social media use in Spain during the COVID-19 pandemic: A mixed methods study. International Journal of Environmental Research and Public Health, 19(7), 3952.
[5]. Edgari, E., Thiojaya, J., & Qomariyah, N. N. (2022, March). The impact of Twitter sentiment analysis on bitcoin price during COVID-19 with XGBoost. In 2022 5th International Conference on Computing and Informatics (ICCI) (pp. 337-342). IEEE.
[6]. Oikonomopoulos, S., Tzafilkou, K., Karapiperis, D., & Verykios, V. (2022, July). Cryptocurrency Price Prediction using Social Media Sentiment Analysis. In 2022 13th International Conference on Information, Intelligence, Systems & Applications (IISA) (pp. 1-8). IEEE.
[7]. Scalzotto, G. (2021). Social Media Impact on Cryptocurrencies.
[8]. Phuoc Thai, V. (n.d.). Crypto currency data [Data set]. Kaggle. Retrieved August 7, 2023, from https://www.kaggle.com/datasets/phucthaiv02/crypto-currency-data
[9]. Tylerdurden73 (n.d.). Twitter BTC [Data set]. Kaggle. Retrieved August 7, 2023, from https://www.kaggle.com/datasets/tylerdurden73/twitter-btc
[10]. Hutto, C.J. (n.d.). VaderSentiment [Computer software]. GitHub. Retrieved August 7, 2023 from https://github.com/cjhutto/vaderSentiment
[11]. Hutto, C., & Gilbert, E. (2014, May). Vader: A parsimonious rule-based model for sentiment analysis of social media text. In Proceedings of the international AAAI conference on web and social media (Vol. 8, No. 1, pp. 216-225).
[12]. Pano, T., & Kashef, R. (2020). A complete VADER-based sentiment analysis of bitcoin (BTC) tweets during the era of COVID-19. Big Data and Cognitive Computing, 4(4), 33.
[13]. Christodoulaki, E., Kampouridis, M., & Kanellopoulos, P. (2022, May). Technical and sentiment analysis in financial forecasting with genetic programming. In 2022 IEEE Symposium on Computational Intelligence for Financial Engineering and Economics (CIFEr) (pp. 1-8). IEEE.
[14]. Z. Zhang, Y. Li, L. Li, Z. Li, and S. Liu, "Multiple linear regression for high efficiency video intra coding," in ICASSP 2019-2019 IEEE International Conference on Acoustics, Speech and Signal Processing (ICASSP), 2019, pp. 1832-1836
[15]. Maulud, D., & Abdulazeez, A. M. (2020). A review on linear regression comprehensive in machine learning. Journal of Applied Science and Technology Trends, 1(4), 140-147.
[16]. Chen, Y., He, P., Chen, W., & Zhao, F. (2018, October). A polynomial regression method based on Trans-dimensional Markov Chain Monte Carlo. In 2018 IEEE 3rd Advanced Information Technology, Electronic and Automation Control Conference (IAEAC) (pp. 1781-1786). IEEE.
[17]. Bahrawi, N. (2019). Sentiment analysis using random forest algorithm-online social media based. Journal of Information Technology and Its Utilization, 2(2), 29-33.
[18]. Hoerl, A. E., & Kennard, R. W. (1970). Ridge regression: applications to nonorthogonal problems. Technometrics, 12(1), 69-82.
[19]. Chen, T. (2016). Story and lessons behind the evolution of XG-Boost. 2016-03-10)[2020-06-24]. https://homes. cs. washington. edu.
[20]. Bentéjac, C., Csörgő, A., & Martínez-Muñoz, G. (2021). A comparative analysis of gradient boosting algorithms. Artificial Intelligence Review, 54, 1937-1967.
[21]. Kwiatkowski, D., Phillips, P. C., Schmidt, P., & Shin, Y. (1992). Testing the null hypothesis of stationarity against the alternative of a unit root: How sure are we that economic time series have a unit root?. Journal of econometrics, 54(1-3), 159-178.
Cite this article
Li,M. (2024). Twitter Sentiment Analysis on Bitcoin Price. Advances in Economics, Management and Political Sciences,101,171-180.
Data availability
The datasets used and/or analyzed during the current study will be available from the authors upon reasonable request.
Disclaimer/Publisher's Note
The statements, opinions and data contained in all publications are solely those of the individual author(s) and contributor(s) and not of EWA Publishing and/or the editor(s). EWA Publishing and/or the editor(s) disclaim responsibility for any injury to people or property resulting from any ideas, methods, instructions or products referred to in the content.
About volume
Volume title: Proceedings of the 2nd International Conference on Financial Technology and Business Analysis
© 2024 by the author(s). Licensee EWA Publishing, Oxford, UK. This article is an open access article distributed under the terms and
conditions of the Creative Commons Attribution (CC BY) license. Authors who
publish this series agree to the following terms:
1. Authors retain copyright and grant the series right of first publication with the work simultaneously licensed under a Creative Commons
Attribution License that allows others to share the work with an acknowledgment of the work's authorship and initial publication in this
series.
2. Authors are able to enter into separate, additional contractual arrangements for the non-exclusive distribution of the series's published
version of the work (e.g., post it to an institutional repository or publish it in a book), with an acknowledgment of its initial
publication in this series.
3. Authors are permitted and encouraged to post their work online (e.g., in institutional repositories or on their website) prior to and
during the submission process, as it can lead to productive exchanges, as well as earlier and greater citation of published work (See
Open access policy for details).
References
[1]. Nakamoto, S. (2008). Bitcoin: A peer-to-peer electronic cash system. Decentralized business review.
[2]. Almeida, J., & Gonçalves, T. C. (2023). A systematic literature review of investor behavior in the cryptocurrency markets. Journal of Behavioral and Experimental Finance, 100785.
[3]. Qureshi, K., & Zaman, T. (2023). Social media engagement and cryptocurrency performance. PLOS ONE, 18(5). https://doi.org/10.1371/journal.pone.0284501
[4]. Rosen, A. O., Holmes, A. L., Balluerka, N., Hidalgo, M. D., Gorostiaga, A., Gómez-Benito, J., & Huedo-Medina, T. B. (2022). Is social media a new type of social support? social media use in Spain during the COVID-19 pandemic: A mixed methods study. International Journal of Environmental Research and Public Health, 19(7), 3952.
[5]. Edgari, E., Thiojaya, J., & Qomariyah, N. N. (2022, March). The impact of Twitter sentiment analysis on bitcoin price during COVID-19 with XGBoost. In 2022 5th International Conference on Computing and Informatics (ICCI) (pp. 337-342). IEEE.
[6]. Oikonomopoulos, S., Tzafilkou, K., Karapiperis, D., & Verykios, V. (2022, July). Cryptocurrency Price Prediction using Social Media Sentiment Analysis. In 2022 13th International Conference on Information, Intelligence, Systems & Applications (IISA) (pp. 1-8). IEEE.
[7]. Scalzotto, G. (2021). Social Media Impact on Cryptocurrencies.
[8]. Phuoc Thai, V. (n.d.). Crypto currency data [Data set]. Kaggle. Retrieved August 7, 2023, from https://www.kaggle.com/datasets/phucthaiv02/crypto-currency-data
[9]. Tylerdurden73 (n.d.). Twitter BTC [Data set]. Kaggle. Retrieved August 7, 2023, from https://www.kaggle.com/datasets/tylerdurden73/twitter-btc
[10]. Hutto, C.J. (n.d.). VaderSentiment [Computer software]. GitHub. Retrieved August 7, 2023 from https://github.com/cjhutto/vaderSentiment
[11]. Hutto, C., & Gilbert, E. (2014, May). Vader: A parsimonious rule-based model for sentiment analysis of social media text. In Proceedings of the international AAAI conference on web and social media (Vol. 8, No. 1, pp. 216-225).
[12]. Pano, T., & Kashef, R. (2020). A complete VADER-based sentiment analysis of bitcoin (BTC) tweets during the era of COVID-19. Big Data and Cognitive Computing, 4(4), 33.
[13]. Christodoulaki, E., Kampouridis, M., & Kanellopoulos, P. (2022, May). Technical and sentiment analysis in financial forecasting with genetic programming. In 2022 IEEE Symposium on Computational Intelligence for Financial Engineering and Economics (CIFEr) (pp. 1-8). IEEE.
[14]. Z. Zhang, Y. Li, L. Li, Z. Li, and S. Liu, "Multiple linear regression for high efficiency video intra coding," in ICASSP 2019-2019 IEEE International Conference on Acoustics, Speech and Signal Processing (ICASSP), 2019, pp. 1832-1836
[15]. Maulud, D., & Abdulazeez, A. M. (2020). A review on linear regression comprehensive in machine learning. Journal of Applied Science and Technology Trends, 1(4), 140-147.
[16]. Chen, Y., He, P., Chen, W., & Zhao, F. (2018, October). A polynomial regression method based on Trans-dimensional Markov Chain Monte Carlo. In 2018 IEEE 3rd Advanced Information Technology, Electronic and Automation Control Conference (IAEAC) (pp. 1781-1786). IEEE.
[17]. Bahrawi, N. (2019). Sentiment analysis using random forest algorithm-online social media based. Journal of Information Technology and Its Utilization, 2(2), 29-33.
[18]. Hoerl, A. E., & Kennard, R. W. (1970). Ridge regression: applications to nonorthogonal problems. Technometrics, 12(1), 69-82.
[19]. Chen, T. (2016). Story and lessons behind the evolution of XG-Boost. 2016-03-10)[2020-06-24]. https://homes. cs. washington. edu.
[20]. Bentéjac, C., Csörgő, A., & Martínez-Muñoz, G. (2021). A comparative analysis of gradient boosting algorithms. Artificial Intelligence Review, 54, 1937-1967.
[21]. Kwiatkowski, D., Phillips, P. C., Schmidt, P., & Shin, Y. (1992). Testing the null hypothesis of stationarity against the alternative of a unit root: How sure are we that economic time series have a unit root?. Journal of econometrics, 54(1-3), 159-178.