


1. Introduction
1.1. Research Background and Significance
The Media and Entertainment (M&E) industry, a massive sector with a projected market size of $4.22 trillion in 2031, continuously plays a vital role in the global economy [1]. This highly competitive and rapidly evolving market comprises a wide range of enterprises that create and deliver content to audiences via various platforms in different forms, including movies, television, broadcasts, and radio. From traditional film and television production to the rise of streaming services and digital media, technological advancements such as 5G and cloud storage have remarkably reshaped the M&E industry over the past few decades, bringing both opportunities and uncertainties to the market players and investors. Therefore, it is crucial to conduct a comparative analysis to discover the most promising investment option in the M&E sector.
The M&E industry is dominated by several key players, each competing against others with its unique offerings and strengths. Among all the M&E businesses, Paramount Global (PARA), Netflix (NFLX), Fox Corporation (FOXA), and The Walt Disney Company (DIS) are selected for the comparative analysis based on various criteria: market presence, operation strategies, and digital transformation. These four companies represent a broad spectrum of the industry, thus providing investors with a comprehensive overview of the investment landscape.
1.2. Literature Review
Value investing is a strategy proposed by Benjamin Graham and Warren Buffett in their work, such as “Security Analysis” and “The Intelligent Investor” [2,3]. They emphasize purchasing undervalued stocks with strong fundamentals and holding them for long-term gains. They proposed that to evaluate a company's worth, the key is analyzing the price-to-earnings (P/E) ratio, price-to-book (P/B) ratio, and dividend yield. Although this approach was initially applied to industries with tangible assets and predictable cash flows, it has increasingly been adopted in the dynamic and rapidly evolving M&E industry.
The media and entertainment industry are characterized by its diverse subsectors, including film, television, music, publishing, and digital media. Key studies, such as those by Vogel in “Entertainment Industry Economics” and Picard in “The Economics and Financing of Media Companies”, highlight the unique challenges and opportunities within the industry [4,5]. These include rapid technological advancements, fluctuating consumer preferences, and significant capital requirements.
Several studies have attempted to apply value investing principles to the media and entertainment sector. An outstanding example is the research by Damodaran in “Valuation Approaches and Metrics: A Survey of the Theory and Evidence”, which examines the valuation techniques applicable to entertainment companies [6]. Damodaran emphasizes the importance of adjusting traditional valuation models to account for the industry's unique revenue structures and growth patterns. Additionally, Chan, Lakonishok, and Sougiannis in “The Stock Market Valuation of Research and Development Expenditures” have shown that media companies with strong intellectual property portfolios often exhibit significant long-term value, aligning with value investing principles [7].
The digital revolution has profoundly impacted the media and entertainment industry, with streaming services, digital advertising, and social media reshaping revenue models. Studies like those by Wirtz in “Media and Internet Management” and Küng in “Strategic Management in the Media” discuss how these changes affect the valuation of media companies [8,9]. Value investors should adapt their strategies to account for intangible assets such as intellectual property, brand value, and subscriber bases. This industry is notably volatile, with revenues often tied to the success of individual projects or seasonal trends. Research by Vogel in “Entertainment Industry Economics” points out it is difficult to predict long-term cash flows, a cornerstone of value investing [4]. There were successful value investments in media companies, which can provide valuable insights. Warren Buffett's investment in the Washington Post Company during the 1970s, as documented in Lowenstein's “Buffett: The Making of an American Capitalist”, demonstrates the long-term gains achievable through disciplined value investing [10].
Value investing in the M&E industry presents both distinct challenges and significant opportunities for investors. While traditional valuation models must be adapted to account for the sector's dynamic nature, the core principles of identifying undervalued assets and holding them for long-term appreciation remain relevant. Existing literature on the application of value investing in the M&E sector is limited, showing the significance of this study in contributing to the topic.
1.3. Research Content
To identify the most desirable investment opportunity, we selected four representative firms within the M&E industry based on three criteria and applied the method of value investing. Adhering to the theoretical framework of value investing, this study focused on evaluating the financial strength and profitability of selected companies. Specifically, several key financial indicators, including liabilities, assets, EPS, PE ratios, PEG ratios, expected revenue growth rates, GP/A ratios and profitability margins are examined. Based on this analysis, this research provides one investment recommendation for investors, while discussing several underlying risks of the proposed stock.
2. Comparative Analysis
2.1. Company Introduction
Paramount Global (PARA), formerly known as ViacomCBS, is an American multinational M&E conglomerate that operates through three main segments: TV Media, Direct-to-Consumer (DTC), and Filmed Entertainment. This company owns several iconic brands, such as Nickelodeon, Comedy Central, and Paramount Pictures, all of which contribute to PARA’s strong position across different media categories. By the end of April 2024, its market capitalization reached $8.22 billion.
As a leading streaming media company that has revolutionized the way of delivering content, Netflix (NFLX) is dedicated to providing audiences with various original and licensed content, ranging from movies to variety shows. Its subscription-based revenue model makes Netflix heavily rely on the monthly membership fee. Due to its constant innovation and improvement of customer experience, this market giant has successfully attracted 260.28 million subscribers as of 2023 and achieved a considerable market capitalization of $241.09 billion in the first financial quarter of 2024 [11].
Fox Corporation (FOXA), an American multinational media company, was established in 2019 due to the acquisition of 21st Century Fox by The Walt Disney Company. With a market capitalization of $15.01 billion as of April 2024, this company remains a major player in news and sports broadcasting. According to the 10-k form of FOXA published in 2023, FOXA focuses on traditional media and owns several key assets, including the Fox Broadcasting Company, Fox Television Stations, Fox News, Fox Business, FS1, FS2, and Fox Sports. Apart from its influence in the traditional sector, FOXA also adapts to digital transformation by operating the ad-supported streaming service called Tubi.
Founded in 1923, Disney (DIS) has been a global market leader in the M&E industry that operates in multiple sectors: movies, television, studios, and theme parks. As of April 2024, DIS’s market capitalization reached $206.78 billion, demonstrating its financial stability and industry dominance. This company significantly benefits from its rich intellectual properties, such as Pixar, Marvel, and Star Wars. In recent years, Disney also has achieved a strong position in the streaming market with Disney+, which has expanded rapidly and become a main competitor of Netflix.
2.2. Selection Criteria
To ensure the research subjects are directly competing with each other and the credibility of the comparative analysis, PARA, NFLX, FOXA, and DIS are selected based on three criteria: market presence, strategies, and digital transformation.
Firstly, PARA, NFLX, FOXA, and DIS have all established renowned corporate images and strong market presence in the M&E sector. PARA stands out for its film production, NFLX keeps dominating the streaming segment, FOXA leads in sports and news broadcasting, and DIS is notable for its diversified entertainment portfolio. These companies are influential market leaders that continuously shape market trends and audience preferences. With their distinct strengths and focus, these companies have attained considerable market sizes, making them comparable for the value investing analysis.
In addition, they adopt similar strategies in their operations. Each of them vies for audiences by creating high-quality content, offering attractive pricing and bundling options, and acquiring exclusive content rights. In terms of product strategies, while their core product portfolios significantly overlap in movie production and television networks, each company has developed a unique position and competitive advantages to differentiate itself from others. For example, Disney opened several theme parks and resorts, establishing itself as an entertainment conglomerate, while FOXA holds the rights to broadcast major sports events [12].
Digital transformation and innovation are the third selection criterion. After realizing the market shift from traditional to digital media, all companies have responded swiftly and invested heavily in providing streaming services. Traditional media giants PARA, FOXA, and DIS have entered the streaming market by launching Paramount+, Tubi, and Disney+, respectively. Since being the pioneer in this sector in 2007, NFLX has continued to innovate in response to increasing competition in the market, such as developing the Netflix Party during the pandemic. Each of the four companies has demonstrated the ability to adapt to market dynamics and expand its product portfolio, thus becoming suitable potential investment options for investors.
3. Financial Analysis
The financial performances of PARA, NFLX, FOXA, and DIS are demonstrated in Table 1. In this essay, we use analysis techniques based on the theory of value investing. Value investing theory was first proposed by Benjamin Graham in “The Intelligent Investor”. He states that an investment operation should promise the safety of the principal and a satisfactory return. Investors should focus on companies with strong historical performance, good dividend records, and financial stability [3].
Table 1: Financial Performances of PARA, NFLX, FOXA, and DIS
Column1 |
PARA |
NFLX |
FOXA |
DIS |
stock price |
$ 11.91 |
$561.23 |
$28.81 |
$112.73 |
TTM EPS |
0.53 |
12.01 |
3.51 |
3.77 |
NTM EPS |
1.08 |
17.67 |
3.35 |
4.47 |
EPS Growth rate |
103.77% |
47.13% |
-4.56% |
18.57% |
Revenue Growth rate |
3.60% |
14.54% |
-6.18% |
3.35% |
TTM P/E |
22.47 |
46.73 |
8.21 |
29.90 |
NTM P/E |
11.03 |
31.76 |
8.60 |
25.22 |
PEG |
0.22 |
0.99 |
NA |
1.61 |
Robert Novy-Marx built on this theory by examining two aspects of a company to predict its performance: financial strength and profitability. Based on the value investing method, this essay will examine the financial strength of these four companies and select two companies for the subsequent assessment of their profitability.
3.1. Liabilities
We want to examine the liabilities of all four companies as one of the components to measure their leverage. In 2023, FOXA had the lowest total liabilities of $11,275,000. NFLX ($28,143,679) and PARA ($31,017,000) had relatively close amounts of liabilities. DIS has the highest liabilities of $97,247,000. Since liabilities alone cannot explain whether a company has high liquidity risk or not, the ability to repay the debt of these four businesses will be demonstrated by debt-to-asset ratios.
3.2. Assets
Assets measure the resources that the company owns or controls, which are expected to provide economic benefits in the future. Large companies usually have more assets than small companies. Based on data from 10-K forms, FOXA had the lowest total assets of $21,866,000 among the four businesses. NFLX ($48,731,992) and PARA ($53,543,000) were similar, consistent with their total liabilities. Due to DIS’s ownership of theme parks which account for a substantial amount of assets, it had the highest total assets of $205,579,000, significantly exceeding its competitors.
3.3. Debt-to-Asset Ratios
The debt-to-asset ratio is an indicator of the degree to which a company has used debt to finance its assets. DIS has the lowest debt-to-asset ratio of 47.30%, and FOXA has the second lowest of 51.56%. PARA (57.93%) and NFLX (57.75%) have very close debt-to-asset ratios. All four companies have healthy debt-to-asset ratios of around 50%, showing that they do not have significant risks in paying their debt and properly borrowing loans to boost their growth.
3.4. P/E Ratios
Based on their share prices on 26th April 2024 and EPS, besides FOXA, all other stocks’ PE ratios are expected to decrease in the next twelve months. Among the four companies, NFLX shows the highest TTM (46.73) and NTM (31.76) P/E ratios, indicating this stock is trading at a premium valuation and has the expectation of future growth. However, this also suggests that NFLX is relatively expensive. On the other hand, FOXA has the lowest P/E ratios, but they are expected to grow from 8.21 to 8.60.
3.5. EPS Growth Rates
Besides FOXA, all other stocks’ EPS are anticipated to rise in the next twelve months. PARA’s expected EPS growth rate of 103.77% significantly outpaces its competitors. EPS of NFLX and DIS are projected to experience a moderate growth of 47.13% and 18.57% respectively. In contrast, FOXA is expected to have a negative EPS growth rate of -4.56%.
3.6. PEG Ratios
PEG ratios of PARA and NFLX, calculated as NTM P/E divided by expected EPS growth rate, are 0.22 and 0.99 respectively, which are lower than that of DIS (1.61). A higher PEG ratio indicates DIS is relatively overvalued compared with the other two counterparts. The PEG ratio of FOXA is not applicable, as its current and forward EPS are negative.
3.7. Gross Revenue Growth Rates
Revenue of NFLX is expected to grow at 14.54%, which is the highest among the four stocks. PARA and DIS exhibit similar expected revenue growth rates of 3.60% and 3.35%, respectively. FOXA has the lowest expected revenue growth rate at -6.18%, showing that the market anticipates FOXA to make less revenue in the following year.
3.8. GP/A Ratios
FOXA’s GP/A ratio is 68.20%, the greatest among the four companies. The second largest GP/A ratio is 55.38% of PARA. Both FOXA and PARA have a high GP/A, indicating that the firm efficiently uses its assets to generate gross profit. NFLX’s GP/A ratio (28.74%) is decent, which is twice of the lowest company, DIS (14.45%).
3.9. Profitability
Based on the above analysis, FOXA’s expected EPS and revenue growth rate are both negative, though it has a high GP/A ratio. Comparing PARA, NFLX and DIS, DIS has the worst performance in all parameters. Thus, PARA and NFLX are more desirable than DIS and FOXA. Their profitability will be analyzed subsequently.
As depicted in Figure 1, PARA’s gross and net profit margins have declined over the past four years. The net profit margin of PARA even dropped to -2.05% in 2023, suggesting that PARA made a net loss. In comparison, Figure 2 shows NFLX's stable annual profit margins with a slight increase between 2020 and 2023. By the end of 2023, NFLX's net profit margin reached 16.04%, significantly outperforming PARA. Therefore, NFLX is better than PARA in terms of annual profitability.
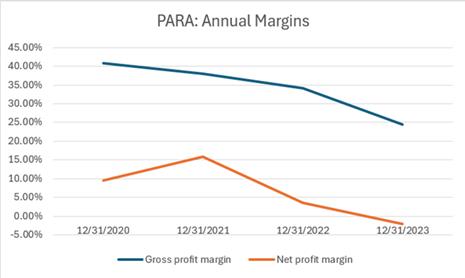
Figure 1: Annual Profit Margins of PARA.
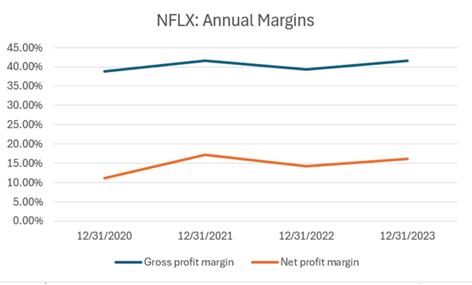
Figure 2: Annual Profit Margins of NFLX.
According to Figure 3, there was a positive trend in PARA’s quarterly profit margins from 3/31/2023 to 12/31/2023. In terms of NFLX in Figure 4, its gross profit margins remained stable at approximately 42%, while the net profit margins slightly dropped from 15.99% in the first quarter to 10.62% in the last quarter of 2023. Despite this decrease, NFLX still has greater quarterly gross and net profit margins than those of PARA.
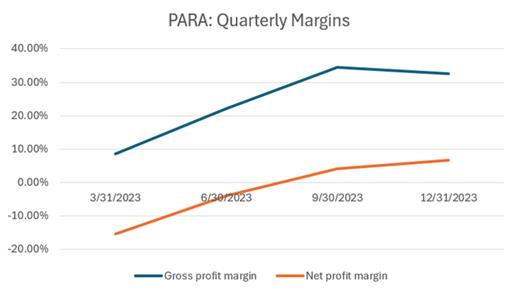
Figure 3: Quarterly Profit Margins of PARA.
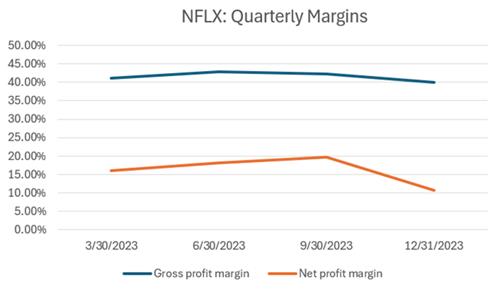
Figure 4: Quarterly Profit Margins of NFLX.
4. Suggestion
After thoroughly assessing these financial metrics, investors are recommended to invest in NFLX, the stock with the highest expected revenue growth rate, the second-highest expected EPS growth rate and GP/A ratio, and a low PEG ratio. Apart from these, NFLX also demonstrated superior profitability and stability among the four analyzed companies. Despite its high PE ratios, the low PEG ratio suggests that NFLX’s high price can be justified by its future EPS growth. While PARA may appear attractive in terms of its low PEG ratio, high expected EPS growth rate, and high GP/A, it did not perform well in terms of profitability. Furthermore, the net loss of PARA in 2023 raises concerns about its long-term financial sustainability and ability to generate consistent profits.
Although NFLX is a good investment choice, there are also some risks associated with this stock: First, due to the rapid growth of the streaming market, not only the pioneer (NFLX) in this industry but also traditional media giants have recognized the importance of transitioning to digitalized models to stay competitive. Therefore, NFLX faces fiercer competition as the competitors in the streaming market surge. If NFLX fails to attract enough subscribers, its revenue will be significantly damaged. Second, NFLX’s high TTM and NTM ratios indicate that investors hold an optimistic outlook on this stock. However, this high valuation is susceptible to volatility. If there are any disappointing financial results or negative publicity, its stock price will fluctuate drastically. Third, NFLX’s heavy reliance on the digital platform makes it exposed to cybersecurity threats, including computer viruses and data breaches. Such incidents can lead to confidential information leakage, thus harming its financial performance and reputation.
5. Conclusion
To conclude, this essay has conducted a comparative analysis of the investment value of four prominent players in the M&E industry: Paramount Global, Netflix, Fox Corporation, and The Walt Disney Company. By applying the value investing principles as proposed by Benjamin Graham and further developed by Robert Novy-Marx, this research focuses on the financial strength and profitability aspects and eventually suggests that Netflix is the most desirable investment option. The robust expected revenue growth rate, optimistic EPS projection, and positive profitability trends make Netflix outcompete its industry counterparts, and NFLX’s financial health enhances its potential for sustained profitability in the long term. Although Netflix faces increasingly intense competition and is vulnerable to cybersecurity risks, its constant innovation and content creation allow this company to hold a dominant position in the streaming market, making it attractive to value investors.
Admittedly, there are some limitations of this study. Firstly, the financial analysis is inherently based on historical data and analysts’ forecasts, thus unable to fully capture the future market dynamics or unforeseen changes in the economy. Additionally, this essay only focuses on quantitative factors, neglecting qualitative metrics such as brand strength. Therefore, despite Netflix being recommended according to the analysis, investors should carefully examine all aspects to make informed decisions.
Authors Contribution
All the authors contributed equally, and their names were listed in alphabetical order.
References
[1]. Business Research Insights. (2024). Media and entertainment market size, share, growth, and industry analysis by type (film, music, Social Media, Video & Animation, video games and others) by application (Wire, wireless and others), regional insights, and forecast from 2024 to 2031. Retrieved from https://www.businessresearchinsights.com/market-reports/media-and-entertainment-market-102952
[2]. Graham, B., Dodd, D. L. F., Cottle, S., & Tatham, C. (1951). Security analysis: Principles and technique (p. 851). New York: McGraw-Hill.
[3]. Graham, B. (2013). The intelligent investor: a book of practical counsel. Harper Collins. (Original work published 1949).
[4]. Vogel, H. L. (2020). Entertainment industry economics: A guide for financial analysis. Cambridge University Press.
[5]. Picard, R. G. (2011). The economics and financing of media companies. Fordham Univ Press.
[6]. Damodaran, A. (2007). Valuation approaches and metrics: a survey of the theory and evidence. Foundations and Trends® in Finance, 1(8), 693-784.
[7]. Chan, L. K., Lakonishok, J., & Sougiannis, T. (2001). The stock market valuation of research and development expenditures. The Journal of Finance, 56(6), 2431-2456.
[8]. Wirtz, B. W. (2011). Media and internet management. Gabriel Gurley.
[9]. Küng, L. (2016). Strategic management in the media: Theory to practice. Retrieved from https://www.torrossa.com/en/resources/an/5018599.
[10]. Lowenstein, R. (2013). Buffett: The making of an American capitalist. Random House.
[11]. Stoll, J. (2024). Netflix: Number of subscribers worldwide 2024. Retrieved from https://www.statista.com/statistics/250934/quarterly-number-of-netflix-streaming-subscribers-worldwide.
[12]. GuruFocus. (2024). Decoding fox corp (FOXA): A strategic swot insight. Retrieved from https://www.gurufocus.com/news/2209943/decoding-fox-corp-foxa-a-strategic-swot-insight?r=caf6fe0e0db70d936033da5461e60141
Cite this article
Huang,Y.;Yan,J. (2024). Comparative Analysis of Investment Value in the Media and Entertainment Industry. Advances in Economics, Management and Political Sciences,98,56-64.
Data availability
The datasets used and/or analyzed during the current study will be available from the authors upon reasonable request.
Disclaimer/Publisher's Note
The statements, opinions and data contained in all publications are solely those of the individual author(s) and contributor(s) and not of EWA Publishing and/or the editor(s). EWA Publishing and/or the editor(s) disclaim responsibility for any injury to people or property resulting from any ideas, methods, instructions or products referred to in the content.
About volume
Volume title: Proceedings of ICFTBA 2024 Workshop: Finance in the Age of Environmental Risks and Sustainability
© 2024 by the author(s). Licensee EWA Publishing, Oxford, UK. This article is an open access article distributed under the terms and
conditions of the Creative Commons Attribution (CC BY) license. Authors who
publish this series agree to the following terms:
1. Authors retain copyright and grant the series right of first publication with the work simultaneously licensed under a Creative Commons
Attribution License that allows others to share the work with an acknowledgment of the work's authorship and initial publication in this
series.
2. Authors are able to enter into separate, additional contractual arrangements for the non-exclusive distribution of the series's published
version of the work (e.g., post it to an institutional repository or publish it in a book), with an acknowledgment of its initial
publication in this series.
3. Authors are permitted and encouraged to post their work online (e.g., in institutional repositories or on their website) prior to and
during the submission process, as it can lead to productive exchanges, as well as earlier and greater citation of published work (See
Open access policy for details).
References
[1]. Business Research Insights. (2024). Media and entertainment market size, share, growth, and industry analysis by type (film, music, Social Media, Video & Animation, video games and others) by application (Wire, wireless and others), regional insights, and forecast from 2024 to 2031. Retrieved from https://www.businessresearchinsights.com/market-reports/media-and-entertainment-market-102952
[2]. Graham, B., Dodd, D. L. F., Cottle, S., & Tatham, C. (1951). Security analysis: Principles and technique (p. 851). New York: McGraw-Hill.
[3]. Graham, B. (2013). The intelligent investor: a book of practical counsel. Harper Collins. (Original work published 1949).
[4]. Vogel, H. L. (2020). Entertainment industry economics: A guide for financial analysis. Cambridge University Press.
[5]. Picard, R. G. (2011). The economics and financing of media companies. Fordham Univ Press.
[6]. Damodaran, A. (2007). Valuation approaches and metrics: a survey of the theory and evidence. Foundations and Trends® in Finance, 1(8), 693-784.
[7]. Chan, L. K., Lakonishok, J., & Sougiannis, T. (2001). The stock market valuation of research and development expenditures. The Journal of Finance, 56(6), 2431-2456.
[8]. Wirtz, B. W. (2011). Media and internet management. Gabriel Gurley.
[9]. Küng, L. (2016). Strategic management in the media: Theory to practice. Retrieved from https://www.torrossa.com/en/resources/an/5018599.
[10]. Lowenstein, R. (2013). Buffett: The making of an American capitalist. Random House.
[11]. Stoll, J. (2024). Netflix: Number of subscribers worldwide 2024. Retrieved from https://www.statista.com/statistics/250934/quarterly-number-of-netflix-streaming-subscribers-worldwide.
[12]. GuruFocus. (2024). Decoding fox corp (FOXA): A strategic swot insight. Retrieved from https://www.gurufocus.com/news/2209943/decoding-fox-corp-foxa-a-strategic-swot-insight?r=caf6fe0e0db70d936033da5461e60141