


1.Introduction
By analyzing the GDP of China and the United States, we can better understand the global economic situation and development trends, providing reference for formulating economic policies and promoting economic development. In this article, I will use GDP to analyze the economic situation between China and the United States, in order to infer the current economic trends and future development trends. GDP as an important indicator for measuring the economic situation of a country or region, has been of concern to many people.
\( GDP = C + I + G +( X - M) \)
The definition of GDP is the total market value of the final products and services produced by a country or region at a specific time. These final products and services include consumer goods, investment goods, government procurement goods, and net exports. GDP can be used to measure the economic scale and development level of a country or region. It can help governments, enterprises, and individuals make economic decisions and promote economic growth and development. The calculation method of GDP is obtained by adding up the market values of consumption, investment, government expenditure, and net exports [1]. Consumption includes personal consumption and government consumption, investment includes private investment and government investment, government expenditure includes government procurement and transfer payments, and net exports refer to exports minus imports. The market value of these parts is summed up to obtain the total value of GDP.
It can reflect the judgment of a country or region's economic development scale, its overall economic strength and speed of development, and can be used for economic structure analysis. It is an important basis for macroeconomic decision-making. From a production perspective, GDP can reflect a country's industrial structure and demand structure. It serves as a bridge that allows us to understand the current situation of a country's economic structure and its development and change patterns, it plays a crucial role in enabling us to formulate corresponding industrial development policies and control the proportion of consumption, investment, and imports and exports.
2.Literature Review
Due to China's rapid development in recent years and significant improvement in its international status, various developments in China have entered the perspective of scholars [2]. Some researchers believe that China's current approach is similar to the way the United States appears on the world stage, and have concluded through research that China's current political focus is very similar to that of early modern American leaders [3]. However, the Belt and Road Initiative launched by China in recent years has expanded the scope of the international economy through foreign direct investment, contracts, and trade [4]. Some studies suggest that China is growing at an astonishing rate and may surpass the United States to become the world's largest economy in the near future [5]. The driving force for long-term economic growth is the cumulative growth of useful knowledge systems and social capabilities carried by the industrial system in China's major country infrastructure. In recent years, the state and government departments have introduced many policies to support enterprises, especially small and medium-sized enterprises, such as tax incentives, loan incentives, subsidies, etc., which have stimulated the development of enterprises. Because of above reasons, this article uses Gross Domestic Product to study the macro changes and differences in economic development between China and the United States, as well as the impact of investment and consumption on Gross Domestic Product.
3.Methodology and Data
The data processing method used this time is detrend processing, which is a scaling index calculation method proposed by Peng. based on DNA mechanism in 1994, used to analyze the long-range correlation of time series. The step is to first fit the data with a straight line and create an average line. Then calculate the amplitude of periodic fluctuations based on the difference between the actual value and the average value. Finally, compare the two detrending functions to obtain their correlation and fluctuation trend.
I obtained the data for this analysis from the websites of U.S. BEA and China National Data, in US dollars and Chinese yuan, respectively. The year I chose is 2003-2022.
In this analysis, my variables are GDP, consumption, and investment. I used the formula ([Real Trend)/Trend] * 100%) to calculate and convert the trend into periodic components. I plotted a co plot of detrend GDP with investment and consumption, and based on the analysis of the chart, I drew conclusions and predictions.
The possible explanations of terms involved are as follows:
GDP refers to the gross domestic product, including consumption, investment, government expenditure, and net exports. Consumption refers to the expenditure of households on goods and services, while investment refers to the purchase of goods and services for future production. It is the sum of capital, equipment inventory, and building expenditures. Government expenditure includes expenditures for goods and services by local and federal governments, including salaries of government employees and expenditures for official duties. Import and export are equal to the expenditure of foreign countries on domestically produced goods (exports) minus the expenditure of domestic countries on foreign goods (imports).
Time series data is a series of data points indexed in chronological order, where variables can take different values at different times. It can be used to analyze GDP, study its changing trends, reveal the laws of economic changes over time, and predict the future economy.
Trends are general patterns detected in long-term time series data, while periodic components are fluctuations detected in the time series data surrounding the trend. The relationship formula between trend and periodic component: [(real trend)/trend] * 100% (this formula can convert the trend of the chart into a periodic component).
The definition of standard deviation is a statistical data used to measure the dispersion of a data set relative to its mean. The definition of correlation is statistical data that measures the degree of coordinated movement between two datasets.
In this practical situation, the standard deviation is the degree of deviation of each group of data, and the standard deviation ratio of consumption (or investment) to GDP is the change in consumption (or investment) trend relative to GDP trend.
Table 1: U.S. GDP, Consumption, Investment and Their Cyclical.
|
Year |
U.S. GDP |
U.S. GDP Cyclical(%) |
U.S. Consumption |
U.S. Consumption Cyclical(%) |
U.S. Investment |
U.S. Investment Cyclical(%) |
|
2003 |
13865.5 |
-0.7 |
9394.4 |
-0.1 |
2290.4 |
4.8 |
|
2004 |
14399.7 |
1.0 |
9748.6 |
1.3 |
2502.6 |
10.9 |
|
2005 |
14901.3 |
2.4 |
10093.8 |
2.5 |
2670.6 |
14.7 |
|
2006 |
15315.9 |
3.2 |
10386.2 |
3.2 |
2752.4 |
14.7 |
|
2007 |
15623.9 |
3.2 |
10638.7 |
3.4 |
2684.1 |
8.7 |
|
2008 |
15643.0 |
1.4 |
10654.7 |
1.4 |
2462.9 |
-3.1 |
|
2009 |
15236.3 |
-3.1 |
10515.6 |
-2.0 |
1942.0 |
-25.7 |
|
2010 |
15649.0 |
-2.3 |
10716.0 |
-2.1 |
2216.5 |
-17.4 |
|
2011 |
15891.5 |
-2.6 |
10898.3 |
-2.4 |
2362.1 |
-14.3 |
|
2012 |
16254.0 |
-2.2 |
11047.4 |
-3.0 |
2621.8 |
-7.2 |
|
2013 |
16553.3 |
-2.1 |
11211.7 |
-3.4 |
2801.5 |
-3.3 |
|
2014 |
16932.1 |
-1.6 |
11515.3 |
-2.6 |
2959.2 |
-0.3 |
|
2015 |
17390.3 |
-0.6 |
11892.9 |
-1.3 |
3121.8 |
2.7 |
|
2016 |
17680.3 |
-0.6 |
12187.7 |
-0.6 |
3089.9 |
-0.7 |
|
2017 |
18076.7 |
0.0 |
12478.2 |
-0.1 |
3216.0 |
1.1 |
|
2018 |
18609.1 |
1.2 |
12837.3 |
1.0 |
3398.9 |
4.5 |
|
2019 |
19036.1 |
1.9 |
13092.3 |
1.3 |
3492.7 |
5.0 |
|
2020 |
18509.1 |
-2.4 |
12700.7 |
-3.4 |
3306.5 |
-2.6 |
|
2021 |
19609.8 |
1.8 |
13754.1 |
2.9 |
3603.0 |
3.9 |
|
2022 |
20014.1 |
2.3 |
14130.3 |
4.0 |
3746.9 |
5.9 |
Table 2: China GDP, Consumption, Investment and Their Cyclical.
|
Year |
China GDP |
China GDP Cyclical(%) |
China Consumption |
China Consumption Cyclical(%) |
China Investment |
China Investment Cyclical(%) |
|
2003 |
137422.0 |
171.9 |
58689.9 |
287.8 |
52574.5 |
189.2 |
|
2004 |
161840.2 |
50.3 |
65724.8 |
77.8 |
63974.9 |
49.9 |
|
2005 |
187318.9 |
13.7 |
74153.7 |
26.1 |
73852.0 |
9.9 |
|
2006 |
219438.5 |
-1.1 |
82842.4 |
2.7 |
84978.6 |
-7.3 |
|
2007 |
270092.3 |
-3.2 |
98231.3 |
-4.1 |
102344.6 |
-11.9 |
|
2008 |
319244.6 |
-5.0 |
112654.7 |
-9.4 |
124700.7 |
-11.4 |
|
2009 |
348517.7 |
-11.4 |
123121.9 |
-15.7 |
152691.1 |
-7.6 |
|
2010 |
412119.3 |
-8.5 |
141465.5 |
-15.8 |
181041.1 |
-4.6 |
|
2011 |
487940.2 |
-3.9 |
170390.8 |
-10.2 |
214017.2 |
-0.1 |
|
2012 |
538580.0 |
-4.6 |
190584.8 |
-9.9 |
238320.7 |
-0.2 |
|
2013 |
592963.2 |
-4.6 |
212477.3 |
-9.0 |
263979.9 |
0.3 |
|
2014 |
643563.1 |
-5.2 |
236238.5 |
-7.5 |
282241.6 |
-1.9 |
|
2015 |
688858.2 |
-6.4 |
260202.4 |
-6.1 |
289970.2 |
-7.1 |
|
2016 |
746395.1 |
-5.9 |
288668.2 |
-3.4 |
310144.8 |
-7.9 |
|
2017 |
832035.9 |
-2.2 |
320689.5 |
0.0 |
348300.1 |
-3.6 |
|
2018 |
919281.1 |
1.3 |
354124.4 |
3.4 |
393847.9 |
2.1 |
|
2019 |
986515.2 |
2.3 |
387188.1 |
6.2 |
422451.3 |
3.0 |
|
2020 |
1013567.0 |
-0.8 |
387185.8 |
0.2 |
430624.9 |
-1.0 |
|
2021 |
1149237.0 |
6.5 |
438015.2 |
7.3 |
482119.3 |
5.0 |
|
2022 |
1210207.2 |
6.5 |
447910.2 |
4.2 |
507957.5 |
5.0 |
This is the GDP, consumption, and investment data for the United States and China from 2003 to 2022. I use formulas to trend and chart the trend of changes in GDP, consumption, and investment.
Table 3: Standard Deviation, SD Ratio and Correlation
|
% Deviation from Trend |
SD |
SD Ratio |
Correlation |
|
U.S. GDP |
2.1 |
1.0 |
1.0000 |
|
U.S. Consumption |
2.4 |
1.2 |
0.9541 |
|
U.S. Investment |
10.3 |
4.9 |
0.8218 |
|
China GDP |
40.4 |
1.0 |
1.0000 |
|
China Consumption |
67.0 |
1.7 |
0.9986 |
|
China Investment |
44.1 |
1.1 |
0.9955 |
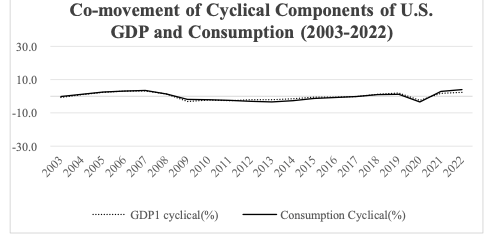
Figure 1: Co-movement of Cyclical Components of U.S. GDP and Consumption (2003-2022)

Figure 2: Co-movement of Cyclical Components of U.S. GDP and Investment (2003-2022)

Figure 3: Co-movement of Cyclical Components of China GDP and Consumption (2003-2022)

Figure 4: Co-movement of Cyclical Components of China GDP and Investment (2003-2022)
4.Results and Discussion
The standard deviation value of the US Gross Domestic Product is 2.1. The standard deviation value of consumption is 2.4. The standard deviation value for investment is 10.3. The SD ratio value of GDP is 1.00. The SD ratio value consumed is 1.2. The SD ratio value of the investment is 4.9.
The standard deviation value of China's gross domestic product is 40.4. The standard deviation value of consumption is 67.0. The standard deviation value for investment is 44.1. The SD ratio value of GDP is 1.00. The SD ratio value consumed is 1.7. The SD ratio value of the investment is 1.1.
The correlation between GDP and consumption in the United States is 0.9541, and the correlation between GDP and investment is 0.8218. This means that GDP is highly positively correlated with investment and consumption, as both values are above a positive 0.8. By analyzing the trend of GDP, investment, and consumption, I observed that the positive and negative trends in GDP and investment are basically consistent. But investment is clearly more volatile than the other two.
The correlation between China's GDP and consumption is 0.9986, and the correlation between GDP and investment is 0.9955. These two values are also positive above 0.8, indicating that China's GDP is highly positively correlated with investment and consumption. It can be observed that the correlation between consumption and investment in China and GDP is slightly higher, but consumption changed significantly with the image of China from 2003 to 2005 due to the use of straight line fitting during the trend removal process, resulting in a larger error in the first few years.
5.Conclusion
Due to the high positive correlation between consumption and investment in the United States and GDP, investment is most strongly affected by GDP in the short term. Therefore, when it is necessary to quickly adjust GDP, we should first adjust investment. The government can find ways to take a series of actions to stimulate investment, such as government subsidies and stimulating market demand. China's GDP is highly positively correlated with investment and consumption, and its growth rates have been stabilizing since 2005. Since consumption is most affected by GDP, we should first stimulate consumption when we need to quickly adjust GDP.
The stable growth of China's economy in recent years is also inseparable from the influence of consumption, such as the government's macroeconomic regulation to maintain the stability of economic growth. The government provides subsidies, tax reductions and other policies for various industries, creating a development atmosphere and a favorable policy environment, which is also an important guarantee for China's sustained economic growth. In the past few decades, the government has maintained the stability of economic growth through macroeconomic regulation. The income situation of the Chinese people has greatly improved, which has also strengthened consumer demand and purchasing power, contributing to market growth and economic stability. The increase in Chinese people's income has also stimulated people's entrepreneurial spirit, providing more types and comprehensive support for China's industries.
References
[1]. Mankiw, N. (2020). Principles of Economics. New York: Palgrave Macmillan.
[2]. Shixiong Cheng, E. and Hugh Dang, E. (2018) China and the United States: Two Superpowers in the Global Economy. Newcastle upon Tyne, UK: Cambridge Scholars Publishing (Transnational Corporations Council of Studies (TNCCS)). Available at:https://search.ebscohost.com/login.aspx?direct=true&db=nlebk&AN=1938134&site=eds-live&scope=site (Accessed: 16 October 2023).
[3]. Carter, P., Wang, J. and Chau, D. (2020) ‘A big-data analysis of political rhetoric relating the developments of the United States, China, and global powers’, Public Administration and Policy, 23(3), pp. 227–243. doi:10.1108/PAP-03-2020-0018.
[4]. Anne Thurston (2021) Engaging China: Fifty Years of Sino-American Relations. New York: Columbia University Press (Nancy Bernkopf Tucker and Warren I. Cohen Books on American-East Asian Relations). Available at: https://search.ebscohost.com/login.aspx?direct=true&db=nlebk&AN=2700031&site=eds-live&scope=site (Accessed: 16 October 2023).
[5]. Yunling, Z. (2010) China - USA: Making New Partnership, a Rising China and Its Neighbors. Reading: Paths International. Available at:https://search.ebscohost.com/login.aspx?direct=true&db=nlebk&AN=395456&site=eds-live&scope=site (Accessed: 16 October 2023).
Cite this article
Zuo,J. (2024). Analysis of GDP Between China and the United States. Advances in Economics, Management and Political Sciences,81,194-200.
Data availability
The datasets used and/or analyzed during the current study will be available from the authors upon reasonable request.
Disclaimer/Publisher's Note
The statements, opinions and data contained in all publications are solely those of the individual author(s) and contributor(s) and not of EWA Publishing and/or the editor(s). EWA Publishing and/or the editor(s) disclaim responsibility for any injury to people or property resulting from any ideas, methods, instructions or products referred to in the content.
About volume
Volume title: Proceedings of the 3rd International Conference on Business and Policy Studies
© 2024 by the author(s). Licensee EWA Publishing, Oxford, UK. This article is an open access article distributed under the terms and
conditions of the Creative Commons Attribution (CC BY) license. Authors who
publish this series agree to the following terms:
1. Authors retain copyright and grant the series right of first publication with the work simultaneously licensed under a Creative Commons
Attribution License that allows others to share the work with an acknowledgment of the work's authorship and initial publication in this
series.
2. Authors are able to enter into separate, additional contractual arrangements for the non-exclusive distribution of the series's published
version of the work (e.g., post it to an institutional repository or publish it in a book), with an acknowledgment of its initial
publication in this series.
3. Authors are permitted and encouraged to post their work online (e.g., in institutional repositories or on their website) prior to and
during the submission process, as it can lead to productive exchanges, as well as earlier and greater citation of published work (See
Open access policy for details).
References
[1]. Mankiw, N. (2020). Principles of Economics. New York: Palgrave Macmillan.
[2]. Shixiong Cheng, E. and Hugh Dang, E. (2018) China and the United States: Two Superpowers in the Global Economy. Newcastle upon Tyne, UK: Cambridge Scholars Publishing (Transnational Corporations Council of Studies (TNCCS)). Available at:https://search.ebscohost.com/login.aspx?direct=true&db=nlebk&AN=1938134&site=eds-live&scope=site (Accessed: 16 October 2023).
[3]. Carter, P., Wang, J. and Chau, D. (2020) ‘A big-data analysis of political rhetoric relating the developments of the United States, China, and global powers’, Public Administration and Policy, 23(3), pp. 227–243. doi:10.1108/PAP-03-2020-0018.
[4]. Anne Thurston (2021) Engaging China: Fifty Years of Sino-American Relations. New York: Columbia University Press (Nancy Bernkopf Tucker and Warren I. Cohen Books on American-East Asian Relations). Available at: https://search.ebscohost.com/login.aspx?direct=true&db=nlebk&AN=2700031&site=eds-live&scope=site (Accessed: 16 October 2023).
[5]. Yunling, Z. (2010) China - USA: Making New Partnership, a Rising China and Its Neighbors. Reading: Paths International. Available at:https://search.ebscohost.com/login.aspx?direct=true&db=nlebk&AN=395456&site=eds-live&scope=site (Accessed: 16 October 2023).