


1. Introduction
During a 2007 speech at the Economic Club of New York, Nobel Prize-winning economist Ben Shalom Bernanke highlighted the vital role the stock market plays in the financial system [1]. He emphasized that it serves as a crucial channel for corporate financing and an essential tool for investors to manage their wealth. Since the establishment of the Vereenigde Oostindische Compagnie in the 17th century, the world's first company to issue stocks, nearly every country has developed its own stock market. However, these markets exhibit significant variations due to differences in culture, financial environments, and political systems. As the economic superpower of the 21st century, the United States consistently holds the largest economic volume globally, with its stock market demonstrating exceptional performance. As of January 1, 2024, the total market capitalization of the U.S. stock market stands at $50,781,697.5 million. In 2023 alone, the total market value of U.S. public companies increased by 25.1%. From January 1, 2010, to December 31, 2023, the market cap of public U.S. corporations surged by 236.7% [2]. This high market capitalization, coupled with rapid growth, reflects the prosperity of the U.S. stock market. Meanwhile, China, the world's second-largest economy, has experienced rapid economic growth in the 21st century. According to CEIC Data, China’s market capitalization reached $10,776.170 billion in April 2024, ranking second globally, just behind the United States [3]. Given the prominence of these two stock markets and their respective economies, this paper will conduct a comparative study of the market mechanisms, investor strategies, and market efficiencies between the U.S. and Chinese stock markets.
2. Market Mechanism
There are distinctions between the U.S. and Chinese stock markets in terms of their market mechanisms. In the U.S., stock trading occurs through exchanges, where companies can raise funds by offering stocks or equity to investors. Stocks grant shareholders voting rights and the residual claim on company profits in the form of capital gains and dividends. Both individual and institutional investors convene at securities exchanges to engage in buying and selling stocks in the open market. The U.S. exchanges employ two distinct mechanisms for stock trading: dealer markets and auction markets, According to Bodie et al.’s book, dealer markets specialize in trading various assets, purchasing these assets, and storing them in their accounts, then profiting from the spread between bid and ask prices [4]. They also stated that the Nasdaq market functions as a dealer market, with dealers maintaining market liquidity by offering continuous buy and sell quotes, overseeing transactions, and contributing to price discovery to accurately reflect stock value. On the other hand, auction markets involve buyers and sellers submitting bids and asking prices simultaneously, with trades being executed when the highest bid meets the lowest ask. A prime example is the New York Stock Exchange (NYSE), which employs both traditional open outcry and modern electronic trading systems [5]. Auction markets are crucial for market stability and transparency by centralizing all orders to provide a fair trading platform, allowing investors to execute large transactions with lower risks [6].
Additionally, the U.S. stock market typically does not impose daily price limits but utilizes a circuit breaker mechanism to halt trading during significant market volatility, preventing panic selling. The circuit breaker has three levels: a 7% drop triggers the first level, a 13% drop triggers the second level, and a 20% drop triggers the third level, leading to a trading halt for varying durations or ending trading for the day [7]. In comparison, the Chinese stock market appears more uniform, with the Shanghai and Shenzhen Stock Exchanges primarily employing auction market mechanisms through call auctions and continuous auctions. Call auctions determine the opening price by matching buy and sell orders before the market opens, while continuous auctions match orders based on price and time priorities during market hours [7]. Chinese markets also impose daily price limits to prevent excessive volatility, with A-shares and B-shares typically limited to a 10% daily price movement, and the STAR Market and ChiNext Board limited to 20% [7]. Foreign investors cannot directly purchase Chinese stocks due to market access restrictions, foreign exchange controls, and differing regulatory frameworks. Instead, they must use specific channels like the Qualified Foreign Institutional Investor (QFII) and Renminbi Qualified Foreign Institutional Investor (RQFII) programs or mechanisms like Stock Connect to indirectly invest in China’s A-share market [8]. Conversely, the U.S. stock market is highly open to both domestic and foreign investors, allowing free investment. Investors can open brokerage accounts to trade stocks listed on the NYSE and Nasdaq freely. The U.S. Securities and Exchange Commission (SEC) strictly regulates the market to ensure fairness, transparency, and efficient operation. In contrast, China’s stock market has stricter regulations, limiting the entry of many foreign investors and potentially restricting capital inflows, while the U.S. market offers higher freedom.
3. Market Development
There is a significant temporal difference in the development of the U.S. and Chinese stock markets. In the 20th century, the influence of the United States in the financial sector gradually increased. In 1913, the establishment of the Federal Reserve System provided the U.S. with a stable central banking system, further promoting the development of its financial markets. During the Great Depression, the Bank for International Settlements was established in 1930 to facilitate cooperation among central banks. The Bretton Woods Conference in 1944 established the International Monetary Fund (IMF) and the World Bank, laying the foundation for the post-war global financial system. In the 1970s, global financial markets underwent a significant transformation. In 1971, President Nixon announced the end of the dollar's convertibility to gold, leading to the collapse of the Bretton Woods system and the introduction of floating exchange rates, which significantly impacted international financial markets [7]. The 1980s saw accelerated financial market liberalization and globalization, with the U.S. and Europe maintaining their positions as global financial centers. Historically, the U.S. financial industry developed early and experienced numerous crises. For instance, the Great Depression in the 1930s highlighted issues of overproduction and insufficient demand, epitomized by the "milk dumping" incidents. The 1970s saw the stagflation crisis triggered by the OPEC oil embargo, which caused a sharp rise in oil prices and heightened inflation [9]. The 2007 financial crisis was spurred by a housing bubble and the excessive use of derivatives and leverage, leading to a market collapse. During these crises, the stock market experienced significant changes. During the 1929 crash, the Dow Jones Industrial Average (DJIA) plummeted 23% in two days and continued to fall, reaching a low in July 1932, nearly 90% below its 1929 peak [10]. During the stagflation crisis of the 1970s, the S&P 500 Index saw substantial volatility, dropping from 120 points in early 1973 to about 62 points by the end of 1974, reflecting the impact of high inflation and low growth on the stock market [9]. From these historical events, it can be concluded that economic crises often lead to stock market crashes. The U.S. stock market has endured several significant downturns, prompting gradual improvements in market mechanisms and regulatory systems. As a result, the U.S. stock market's structure and regulatory framework have become highly robust.
In comparison, China's financial market is relatively young. Before 1978, China operated a planned economy where the financial system was highly centralized under state control, with no formal stock market or financial institutions resembling those in market economies. Financial transactions were conducted primarily through government directives rather than market mechanisms [10]. It wasn't until 1978, under the leadership of Deng Xiaoping, that China began implementing the "Reform and Opening-Up" policy, marking a significant turning point in the development of its financial markets. The early stages of reform focused on restructuring the rural and urban economic systems to stimulate economic vitality through market mechanisms. Financial reforms began with the establishment of rural credit cooperatives and urban credit cooperatives, gradually promoting market-oriented financial practices [8]. On December 19, 1990, the Shanghai Stock Exchange was officially established, becoming the first stock exchange in mainland China and marking the birth of China's stock market. Following this, the Shenzhen Stock Exchange started operating in 1991. Entering the 21st century, China's capital market experienced rapid development. In 2005, the split-share structure reform was initiated, addressing the issue of non-tradable state-owned shares, which significantly enhanced market liquidity and transparency. This reform allowed previously non-tradable shares to be traded, thus improving the overall efficiency of the market [11]. In 2003, the China Securities Regulatory Commission (CSRC) launched the Small and Medium Enterprise (SME) Board to provide a financing platform specifically for smaller companies. It can be seen that China's financial market can only be considered to have officially developed after 1978. It was not until the birth of the Shanghai Stock Exchange at the end of the 20th century that China's stock market was officially launched. Before that, the U.S. stock market had experienced many violent fluctuations such as the Great Depression and the stagflation crisis and had corresponding rules and countermeasures. Therefore, in terms of institutional improvement, China's stock market is still relatively lacking.
4. Market Efficiency
The stock markets of the two countries also differ in terms of market efficiency. In trading, investing, and finance, investors use two primary methods to analyze markets and securities: fundamental analysis and technical analysis. Fundamental analysis focuses on the quality of the asset, while technical analysis views market trends as indicators of value [7]. In the U.S. stock market, fundamental analysis is a highly effective way to predict a company's future price movements. This analysis can be conducted using financial statements (including the income statement, balance sheet, and cash flow statement, which provide a financial overview), economic indicators (GDP growth rate, inflation rate, and unemployment rate), interest rates (central bank rates can significantly affect investment value, with higher rates usually leading to lower stock prices and lower rates pushing stock prices up), and qualitative information and news to assess a company's development [7]. For example, NVIDIA, which saw tremendous growth in 2024, publishes quarterly and annual financial reports that detail its financial health, operational results, and cash flow.
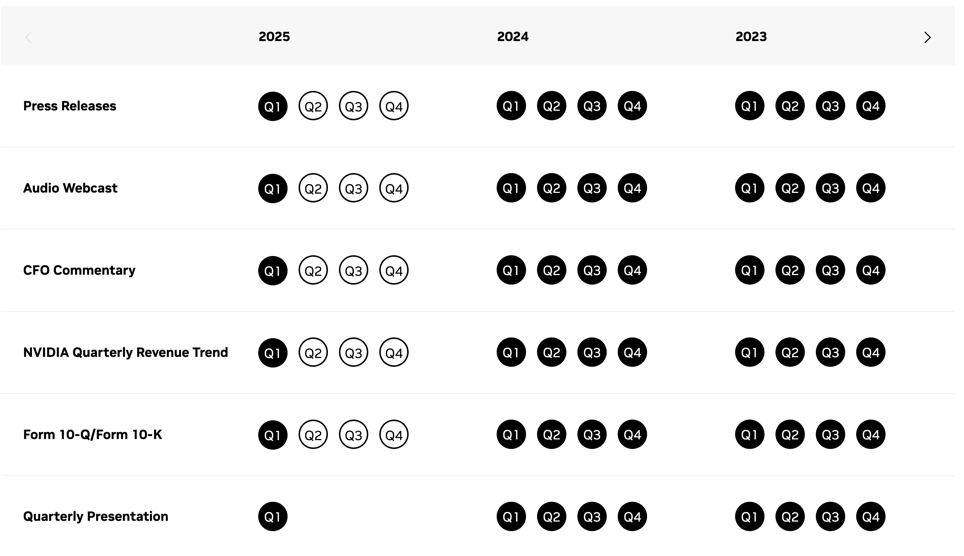
Figure 1: Investor relations of NVIDIA [12].
As shown in Figure 1, NVIDIA discloses its financial reports quarterly, ensuring transparency for stock investors. These reports serve as crucial data points for analyzing and forecasting the company's future trajectory. In addition to financial disclosures, timely updates on NVIDIA's official website provide further insights into company developments. Understanding macro market trends helps elucidate NVIDIA's impressive market performance. In the AI era, NVIDIA has emerged as a leader in the data center market, driven by widespread adoption of its GPUs in high-performance computing and AI applications. For instance, NVIDIA's H200 GPU platform plays a pivotal role in training and inference for large language models (LLMs), underscoring the company's foundational role in the AI revolution and its corresponding stock growth [12]. Technical analysis complements this understanding by evaluating historical price and volume data of financial assets such as stocks, currencies, or commodities. Unlike fundamental analysis, which assesses intrinsic value, technical analysis focuses on price movements over time, utilizing indicators like volume analysis, relative strength, chart patterns, candlestick patterns, support and resistance levels, and trend analysis [7]. In the stock market, the share price trend of NVIDIA are shown in Table 1.
Table 1: NVDIA stock information (June).
Open price (US$) | 123.22 | Market capitalization (US$) | 2.905 trillion |
High price (US$) | 124.46 | Average volume | 440.8 million |
Low price (US$) | 118.04 | Share volume | 467.2 million |
52-week high (US$) | 140.76 | Dividend yield (%) | 0.03 |
52-week low (US$) | 39.23 | Beta | 1.69 |
EPS (US$) | 1.71 | P/E ratio | 69.07 |
Table 1 shows that NVIDIA's stock price began to rise gradually at the beginning of the year and remained above the 50-day and 200-day moving averages for most of the time. This indicates strong demand for NVIDIA stock and a stable upward trend. The rising trend of the moving averages is usually seen as a buy signal, reflecting positive market sentiment. Additionally, the chart shows that the stock price exhibited strong upward trends during multiple periods, often accompanied by the RSI indicator running at high levels around 70. This means the stock was overbought at various times, indicating strong demand for NVIDIA stock and optimistic investor sentiment. Moreover, NVIDIA's stock price climbed to higher levels after breaking through key resistance levels, such as approximately $88 and $113. Once these resistance levels are broken, they often become new support levels, further consolidating the upward trend. Therefore, from both fundamental and technical analysis, it can be concluded that NVIDIA is likely to continue its upward trajectory. The actual market fluctuations have also confirmed this, demonstrating that the U.S. stock market is highly efficient, where the company's performance is often reflected in the stock price. In contrast, the situation in the Chinese stock market is more unique. The market efficiency in China is not as high, and the stock prices do not always align with the company's performance. This discrepancy highlights the differences between the two markets and suggests that there is still significant room for growth in market efficiency in the Chinese stock market.
This data comes from China Merchants Securities shows the annual performance of a New Energy Vehicles (NEV) ETF in the Chinese stock market, covering major companies in the new energy sector:K = 39.17, D = 36.28, J = 44.92. MACD = -0.149, Signal = -0.037, Difference (Histogram) = -0.112.The price decreased from a high of 1.440 to a low of 0.479, indicating a significant downward trend during this period. Both the K and D lines are below 50, and the J line is even negative, indicating that the stock is currently in an oversold condition, suggesting a potential rebound opportunity. This means that the new energy market is currently experiencing a notable downtrend. However, the Chinese government has implemented numerous favourable policies for new energy vehicles. According to a report by China Securities News, the Chinese NEV market saw sales of 882,000 units in March 2024, an increase of 85.1% month-on-month and 35.6% year-on-year, with a penetration rate of 32.7% [13]. Among these, passenger vehicle sales reached 832,000 units, up 84.3% month-on-month, while commercial vehicle sales were 51,000 units, up 99.8% month-on-month and 55.3% year-on-year. In March 2024, new energy sedans accounted for 47.0% of sales, a 33 percentage point increase from the same period last year. This indicates a favourable environment and outstanding performance for NEV enterprises. However, the stock market continues to decline. This discrepancy suggests that the companies' performances are not fully reflected in the stock market, indicating significant room for growth in the market efficiency of the Chinese stock market.
5. Conclusion
The comparative analysis of the U.S. and Chinese stock markets reveals significant distinctions in their market mechanisms, investor strategies, and operational efficiencies. The U.S. stock market, known for its extensive history and robust regulatory frameworks, functions through both dealer and auction markets, ensuring high transparency and minimal barriers to foreign investment. As a result, it maintains a dynamic, resilient, and highly efficient market environment. In contrast, the Chinese stock market, while experiencing rapid growth and ranking as the world's second-largest, operates under stricter controls such as daily price limits and constraints on foreign investment. These characteristics stem from its more recent development following economic reforms that commenced in 1978. Despite progress, inefficiencies persist in how stock prices reflect company performance. The analysis underscores the necessity for ongoing regulatory enhancements and increased openness to bolster market efficiency in China. Drawing lessons from established U.S. practices holds promise for informing future developments. Understanding these differences is pivotal for investors and policymakers alike, providing strategic insights for advancing market stability, growth, and global financial resilience.
References
[1]. The Recent Financial Turmoil and its Economic and Policy Consequences. (2007). Board of Governors of the Federal Reserve System. https://www.federalreserve.gov/newsevents/speech/bernanke20071015a.htm
[2]. Heil, T. L., Peter, F. J., & Prange, P. (2022). Measuring 25 years of global equity market co-movement using a time-varying spatial model. Journal of International Money and Finance, 128, 102708.
[3]. CEIC data. (2020). China Market Capitalization. https://www.ceicdata.com/en/indicator/china/market-capitalization.
[4]. Bodie, Z., Kane, A., & Marcus, A. J. (2023). Investments (Thirteenth edition.). McGraw Hill.
[5]. Currie, W. L., Seddon, J. J. J. M., & Van Vliet, B. (2022). From decision optimization to satisficing: Regulation of automated trading in the US financial markets. Information & Management, 59(8), 103721.
[6]. Chan, S. H., Huang, Y. C., & Lin, S. (2020). Market transparency and closing price behavior on month-end days: Evidence from Taiwan. The North American Journal of Economics and Finance, 51, 100852.
[7]. Sher, A., Sher, A., Sher, A., & Sher, A. (2024). Chinese Stock Market Integration with Developed World: A Portfolio Diversification Analysis. Heliyon, 10(9), e29413.
[8]. China briefing. (2024). Business, Legal, tax, Accounting, HR, Payroll News. https://www.china-briefing.com/
[9]. Blinder, A. S. (1979). Economic Policy and the Great Stagflation. Academic Press.
[10]. Bernanke, B. S. (1983). Nonmonetary Effects of the Financial Crisis in the Propagation of the Great Depression. The American Economic Review, 73(3), 257-276.
[11]. Brunnermeier, M. K. (2009). "Deciphering the Liquidity and Credit Crunch 2007–2008". Journal of Economic Perspectives, 23(1), 77-100.
[12]. NVIDIA Corporation. (2024). https://investor.nvidia.com/home/default.aspx
[13]. China Securities News. (2024). China's Government Policy on New Energy Vehicles. Retrieved June 25, 2024, from https://news.cnstock.com/news,bwkx-202404-5220431.htm
Cite this article
Lin,J. (2024). A Fundamental and Technical Analysis of the US and Chinese Stock Markets. Advances in Economics, Management and Political Sciences,98,137-142.
Data availability
The datasets used and/or analyzed during the current study will be available from the authors upon reasonable request.
Disclaimer/Publisher's Note
The statements, opinions and data contained in all publications are solely those of the individual author(s) and contributor(s) and not of EWA Publishing and/or the editor(s). EWA Publishing and/or the editor(s) disclaim responsibility for any injury to people or property resulting from any ideas, methods, instructions or products referred to in the content.
About volume
Volume title: Proceedings of ICFTBA 2024 Workshop: Finance in the Age of Environmental Risks and Sustainability
© 2024 by the author(s). Licensee EWA Publishing, Oxford, UK. This article is an open access article distributed under the terms and
conditions of the Creative Commons Attribution (CC BY) license. Authors who
publish this series agree to the following terms:
1. Authors retain copyright and grant the series right of first publication with the work simultaneously licensed under a Creative Commons
Attribution License that allows others to share the work with an acknowledgment of the work's authorship and initial publication in this
series.
2. Authors are able to enter into separate, additional contractual arrangements for the non-exclusive distribution of the series's published
version of the work (e.g., post it to an institutional repository or publish it in a book), with an acknowledgment of its initial
publication in this series.
3. Authors are permitted and encouraged to post their work online (e.g., in institutional repositories or on their website) prior to and
during the submission process, as it can lead to productive exchanges, as well as earlier and greater citation of published work (See
Open access policy for details).
References
[1]. The Recent Financial Turmoil and its Economic and Policy Consequences. (2007). Board of Governors of the Federal Reserve System. https://www.federalreserve.gov/newsevents/speech/bernanke20071015a.htm
[2]. Heil, T. L., Peter, F. J., & Prange, P. (2022). Measuring 25 years of global equity market co-movement using a time-varying spatial model. Journal of International Money and Finance, 128, 102708.
[3]. CEIC data. (2020). China Market Capitalization. https://www.ceicdata.com/en/indicator/china/market-capitalization.
[4]. Bodie, Z., Kane, A., & Marcus, A. J. (2023). Investments (Thirteenth edition.). McGraw Hill.
[5]. Currie, W. L., Seddon, J. J. J. M., & Van Vliet, B. (2022). From decision optimization to satisficing: Regulation of automated trading in the US financial markets. Information & Management, 59(8), 103721.
[6]. Chan, S. H., Huang, Y. C., & Lin, S. (2020). Market transparency and closing price behavior on month-end days: Evidence from Taiwan. The North American Journal of Economics and Finance, 51, 100852.
[7]. Sher, A., Sher, A., Sher, A., & Sher, A. (2024). Chinese Stock Market Integration with Developed World: A Portfolio Diversification Analysis. Heliyon, 10(9), e29413.
[8]. China briefing. (2024). Business, Legal, tax, Accounting, HR, Payroll News. https://www.china-briefing.com/
[9]. Blinder, A. S. (1979). Economic Policy and the Great Stagflation. Academic Press.
[10]. Bernanke, B. S. (1983). Nonmonetary Effects of the Financial Crisis in the Propagation of the Great Depression. The American Economic Review, 73(3), 257-276.
[11]. Brunnermeier, M. K. (2009). "Deciphering the Liquidity and Credit Crunch 2007–2008". Journal of Economic Perspectives, 23(1), 77-100.
[12]. NVIDIA Corporation. (2024). https://investor.nvidia.com/home/default.aspx
[13]. China Securities News. (2024). China's Government Policy on New Energy Vehicles. Retrieved June 25, 2024, from https://news.cnstock.com/news,bwkx-202404-5220431.htm