


1. Introduction
Inflation is partly triggered by the war between Russia and Ukraine in the 2023 in that it increases cost of labor and natural gases. What’s more, the surging pressure on supply chain and increasing demand for consumer goods contribute to the inflation. Under the circumstance, The Federal Reserve Systems raising Federal Funds Rate in order to slow down the inflation. On May 1, 2022, The Federal Reserve Systems raised Federal Funds Rate to 0.75. On June 15, 2022, The Federal Reserve Systems raised its Federal Funds Rate for about 75%, which greatly improve the attractiveness of US dollar. Researchers has showed that US monetary policy has significant influence on Asian stock markets [1]. Several studies show some insightful financial indicators can be helpful for investors to characterize different type of firms. Based on value investing strategy, Robert Novy-Marx finds gross profits-to-assets can be a very useful profitability ratio when it comes to forecasting the stock returns or company performance [2]. Additionally, Easton finds that PEG ratio is play a significant role in the stock evaluation in the short run forecast, which providing a ranking that is superior to ranking based on PE ratios [3]. Nowadays, investors in the stock market are inclined to have a detail information about the stocks’ performance prediction using methods like machine learning or momentum investing strategy. It is hard to overstate the significance of a well-informed prediction about stock market in that investors are more likely to make well-informed decisions [4].
There are myriads of articles discussing US Federal Funds Rate’s impact and interest rate hikes on the global economy and global stock markets. Lots of researchers highlights the negatively relationship between Federal Funds Rate and foreign stock market. Jeongsim finds that the surging US Federal Funds Rate generates different impact on the firms with different characteristics in a developing market by using linear regression model, which oversimplified the complexity of stock market [5]. Researchers also apply supervised machine learnings like support vector machines and artificial neural networks as the simulated model to predict the stocks’ performance [6]. What is more, researchers also apply a popular suite of algorithms called Random Forest Classifier to predict the direction of stock market based on Relative Strength Index and stochastic oscillator [7]. Besides, Meher has utilized random forest algorithm to construct model to forecasting stock prices of fintech companies of India [8]. However, this study does not include several significant financial indicators like gross profits-to-assets and PEG ratio, which offer precious information about a firm’s financial operation.
This paper built on several branch of articles. Considering the vacancy and some drawbacks of present research. This study considers combining the financial analysis with machine learning algorithm. Concluding the most prevailing and insightful financial indicators as the input to train the model, this paper compared the efficiency of linear discriminant analysis by k-fold Cross-Validation, decision tree model and Random Forest Classifier based on R. The remainder of the paper is constructed as follows. Section 2 presents research design and methodology. Section 3 presents the results and discussion. Section 4 contains this paper conclusion.
2. Data and Methods
2.1. Data
This paper collects the US Federal Funds Rate, CSI 500 Index, China Small-Cap Index, NASDAQ index, SandP 500 Index from quantmod, which is a prevailing package containing important financial time series data. Additionally, this paper collected US and China stock market data from Wind, which is a leading provider of financial information services in China. Since The US Federal Reverse Systems raised Federal Funds Rate from December 31, 2021, to June 30, 2023, this paper collects relevant financial data of all listed companies in China and the United States from June 30, 2021 to December 31, 2021, and from June 30, 2023 to December 31, 2023. The sample are further filtered according to several processing steps. This includes data cleaning, feature sorting, filling missing value and calculate other significant indicators. Noted that this paper does not take finance sector company into consideration in that its financial operation is difficult to predict and analysis. Table 1 presents many financial variables on data sample for a firm and its column name in the R processing since the Tibble format in R could not recognize space or Chinese during operating the datasets. After cleaning US and China stock market data, one can use ggplot2, which is an elegant data visualization package in R to create graph for datasets sorted by its sector. Fig, 1 shows a box plot graph of the stocks contained within the dataset.
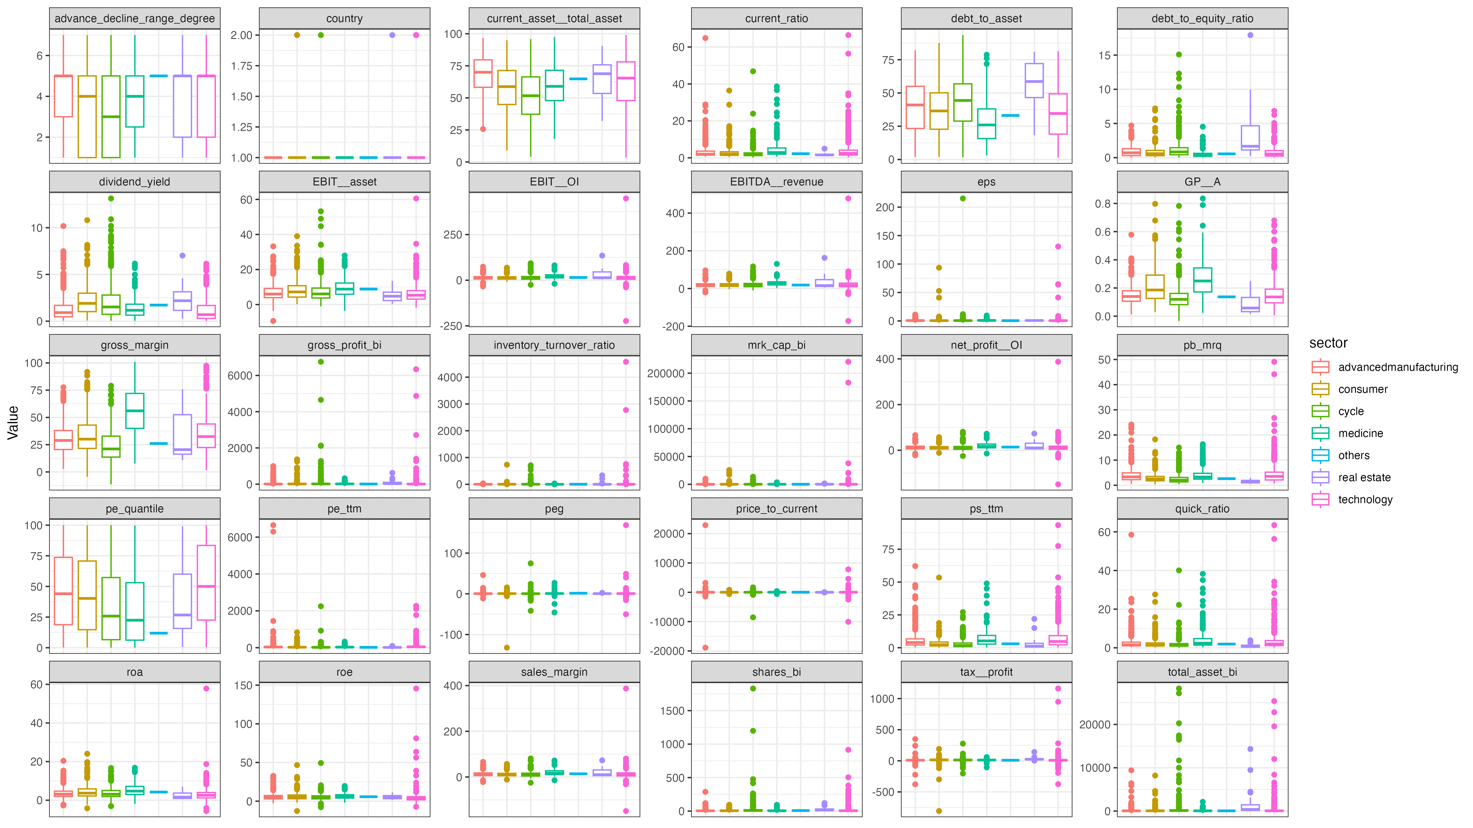
Figure 1: Summary statistics by sector.
Table 1: Comparison table of abbreviated column names and their actual name in data processing
Abbreviated column names | Actual names |
mrk_cap_bi | Market capitalization in CNY billions |
shares_bi | Number of shares in billions |
advance_decline_range_degree | stock returns degree |
pb_mrq | PB ratio in most recent quarter |
pe_ttm | PE ratio in trailing twelve months |
ps_ttm | PS ratio in trailing twelve months |
net_profit__OI | Net profit divided by operating income |
EBIT__OI | EBIT divided by operating income |
EBIT__asset | EBIT divided by total assets |
tax__profit | Tax divided by net profit |
EBITDA__revenue | EBITDA divided by revenue |
current_asset__total_asset | Current assets divided by total assets |
gross_profit_bi | Gross profit in CNY billions |
total_asset_bi | Total assets in CNY billions |
GP__A | Gross profit divided by total assets |
2.2. Methodology
This paper using quantitively methods in order to predict types of stock returns and compared predictions from different model. The chosen model involves the use of supervised machine learning like linear discriminant analysis by k-fold cross-validation, decision tree and random forest classifier, implemented by using R. Supervised machine learning approaches can be applicable to classify target variable as compared with simple linear regression, it can handle high-dimensional data effectively.
This paper set the stock returns as the dependent variable and set the other financial indicators as the independent variable. However, it is common sense that there exists myriads of other non-financial indicators or factors that exert significant impact on the stock returns. Additionally, there still exists idiosyncratic error like investors’ unpredictable behaviors. As Gertler and Mark discuss that financial factors and technical factors contribute to business fluctuations mutually [9]. Accordingly, one can construct the following linear equation.
\( stock returns=λ*Ϝ+(1-λ)Ν+E \) (1)
where represents the percentage of financial fundamental factors’ impact on the stock returns, F represents the financial fundamental factors and N represents the non-financial factors, and represents the idiosyncratic risk factors. This paper is mainly focus on making a reliable prediction and estimation on financial fundamental factors.
Linear discriminant analysis, which is a supervised linear machine learning method used to classify variables and deduct its’ dimensionality. Its aim is to find a linear combination of features that best separates two or more classes of objects by maximizing the between classes’ variance to the within classes’ variance ratio. It can also reduce the number of features while keeping as much of the class discriminatory information as possible and transform the features into a lower-dimensional space. Xanthopoulos, Petros has discussed how to construct generic formulation of linear discriminant analysis model [10]. The within-class scatter matrix \( {S_{W}} \) is defined as the following equation.
\( {S_{w}}=\sum _{k=1}^{K}\sum _{iϵ{C_{k}}}({x_{i}}-{μ_{k}}){({x_{i}}-{μ_{k}})^{T}} \) (2)
The between-class scatter matrix \( {S_{B}} \) is defined as the following equation.
\( {S_{B}}=\sum _{k=1}^{K}{N_{k}}({μ_{k}}-μ){({μ_{k}}-μ)^{T}} \) (3)
where \( μ \) is the overall mean of the data, \( {N_{k}} \) is the number of samples in class \( k \) , X as the input data matrix, and \( {μ_{k}} \) as the mean vector of class \( k \) . Goal of linear discriminant analysis is to find the matrix W that maximizes the LDA ratio:
\( LDA ratio={argmax_{W}}\frac{|{W^{T}}{S_{W}}W|}{|{W^{T}}{S_{W}}W|} \) (4)
Decision Trees model is a supervised machine learning method. They operate via splitting the datasets into subsets based input variable’s category, generating a decisions tree-like estimation model. In Decision Trees model, root node represents the topmost node in a decision tree, internal nodes tests on features; each internal node splits the data into subsets based on a feature's value, and leaf nodes represent the outcome or the final class labels. There are several parameters on decision trees model in R, minsplit represents the least observations that have to occur inside a node so that a split could be attempted, minbucket means the least observations in any terminal node, cp means the complexity, and maxdepth means the maximum depth of any node of the final tree. Random Forest Classifier is an ensemble supervised machine learning method based on Decision Trees. It conducts by building a large amount of decision trees during training and outputting individual trees’ mean prediction. Random Forest algorithm is used to mitigate the risk of overfitting in that using just one decision tree will cause the overfitting problem. By constructing multiple decision trees, it reduces the unfavorable risk of simple one decision tree and improve the accuracy of the model. It is widely used because its simplicity and accuracy.
The model evaluation process typically includes assessing both the classification accuracy and the model's ability to make right prediction to new data. By drawing confusion matrix, it can summarize different model’s evaluation accuracy and performance. It will show counts of true positive (TP), true negative (TN), false positive (FP), and false negative (FN) predictions. The Precision represents the degree that TP predictions take from all positive predictions. The Recall, researchers sometimes call it Sensitivity, represents the degree that TP predictions from actual positive examples. Precision and Recall combine to generate F1 score, which represents the harmonic mean of them, providing a balance between the Precision and Recall. Precision, Recall and F1 Score are defined as follows.
\( Precision=\frac{TP}{TP+FP} \) (5)
\( Recall=\frac{TP}{TP+FN} \) (6)
\( F1 Score=2* \frac{Precision*Recall}{Precision+Recall} \) (7)
The ROC, which represents the plot chart for true positive rate (TPR) against the false positive rate (FPR) at different classification thresholds, The AUC, which represents the area under the ROC, is calculating using One-vs-All approach. The MSE, which represents Mean Squared Error, measures the average squared difference between the predicted and actual values. R-squared, which predicts the coefficient of determination that indicates the proportion of the variance in the dependent variable predictable from the independent variables.
This paper also uses k-fold cross-validation as a method to evaluate the performance of selected model. It assists to make sure that model responds well to unseen data and provides a strong prediction of its performance by reducing the bias and variance that can arise from a single train-test split. It can reduce overfitting effectively and make performance estimation more reliable. This paper changes the k number in order to make an effective evaluation about the model performance. As mentioned below, this paper will be using machine learning package in R to calculate pertinent measuring variable and compare with each other. Then it will be safely to conclude which one is the better model in predicting the stock returns range.
3. Results and Discussion
3.1. Trending Analysis
Line chart is frequently utilized to visualize trends over time. number in order to make an effective evaluation about the model performance. To reflect the relationship between US Federal Funds Rate and stock market indices of the US and China, this paper plots the US Federal Funds Rate and stock market indices of the US and China against the X-axis in R by converging two datasets based on the same time period. It is tricky to analyze and run the data to create elegant graph. Fig. 2 shows the relationship between US Federal Funds Rate and stock market indices of the US and China.
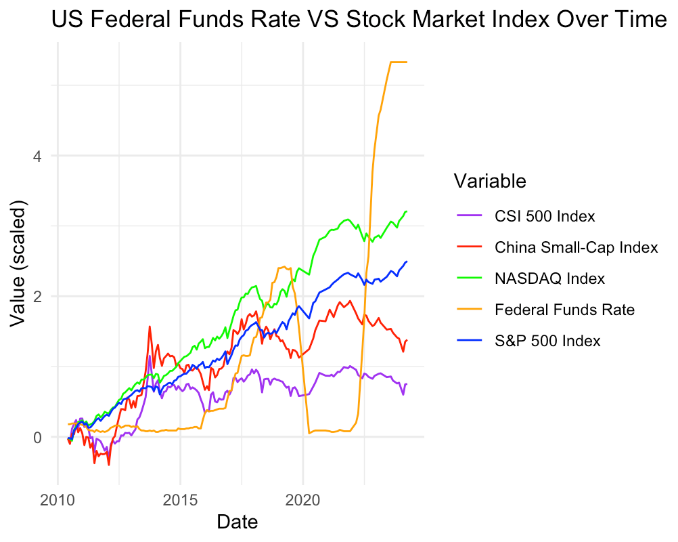
Figure 2: line chart for US Federal Funds Rate and stock market index.
Seen from Fig. 2, there exists obviously strong relationship between US Federal Funds Rate and representative US and China stock market index. The sharp increase in the Federal Funds Rate around 2021-2022 does not showcase an instant inverse impact on the stock indices. Nevertheless, there are fluctuations, suggesting some sensitivity to rate changes. Compared the US index with China index, US stock indices seem less volatile compared to Chinese index during this rate hike period. The US stock indices (NASDAQ and S&P 500) show resilience and a great upward trend, which means the US Federal Systems’ policy greatly spur the US economy. On the contrary, China index seems to showcase higher volitivity and a great downward trend, which means US Federal Funds Rate hike cause greatly negative impact on the China capital market. It also represents that external factor specific to the China stock market is playing a significant role in the economy development.
3.2. Model Performance and Prediction Result
The dataset is split into two parts to construct and evaluate the prediction models: a training set and a testing set. This paper uses 80% of the dataset to train the model and the rest 20% is used to test the prediction accuracy on the unseen data. All coding for this study is implemented using R with mlr3verse library. For Linear Discriminant Analysis, this paper utilizes several steps to construct the model, including reading data, prepossessing, training a classification model, evaluating its performance, and visualizing the results.
After reading and processing data, this model remove variables which is constant to the target variable. After that, this model creates a classification task and splitting dataset into training and testing data. Then, this model utilizes k-fold cross-validation and set k into 5 to evaluate the model’s accuracy and performance. K-fold cross-validation can provide a more reliable estimation of model efficiency compared to single train-test split, as it uses all data points for both training and evaluation. Additionally, averaging the predictions over multiple iterations can assist to reduct the variance in the performance metric. Using linear discriminant analysis, the result turns out to be that there are six main factors which can help investor to determine the stock return. What is more, by utilizing k-fold cross-validation, this paper finds that the accuracy of the model performance is about 40.2%.
Fig. 3 shows the 2D result visualization of linear discriminant analysis algorithm prediction model based on the two most significant factors LD1 and LD2, this paper first converts the target variable back to character and adds linear discriminant analysis predictions to the Tibble. Then, one plots a 2D scatter plot with confidence ellipses. Fig. 4 shows the 3D result visualization of linear discriminant analysis algorithm prediction model based on the three most significant factors LD1, LD2, and LD3.
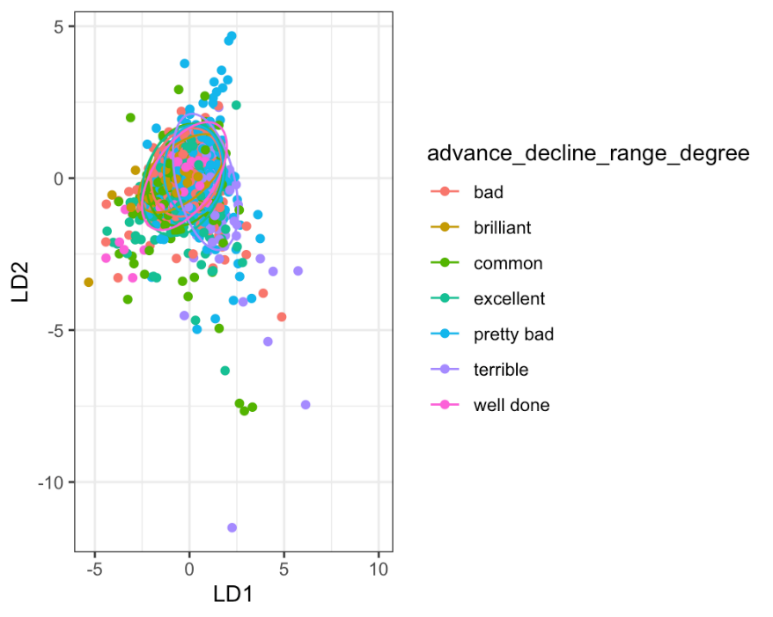
Figure 3: linear discriminant analysis 2D result.
This paper construct decision tree model by setting the complexity parameter to 0, which means the decision tree can grow as large as possible. Besides, this model has set the maximum depth of the tree to 20. After running the source data, it turns out the result that the accuracy of decision tree model is about 62.67%. The random forest model is based on the decision tree model that mentioned above. This model constructs random forest model by setting tree number as 500, considered features to 5, and minimum size of terminal nodes as 10. Then this paper use the same method as decision tree model to show the accuracy of the model. It turns out the result that model’s accuracy is about 99.2%, which is brilliant as the model can predict the financial factor well based on the history data. This model visualizes the result by drawing confusion matrix. Fig. 5 showcases the relationship between the original data and prediction results.
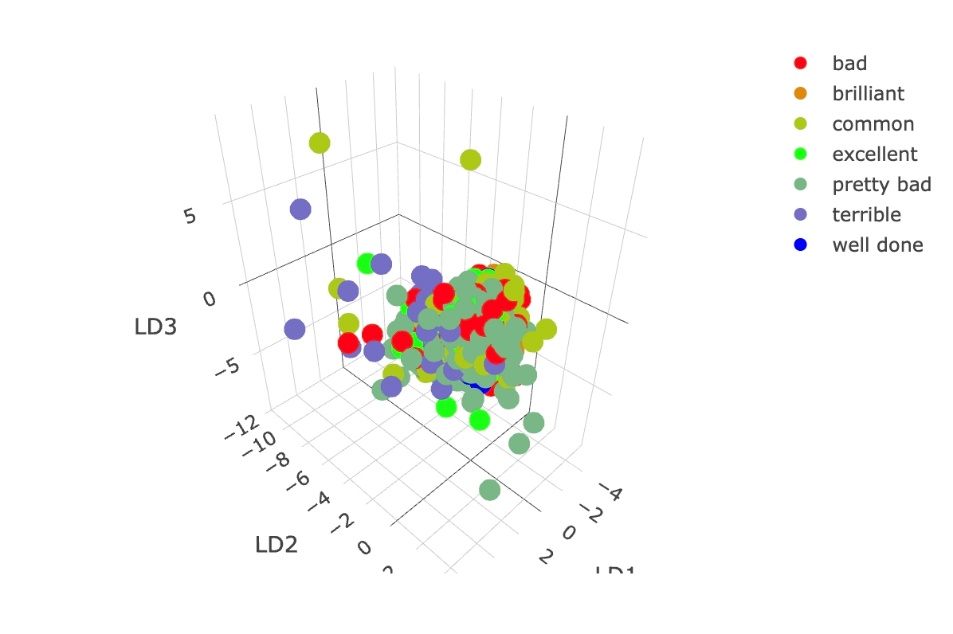
Figure 4: linear discriminant analysis 3D result.
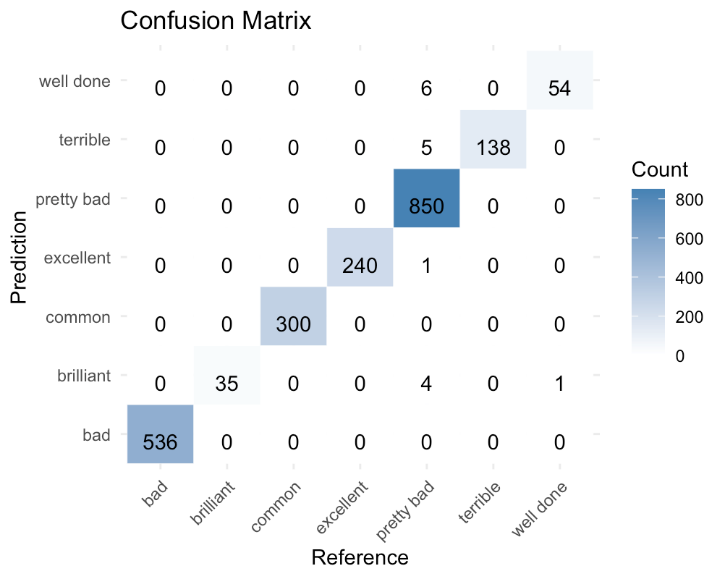
Figure 5: Random forest model confusion matrix
3.3. Result Comparison and Implications
The result of the linear discriminant analysis, decision tree and random forest model to predict the financial fundamental factor of the stock return are being measured by compare the model accuracy. It is apparent that the accuracy of the linear discriminant analysis is the lowest while random forest model is the highest. It is clearly means that the supervised machine learning is a useful and helpful tool as investor or financial institutes are trying to predict the stock return. Additionally, the stock return financial fundamental is determined by myriads of factors and those factors like profitability ratio and evaluation ratio are not linearly interact with each other’s. Several financial ratios interact with each other like neural network in human brain. Accordingly, nonlinear model will make better outcome when the models are trying to make prediction. However, to the best of the knowledge, there is no study that use the same gross profit divided by the total assets as the profitability ratio and peg ratio as evaluation ratio to make prediction about stock financial fundamental factor. Besides, there is no study only focus on F, which means financial fundamental factor in equation 1. With the good accuracy of random forest model, it is much better than instant random guessing,
3.4. Limitations and Prospects
The limitation of this paper is related to the fact that this paper concerned only about financial fundamental factor F in equation 1. Nonetheless, it does not take the ratio that represents the influence ratio of financial factor to non-financial factor. What’s more, this paper does not quantify the non-financial factor and analyze it since it is hard to quantify all the variables that happened to listed companies. Future research could quantify the non-financial factor by combining the knowledge of public finance, behavioral economics, behavioral psychology, social psychology and macropsychology to make precise estimation about the non-financial factor and . Besides, further research could be done by digging out the factors that have impact on the non-financial factor and .
4. Conclusion
This study is aimed to develop a predictive model for financial factor that exert significant impact on the stock return, employing linear discriminant analysis, classification decision tree algorithm and random forest algorithm. The models consider two critical determinants based on value investing strategy: company’s profitability ratio gross profit divided total assets and PEG ratio. After comparing models’ result, it turns out the result that the random forest model can best predict the financial factor, whose accuracy reaches 99.2%. Future research can dig out more financial ratios F, quantify the non-financial factors N and the influence ratio . This research provides important practical insights for investors and financial institute to make prediction about the financial factors that affect the stock returns based on prevailing financial ratio like profitability ratio and evaluation ratio. Besides, it constructs an equation for investor to quantify financial factors and non-financial factors when they are making investment decisions.
References
[1]. Narayan, S. and Narayan, P.K. (2012). Do US macroeconomic conditions affect Asian stock markets. Journal of Asian Economics, 23(6), 669-679.
[2]. Novy-Marx, R. (2013). The other side of value: The gross profitability premium. Journal of financial economics, 108(1), 1-28.
[3]. Easton, P.D. (2004). PE ratios, PEG ratios, and estimating the implied expected rate of return on equity capital. The accounting review, 79(1), 73-95.
[4]. Bousoño-Calzón, C., Bustarviejo-Muñoz, J., Aceituno-Aceituno, P. and Escudero-Garzás, J.J. (2019). On the economic significance of stock market prediction and the no free lunch theorem. IEEE Access, 7, 75177-75188.
[5]. Kim, J. (2023). Stock market reaction to US interest rate hike: evidence from an emerging market. Heliyon, 9(5).
[6]. Hsu, M.W., Lessmann, S., Sung, M.C., Ma, T. and Johnson, J.E. (2016). Bridging the divide in financial market forecasting: machine learners vs. financial economists. Expert systems with Applications, 61, 215-234.
[7]. Khaidem, L., Saha, S. and Dey, S.R. (2016). Predicting the direction of stock market prices using random forest. arxiv preprint arxiv:1605.00003.
[8]. Meher, B.K., Singh, M., Birau, R. and Anand, A. (2024). Forecasting stock prices of fintech companies of India using random forest with high-frequency data. Journal of Open Innovation: Technology, Market, and Complexity, 10(1), 100180.
[9]. Gertler, M., and Hubbard, R. G. (1988). Financial factors in business fluctuations. National Bureau of Economic Research 13.
[10]. Xanthopoulos, P., Pardalos, P. M., Trafalis, T.B., Xanthopoulos, P., Pardalos, P.M. and Trafalis, T.B. (2013). Linear discriminant analysis. Robust data mining, 27-33.
Cite this article
Fan,Y. (2024). Stock Return Prediction under US Federal Funds Rate Hike Based on Supervised Machine Learning. Advances in Economics, Management and Political Sciences,107,104-112.
Data availability
The datasets used and/or analyzed during the current study will be available from the authors upon reasonable request.
Disclaimer/Publisher's Note
The statements, opinions and data contained in all publications are solely those of the individual author(s) and contributor(s) and not of EWA Publishing and/or the editor(s). EWA Publishing and/or the editor(s) disclaim responsibility for any injury to people or property resulting from any ideas, methods, instructions or products referred to in the content.
About volume
Volume title: Proceedings of ICFTBA 2024 Workshop: Finance's Role in the Just Transition
© 2024 by the author(s). Licensee EWA Publishing, Oxford, UK. This article is an open access article distributed under the terms and
conditions of the Creative Commons Attribution (CC BY) license. Authors who
publish this series agree to the following terms:
1. Authors retain copyright and grant the series right of first publication with the work simultaneously licensed under a Creative Commons
Attribution License that allows others to share the work with an acknowledgment of the work's authorship and initial publication in this
series.
2. Authors are able to enter into separate, additional contractual arrangements for the non-exclusive distribution of the series's published
version of the work (e.g., post it to an institutional repository or publish it in a book), with an acknowledgment of its initial
publication in this series.
3. Authors are permitted and encouraged to post their work online (e.g., in institutional repositories or on their website) prior to and
during the submission process, as it can lead to productive exchanges, as well as earlier and greater citation of published work (See
Open access policy for details).
References
[1]. Narayan, S. and Narayan, P.K. (2012). Do US macroeconomic conditions affect Asian stock markets. Journal of Asian Economics, 23(6), 669-679.
[2]. Novy-Marx, R. (2013). The other side of value: The gross profitability premium. Journal of financial economics, 108(1), 1-28.
[3]. Easton, P.D. (2004). PE ratios, PEG ratios, and estimating the implied expected rate of return on equity capital. The accounting review, 79(1), 73-95.
[4]. Bousoño-Calzón, C., Bustarviejo-Muñoz, J., Aceituno-Aceituno, P. and Escudero-Garzás, J.J. (2019). On the economic significance of stock market prediction and the no free lunch theorem. IEEE Access, 7, 75177-75188.
[5]. Kim, J. (2023). Stock market reaction to US interest rate hike: evidence from an emerging market. Heliyon, 9(5).
[6]. Hsu, M.W., Lessmann, S., Sung, M.C., Ma, T. and Johnson, J.E. (2016). Bridging the divide in financial market forecasting: machine learners vs. financial economists. Expert systems with Applications, 61, 215-234.
[7]. Khaidem, L., Saha, S. and Dey, S.R. (2016). Predicting the direction of stock market prices using random forest. arxiv preprint arxiv:1605.00003.
[8]. Meher, B.K., Singh, M., Birau, R. and Anand, A. (2024). Forecasting stock prices of fintech companies of India using random forest with high-frequency data. Journal of Open Innovation: Technology, Market, and Complexity, 10(1), 100180.
[9]. Gertler, M., and Hubbard, R. G. (1988). Financial factors in business fluctuations. National Bureau of Economic Research 13.
[10]. Xanthopoulos, P., Pardalos, P. M., Trafalis, T.B., Xanthopoulos, P., Pardalos, P.M. and Trafalis, T.B. (2013). Linear discriminant analysis. Robust data mining, 27-33.