


1. Introduction
The last few decades have focused on forecasting the volatility of financial assets, as it is a key indicator for assessing the risks associated with these assets over a given time frame [1]. Conversely, certain assets have been recognized for their ability to balance portfolio volatility, with gold being a prominent example due to its stabilizing properties [2]. It is well known that gold has always been a very valuable asset, and extensive research on the volatility of its price has helped to reduce the risks associated with gold investments, making it an important tool for hedging and portfolio diversification in today's economy [3]. On the other hand, investors who are bearish on currency and capital market developments prefer gold as a protective asset. Gold is often seen as an "asset of last resort", i.e. an asset that investors trust when capital markets in developed countries do not provide the desired return [4]. Machine learning is a data analytics technique for building automated analytical models, and using machine learning models to forecast gold prices is currently the dominant forecasting method [5]. In this research, two machine learning models, the LSTM model and Random Forest, are used to predict the price of gold by training on the past price of gold to make predictions based on the current market value. For this purpose, this paper uses the Gold Forecast dataset available on the Kaggle website. The dataset contains seven types of data related to the price of gold for the ten-year period from 2013 to 2023: date, price, maximum opening price, minimum opening price, volume, and rate of change. In the actual coding, the date, price, maximum opening price, and minimum opening price were chosen as the relevant data for the final forecast. Figure 1 shows the basic trend of the gold price over the ten-year period.
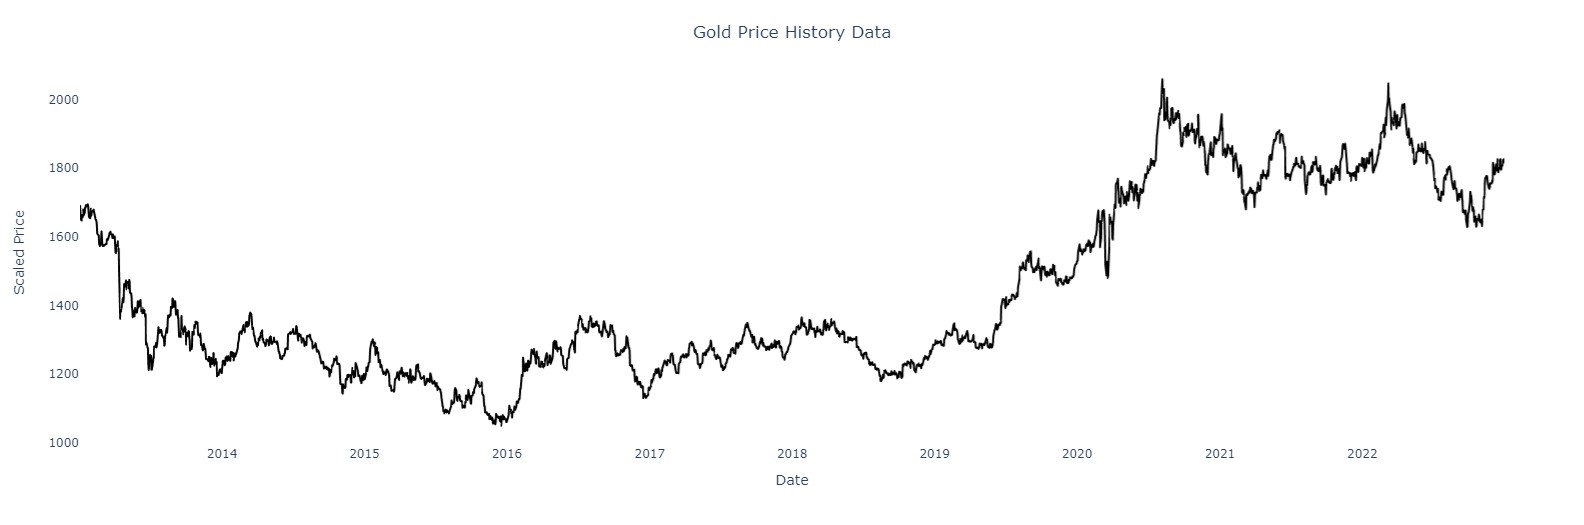
Figure 1: Gold price historical data (Picture credit: Original).
2. Literature Review
These are several examples from the literature that use machine learning models to prediction the price of gold. Naveen and Arumugam conducted at Data Analysis Laboratory, Saveetha College of Engineering, compared the performance of LSTM algorithm and Random Forest algorithm in stock market forecasting. The sample size was calculated using GPower software with 20 samples (10 in each group). They concluded that LSTM algorithm shows better performance than random forest algorithm in simulation with higher average accuracy and lower error [6]. Basher and Sadorsky used a tree-based machine learning approach and a logit model for predicting the direction of bitcoin and gold prices and emphasized the effectiveness of random forests and boosting techniques in improving prediction accuracy. They find that the random forest and tree bagging methods predict the trajectory of Bitcoin and Gold Prices with higher accuracy and kappa values compared to the logit model, and that the accuracy remains stable even during periods of volatility [7]. Schmidhuber and Hochreiter proposed the Long Short-Term Memory network, which addresses the limitations of traditional Recurrent Neural Networks (RNNs) by using three gates to learn short-term and long-term dependencies: input, output, and forgetting. They produce good results, however the comparison of different algorithms is lacking [8].
3. Methodology
3.1. Data Selection and Processing
Pre-processing of the dataset included checking for missing values, removing unnecessary columns, date format conversion and sorting, and data type conversion. Two separate subsets were created from the whole data set: a training set that included 85% of the data and a testing set that included 15% of the data. This division is illustrated in Figure 2, where the red line represents the test set. This was followed by visual validation, index reset, normalization, creation of 30 sliding windows for the time series dataset, and dataset format conversion functions for subsequent modelling and analysis.
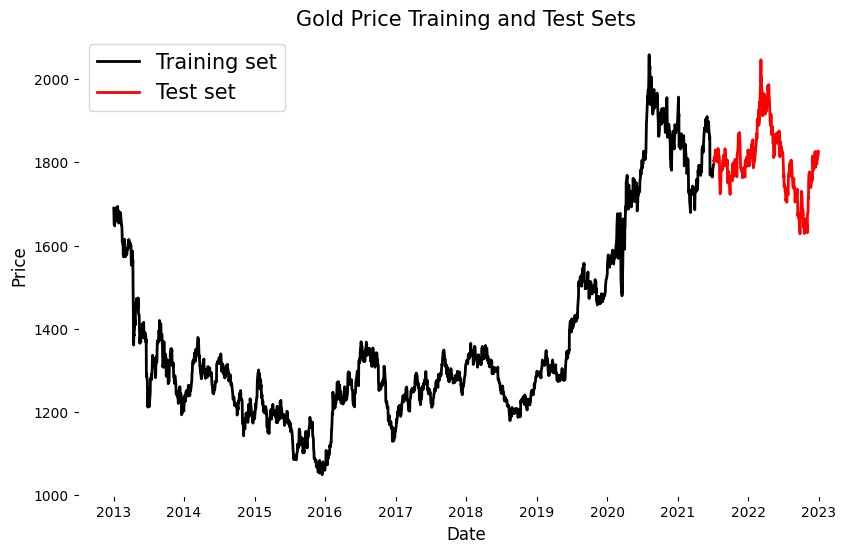
Figure 2: Gold price training and test sets (Picture credit: Original).
3.2. LSTM Model
The preliminary model utilized in this study is a deep learning model based on a LSTM for the processing of time series data. The model first processes the input time window data through three stacked LSTM layers. Each LSTM layer comprises an oblivion gate, an input gate, and an output gate which regulate the flow of information through a sigmoid function [9]. The forgetting gate is responsible for determining the impact of the memory state of the previous instant on that of the current instant. The input gate controls the manner in which the input of the current instant updates the memory state. The output gate regulates the manner in which the memory state is transformed into the output of the current instant. Each layer is followed by batch normalization and dropout operations, and finally the final prediction is obtained by a fully connected neural network. The model is shown in Figure 3 and the formulae are also shown below [10].
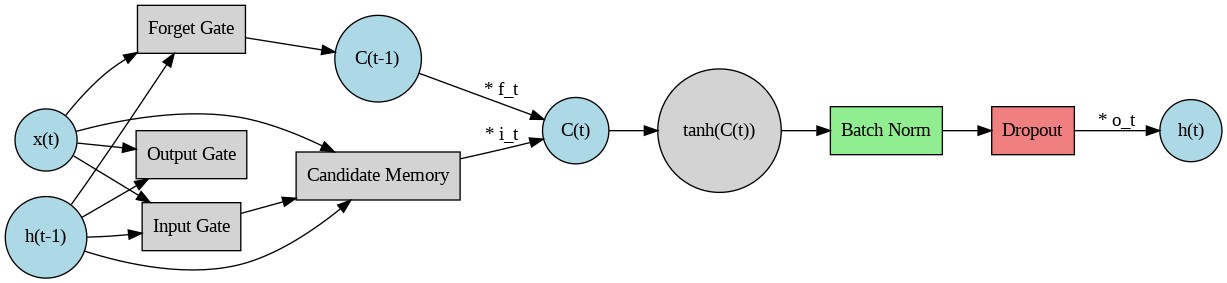
Figure 3: LSTM cell diagram (Picture credit: Original).
Forget gate: \( {f_{t}}=σ({W_{f}}\cdot [{h_{t-1}},{x_{t}}]+{b_{f}}) \) (1)
Input gate: \( {i_{t}}=σ({W_{i}}\cdot [{h_{t-1}},{x_{t}}]+{b_{i}}) \) (2)
Candidate memory update: \( \widetilde{{C_{t}}}=tanh{({W_{C}}\cdot [{h_{t-1}},{x_{t}}]+{b_{C}})} \) (3)
Memory cell update: \( {C_{t}}={f_{t}}\cdot {C_{t-1}}+{i_{t}}\cdot \widetilde{{C_{t}}} \) (4)
Output gate: \( {o_{t}}=σ({W_{o}}\cdot [{h_{t-1}},{x_{t}}]+{b_{o}}) \) (5)
Update: \( {h_{t}}={o_{t}}\cdot tanh{({C_{t}})} \) (6)
In comparison with the conventional LSTM model, this model subdivides the batch normalization and dropout operations after each LSTM layer and consequently has obvious advantages in training stability, speed, and generalization ability.
3.3. Random Forest Model
Compared to the previous model, the random forest model is a second model in this study with a relatively simple definition. From Figure 4, the number of trees in the forest is defined by the n estimators parameter. A greater number of trees is usually more beneficial as it leads to improved performance and greater stability in the model. Conversely, if the max depth parameter is not set, the tree will split until all leaf nodes are pure. The minimum number of samples required for each internal node to subdivide is specified by the min samples split parameter. This is set to avoid the problem of over fitting. Finally, the number of samples required for each leaf node is also set by the min samples leaf parameter. This parameter is used to avoid over fitting. The random state parameter ensures that the randomization process is reproducible [11].
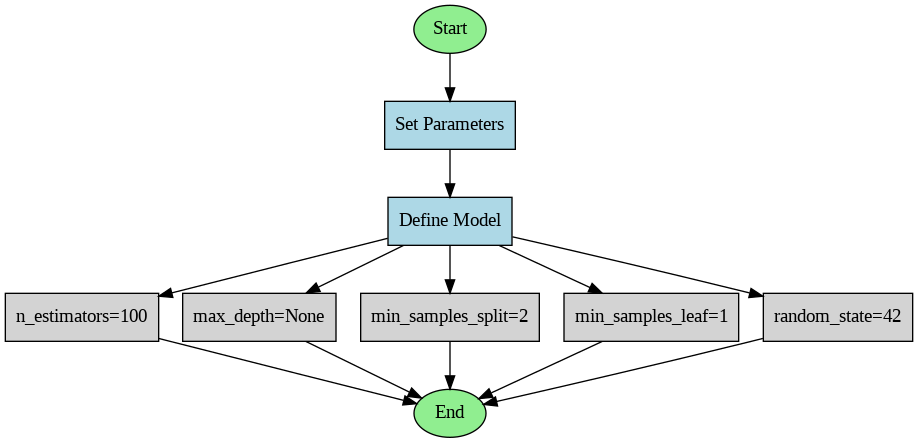
Figure 4: Random forecast diagram (Picture credit: Original).
4. Results
In this article, several metrics such as Mean Absolute Percentage Error (MAPE), Mean Square Error (MSE), Root Mean Square Error (RMSE), Mean Absolute Error (MAE) and R-squared are used to measure the predictive accuracy of the two different machine learning models. Their respective formulae are given separately below.
M \( APE=\frac{1}{n}\sum _{i=1}^{n}|\frac{{y_{i}}-\hat{{y_{i}}}}{{y_{i}}}|×100 \) (7)
\( MSE=\frac{1}{n}\sum _{i=1}^{n}{({y_{i}}-\hat{{y_{i}}})^{2}} \) (8)
\( RMSE=\sqrt[]{\frac{1}{n}\sum _{i=1}^{n}{({y_{i}}-\hat{{y_{i}}})^{2}}} \) (9)
\( MAE=\frac{1}{n}\sum _{i=1}^{n}|{y_{i}}-\hat{{y_{i}}}| \) (10)
\( {R^{2}}=1-\frac{\sum _{i=1}^{n}{({y_{i}}-\hat{{y_{i}}})^{2}}}{\sum _{i=1}^{n}{({y_{i}}-\bar{y})^{2}}} \) (11)
As shown in Table 1, 5 measures of predictive accuracy were used for two different models.
Table 1: Comparison of evaluation metrics.
Method | Long Short-Term Memory | Random Forest |
MAPE | 0.035 | 0.020 |
MSE | 0.001 | 0.0003 |
RMSE | 0.034 | 0.020 |
MAE | 0.026 | 0.015 |
R-squared | 0.804 | 0.933 |
According to the data analyzed previously, the second group of Random Forests showed significantly better predictions on all metrics: lower MSEs, RMSEs, MAPEs, and MAEs and an R-square closer to 1 indicating that the predictions of the second group of models are much closer to the actual values and have a higher degree of accuracy and predictive power.
In this paper, two more visualizations are shown after the metrics assessment, firstly a graph comparing the prediction results of two models is plotted as shown in Figure 5, where it can be clearly seen that the green line representing the prediction results of the Random Forest model fits the test results more closely than the red which is the LSTM model. Another visualization chart is a scatter plot to compare the performance of the two methods in predicting the price of gold. By comparing the distributional trends in Figure 6, although both models have relatively tightly clustered scatters around the diagonal line the LSTM model is relatively more dispersed.
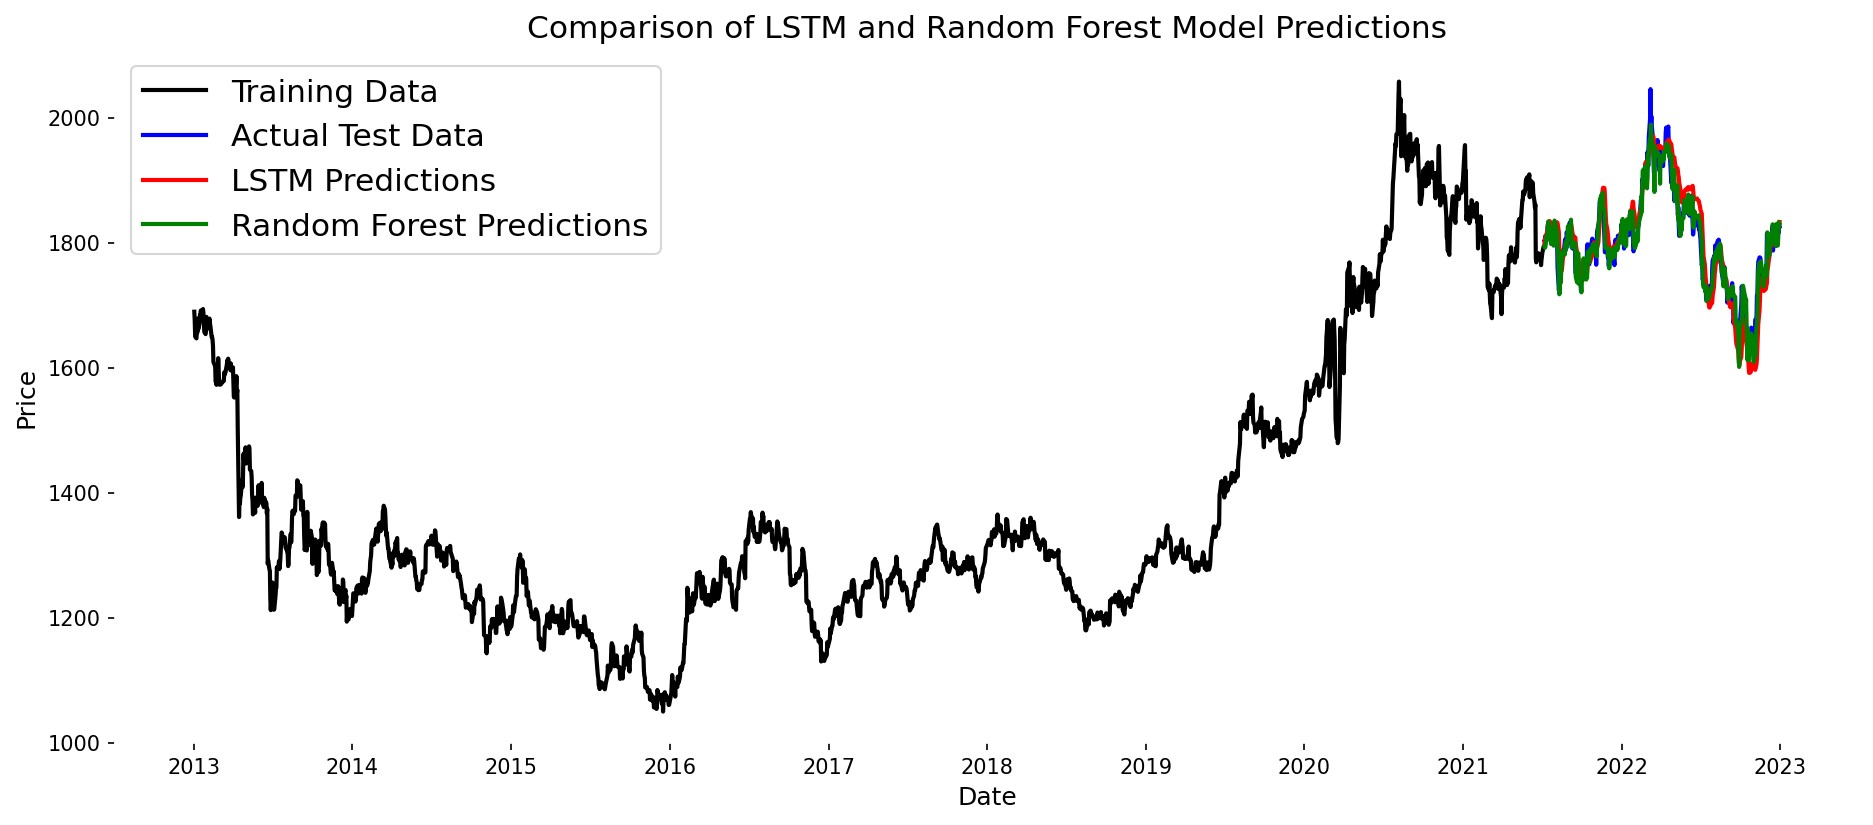
Figure 5: The prediction results of the LSTM and random forest model (Photo/Picture credit: Original).
The RF model is a superior predictor of the gold price in this study, due to a number of inherent advantages. The Random Forest model is particularly adept at handling complex data sets comprising multiple variables and non-linear relationships. This capability enables it to discern the intricate patterns in gold price movements with greater precision than LSTM models. While LSTM models are effective in capturing time dependence, they are more susceptible to overfitting, particularly when the data set is limited in size or lacks diversity. In contrast, random forests benefit from ensemble learning, which reduces the risk of overfitting by averaging multiple decision trees. In addition, the efficacy of LSTM models is significantly influenced by the specific values assigned to the hyperparameters. For instance, the learning rate, units per layer and number of layers are all factors that require consideration. Inappropriate adjustments to these parameters can result in suboptimal outcomes.
The comparison of the performance of LSTM models and Random Forest models in predicting the price of gold will provide investors in the gold market with a reliable decision-making instrument and improve the strength of the depth and breadth of the analysis. Ultimately, this comparative analysis will not only improve the effectiveness of machine learning predictive models, but also facilitate the development of more accurate risk management and investment strategies for better results and risk control in the gold market.
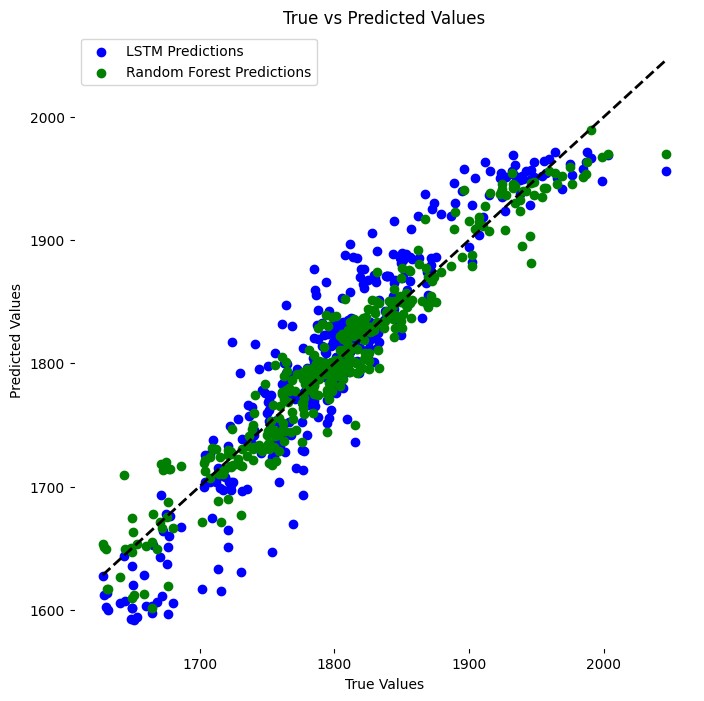
Figure 6: Prediction by LSTM and Random Forest Model (Picture credit: Original).
5. Conclusion
This study employs two machine learning techniques, namely the Random Forest and LSTM models, towards the objective of forecasting the price of gold over the next decade. The results indicate that the RF model demonstrates marginally greater predictive accuracy than the LSTM model, exhibiting a higher degree of precision (MAPE = 0.02), which suggests that RF has an advantage in dealing with complex datasets and capturing non-linear relationships. There are also limitations to this study. Firstly, the accuracy of the predictions may have been affected by the fact that different window sizes were not compared. Second, the study did not utilize more complex data, which limits the comprehensiveness and predictive ability of the model. These limitations highlight areas for future improvement.
Future work should focus on optimizing the LSTM model and identifying the reasons for its poor performance. This may involve tuning model parameters, using richer datasets, and investigating other factors that affect prediction. These efforts aim to improve the performance of LSTM in predicting gold prices. In conclusion, this study highlights this potential of RF models in gold price prediction and suggests directions for further optimization. The combination of different models and methods can enhance the precision and reliability of gold price forecasting and provide more reliable decision support for financial institutions, investors and related companies.
References
[1]. Vidal, A., & Kristjanpoller, W. (2020). Gold volatility prediction using a CNN-LSTM approach. Expert Systems with Applications, 157, 113481.
[2]. Pattnaik, D., Hassan, M. K., DSouza, A., & Ashraf, A. (2023). Investment in gold: A bibliometric review and agenda for future research. Research in International Business and Finance, 64, 101854.
[3]. Triki, M. B., & Maatoug, A. B. (2021). The GOLD market as a safe haven against the stock market uncertainty: Evidence from geopolitical risk. Resources Policy, 70, 101872.
[4]. Ghule, R., & Gadhave, A. (2022). Gold price prediction using machine learning. International Journal of Scientific Research in Engineering and Management.(IJSREM), 6(06).
[5]. Agarwal, A. K., & Kumari, S. (2020). Gold price prediction using machine learning. International Journal of Trend in Scientific Research and Development (IJTSRD), 4(5), 1448-1456.
[6]. Naveen, K., & Arumugam, S. S. (2023). A Novel Long Short Term Memory Algorithm Compared to Random Forest Algorithm for Improved Accuracy Values in Real-Time Stock Market Prediction. Journal of Survey in Fisheries Sciences, 10(1S), 2732-2740.
[7]. Basher, S. A., & Sadorsky, P. (2022). Forecasting Bitcoin price direction with random forests: How important are interest rates, inflation, and market volatility?. Machine Learning with Applications, 9, 100355.
[8]. Hansun, S., & Suryadibrata, A. (2021). Gold price prediction in COVID-19 era. International Journal of Computational Intelligence in Control, 13(2), 1-4.
[9]. Moghar, A., & Hamiche, M. (2020). Stock market prediction using LSTM recurrent neural network. Procedia computer science, 170, 1168-1173.
[10]. Yu, Y., Si, X., Hu, C., & Zhang, J. (2019). A review of recurrent neural networks: LSTM cells and network architectures. Neural computation, 31(7), 1235-1270.
[11]. Chen, Z., Li, C., & Sun, W. (2020). Bitcoin price prediction using machine learning: An approach to sample dimension engineering. Journal of Computational and Applied Mathematics, 365, 112395.
Cite this article
Pan,X. (2024). The Comparison Between Random Forest and LSTM Models Based on the Gold Price Prediction. Advances in Economics, Management and Political Sciences,94,102-108.
Data availability
The datasets used and/or analyzed during the current study will be available from the authors upon reasonable request.
Disclaimer/Publisher's Note
The statements, opinions and data contained in all publications are solely those of the individual author(s) and contributor(s) and not of EWA Publishing and/or the editor(s). EWA Publishing and/or the editor(s) disclaim responsibility for any injury to people or property resulting from any ideas, methods, instructions or products referred to in the content.
About volume
Volume title: Proceedings of ICFTBA 2024 Workshop: Finance in the Age of Environmental Risks and Sustainability
© 2024 by the author(s). Licensee EWA Publishing, Oxford, UK. This article is an open access article distributed under the terms and
conditions of the Creative Commons Attribution (CC BY) license. Authors who
publish this series agree to the following terms:
1. Authors retain copyright and grant the series right of first publication with the work simultaneously licensed under a Creative Commons
Attribution License that allows others to share the work with an acknowledgment of the work's authorship and initial publication in this
series.
2. Authors are able to enter into separate, additional contractual arrangements for the non-exclusive distribution of the series's published
version of the work (e.g., post it to an institutional repository or publish it in a book), with an acknowledgment of its initial
publication in this series.
3. Authors are permitted and encouraged to post their work online (e.g., in institutional repositories or on their website) prior to and
during the submission process, as it can lead to productive exchanges, as well as earlier and greater citation of published work (See
Open access policy for details).
References
[1]. Vidal, A., & Kristjanpoller, W. (2020). Gold volatility prediction using a CNN-LSTM approach. Expert Systems with Applications, 157, 113481.
[2]. Pattnaik, D., Hassan, M. K., DSouza, A., & Ashraf, A. (2023). Investment in gold: A bibliometric review and agenda for future research. Research in International Business and Finance, 64, 101854.
[3]. Triki, M. B., & Maatoug, A. B. (2021). The GOLD market as a safe haven against the stock market uncertainty: Evidence from geopolitical risk. Resources Policy, 70, 101872.
[4]. Ghule, R., & Gadhave, A. (2022). Gold price prediction using machine learning. International Journal of Scientific Research in Engineering and Management.(IJSREM), 6(06).
[5]. Agarwal, A. K., & Kumari, S. (2020). Gold price prediction using machine learning. International Journal of Trend in Scientific Research and Development (IJTSRD), 4(5), 1448-1456.
[6]. Naveen, K., & Arumugam, S. S. (2023). A Novel Long Short Term Memory Algorithm Compared to Random Forest Algorithm for Improved Accuracy Values in Real-Time Stock Market Prediction. Journal of Survey in Fisheries Sciences, 10(1S), 2732-2740.
[7]. Basher, S. A., & Sadorsky, P. (2022). Forecasting Bitcoin price direction with random forests: How important are interest rates, inflation, and market volatility?. Machine Learning with Applications, 9, 100355.
[8]. Hansun, S., & Suryadibrata, A. (2021). Gold price prediction in COVID-19 era. International Journal of Computational Intelligence in Control, 13(2), 1-4.
[9]. Moghar, A., & Hamiche, M. (2020). Stock market prediction using LSTM recurrent neural network. Procedia computer science, 170, 1168-1173.
[10]. Yu, Y., Si, X., Hu, C., & Zhang, J. (2019). A review of recurrent neural networks: LSTM cells and network architectures. Neural computation, 31(7), 1235-1270.
[11]. Chen, Z., Li, C., & Sun, W. (2020). Bitcoin price prediction using machine learning: An approach to sample dimension engineering. Journal of Computational and Applied Mathematics, 365, 112395.