


1. Introduction
The task of forecasting stock prices has captivated financial market participants for a considerable time, owing to their potential for high economic returns and their role in investment decision-making. Nevertheless, this task is highly challenging because of the volatile and non-linear nature of stock price movements, influenced by a variety of factors including market trends, economic indicators, and investor sentiment [1]. Traditional statistical models often struggle to accurately predict stock prices due to their inability to capture the complex temporal dependencies and patterns inherent in the data [2].
In recent years, the emergence of deep learning techniques has opened exciting avenues for forecasting stock prices. One of these approaches is the Long Short-Term Memory (LSTM) networks, which is a form of recurrent neural network (RNN), have gained attention due to their proficiency in learning long-term dependencies within sequential data. Unlike conventional RNNs, which suffer from the vanishing gradient problem, LSTM networks, with their use of memory cells and gating mechanisms, are able to retain and process information over prolonged periods [3]. This feature makes LSTMs particularly especially effective for analyzing time-series data. In the realm of stock price prediction, LSTM models can be trained on historical price data to effectively capture complex temporal dependencies and patterns, thereby enabling accurate future price predictions by learning from underlying market trends and volatility [4].
This study examines the application of LSTM networks for predicting stock prices of Tesla Inc., BYD, Panasonic, and NVIDIA—four prominent companies within the electric vehicle and related technology sectors. Predicting stock prices in this industry is crucial due to the rapid growth and economic impact of the electric vehicle market, which is driven by technological advancements, regulatory policies, and shifting consumer preferences towards sustainable transportation solutions [5]. Tesla, as a leading electric vehicle manufacturer, provides a benchmark for comparison. BYD, another major player in the electric vehicle market, along with Panasonic, a key supplier of batteries for electric vehicles, and NVIDIA, a company specializing in GPU technology and AI, offer a diverse set of companies to analyze. These companies represent different segments of the electric vehicle industry value chain, from vehicle manufacturing (Tesla and BYD) to critical component supply (Panasonic) and enabling technologies (NVIDIA), thereby providing a comprehensive view of the market dynamics.
This study develops LSTM models for each of these companies to evaluate and compare their predictive performance. The main objective of this research is to showcase the efficacy of LSTM networks in stock prices predictions as well as to emphasize the enhancements achieved through model optimization. By comparing the prediction results of the LSTM models across different companies, this research aims to offer insights into the practical use of LSTM networks in financial forecasting as well as to offer meaningful guidance for investment strategies and future research. This work seeks to highlighting the capacity of LSTM networks to produce accurate and reliable forecasts within the dynamic and intricate context of financial markets.
2. Methodology
The methodology of this study involves developing and evaluating two LSTM models for predicting Tesla’s stock prices: a baseline model and an optimized model. The process is outlined as follows:
2.1. How LSTM Works
The core components of the LSTM network include the Memory Cell, and Gating mechanisms. These components function collaboratively to process and maintain data dependencies over long time steps.
The Memory Cell is the central component of the LSTM, which is designed to store while transfer information over extended periods. It manages the flow of information using a Gating mechanism.
The Forget Gate is the first Gating mechanism that determines which information should be removed from the Memory Cell. It produces a value between 0 and 1 using a Sigmoid function, based on the prior output and the current input. A value closer to 1 indicates the information is more significant, while a value closer to 0 indicates that the information should be discarded.
\( {f_{t}}=σ({W_{f}}\cdot [{h_{t-1}},{x_{t}}]+{b_{f}}) \) | (1) |
Among equation (1), \( {f_{t}} \) is the result of the Forget Gate, while other elements such as \( {W_{f}} \) is the weight matrix, \( {h_{t-1}} \) is the previous hidden state, \( {x_{t}} \) is the current input, and \( {b_{f}} \) is the bias.
The Input Gate is the second Gating mechanism that determines which new information should be added to the Memory Cell. This Gate is composed of two layers: a Sigmoid layer that decides which information to update and a Tanh layer that generates candidate values to be incorporated into the Memory Cell.
\( {i_{t}}=σ({W_{i}}\cdot [{h_{t-1}},{x_{t}}]+{b_{i}}) \) | (2) |
\( \widetilde{{C_{t}}}=tanh({W_{C}}\cdot [{h_{t-1}},{x_{t}}]+{b_{C}}) \) | (3) |
Among equations (2) and (3), the element \( {i_{t}} \) represents the result of the Input Gate, and the element \( \widetilde{{C_{t}}} \) denotes the candidate cell state.
The Output Gate is the last Gating mechanism that controls which information is released from the memory cell. It first selects the portion of the result through a Sigmoid layer, then processes the cell state with a Tanh layer.
\( {o_{t}}=σ({W_{o}}\cdot [{h_{t-1}},{x_{t}}]+{b_{o}}) \) | (4) |
\( {h_{t}}={o_{t}}*tanh({C_{t}}) \) | (5) |
Among equations (4) and (5), the element \( {o_{t}} \) represents the output of the Output Gate, and the element \( {h_{t}} \) denotes the current hidden state.
The LSTM cell works as follows:
First, compute the output of the \( {f_{t}} \) (Forget Gate).
Second, compute the output of the \( {i_{t}} \) (Input Gate) and the \( \widetilde{{C_{t}}} \) (candidate cell state ), and then update the \( {C_{t}} \) (cell state ) by integrating information from the \( {f_{t}} \) (Forget Gate) and the \( {i_{t}} \) (Input Gate):
\( {C_{t}} = {f_{t}}\cdot {C_{t-1}}+ {i_{t}}\cdot \widetilde{{C_{t}}} \) | (6) |
Third, Compute the result of the \( {o_{t}} \) (Output Gate ).
Fourth, Update the hidden state: \( {h_{t}}={o_{t}}*tanh({C_{t}}) \)
These gating mechanisms enable LSTM to maintain long-term dependencies effectively, which makes it highly suitable for time series prediction.
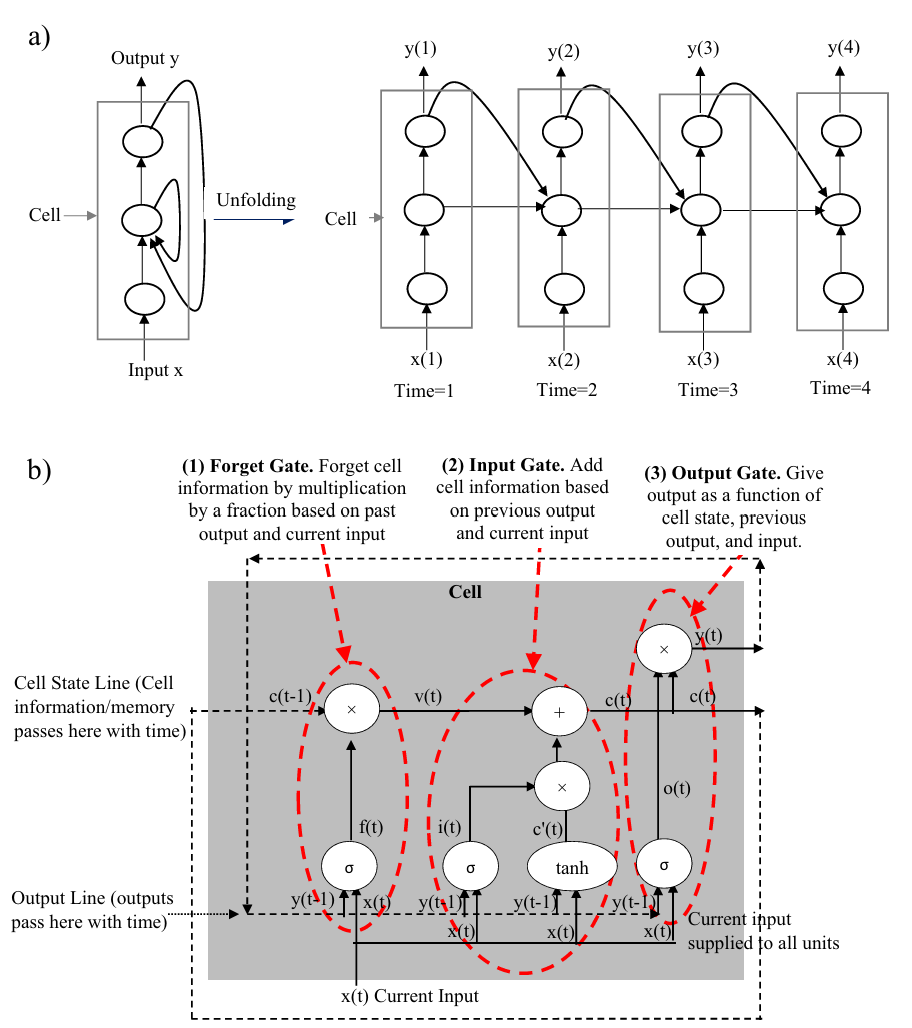
Figure 1: The basic structure and workflow of the LSTM [6].
Figure 1 shows the structure and working principle of LSTM. (a) Shows the unfolded structure of an LSTM unit; (b) Shows the specific operations within an LSTM unit, including the three Gates.
2.2. Data Preprocessing and Model Building
The first step in building the LSTM model involves preparing the data. The four datasets used in this study consist of daily historical stock price data for Tesla Inc., BYD, Panasonic, and NVIDIA, covering the period from January 1, 2012, to April 1, 2024. These datasets were sourced from Yahoo! Finance, ensuring a consistent data structure across all datasets. The relevant steps include selecting the necessary columns, normalizing the data, and then dividing the data by training and testing sets.
Firstly, the data is normalized to a range of 0 to 1 using the MinMaxScaler method. This method transforms the data by first subtracting the minimum value of each feature, followed by dividing by the span (the difference between the maximum and minimum values). This scaling step is essential to ensure the data is appropriate for training the LSTM models, which are highly sensitive to the scale of the input values.
Next, the scaled data is divided is into 80% for training and 20% for testing. Sequences of 60-time steps are created for training the LSTM model.
The baseline LSTM model includes two LSTM layers with 50 units each, and two dense layers. The first layer contains 25 units, the output layer has 1 unit. This basic architecture serves as a foundation for assessing the model's performance.
To improve upon the baseline model, the optimized LSTM model increases the complexity of the architecture. Specifically, the optimized The LSTM model comprises two LSTM layers with 120 and 60 units, respectively, and two dense layers with 25 and 1 unit, respectively. This increased complexity is designed to capture more intricate patterns in the data. Additionally, to mitigate overfitting caused by the enhanced model complexity, Incorporation of regularization techniques, such as dropout layers, was implemented. The model was trained on the training dataset with an 80-20 split for validation, employing early stopping to monitor the validation loss and terminate training when no further improvement was observed. This enhanced architecture helps in capturing the underlying patterns in the stock price data more effectively, ultimately improving predictive accuracy.
Finally, for both models, the testing dataset is created using sequences of 60-time steps from the remaining 20% of the data.
2.3. Model Predictions and Evaluation
The predictions from both the baseline and optimized LSTM models are converted back to their original scale using the inverse transform of the scaler. This step ensures that the predicted stock prices can be directly compared to the actual stock prices. To evaluate the models' performance, this study calculates the Root Mean Squared Error (RMSE) for both models. RMSE is a widely used metric that measures the average magnitude of prediction errors, where lower values indicate higher predictive accuracy.
In addition to RMSE, this study calculates the model performance by computing the Mean Squared Error (MSE) and Mean Absolute Error (MAE). These metrics offer a detailed assessment of prediction accuracy. Furthermore, the coefficient of determination (R²) is calculated to quantify the extent to which the variance in the dependent variable is explained by the independent variables.
By combining the description of both the baseline and optimized models, this study provides a comprehensive methodology for developing and evaluating LSTM models for stock price prediction. The baseline model serves as a foundational model, while the optimized model incorporates advanced techniques to improve predictive performance. Through comparative analysis, this study highlights the impact of model complexity and optimization on predictive accuracy, demonstrating how tuning and refining the model architecture can lead to significant improvements in stock price predictions. This approach underscores the importance of model optimization in achieving reliable and accurate forecasts in financial markets.
3. Results and analysis
The performance metrics for both baseline and optimized LSTM models across four companies—Tesla, BYD, Panasonic, and NVIDIA—are summarized in Table 1. The metrics include RMSE, MSE, MAE, and the R².
Table 1: comparison between baseline and optimized LSTM models’ performance.
Company | RMSE (Baseline) | RMSE (Optimized) | MSE (B) | MSE (O) | MAE (B) | MAE (O) | R² (B) | R² (O) |
Tesla | 21.31 | 23.17 | 454.15 | 536.82 | 15.99 | 18.25 | 0.88 | 0.86 |
BYD | 10.54 | 8.75 | 111.06 | 76.62 | 8.28 | 6.47 | 0.92 | 0.95 |
Panasonic | 902.23 | 31.79 | 814014.54 | 1010.67 | 881.12 | 22.86 | -17.93 | 0.98 |
NVIDIA | 2.99 | 2.78 | 8.94 | 7.73 | 1.95 | 2.13 | 0.97 | 0.98 |
The results demonstrate the effectiveness of the LSTM models in predicting stock prices across different companies within the electric vehicle and related technology sectors. For the baseline model, the RMSE values are 21.31 for Tesla, 10.54 for BYD, 902.23 for Panasonic, and 2.99 for NVIDIA. These values indicate the average prediction errors, with higher values representing greater prediction errors. Similarly, MSE values show that the prediction errors for Panasonic are significantly higher compared to the other companies. The MAE values follow a similar trend, with Panasonic showing the highest error. The R² values indicate that the baseline model explains a high proportion of variance for Tesla, BYD, and NVIDIA, but not for Panasonic.
The optimized model shows significant improvements in prediction accuracy for BYD and Panasonic. The RMSE and MAE values for BYD decrease from 10.54 to 8.75 and from 8.28 to 6.47, respectively. For Panasonic, the RMSE drops dramatically from 902.23 to 31.79, and the MAE decreases from 881.12 to 22.86. These improvements indicate that the optimized model is more effective at capturing the intricate patterns in the stock price data for these companies. The R² values for BYD and Panasonic also show an increase, reflecting an improved alignment of the model with the data.
However, for Tesla and NVIDIA, the optimized model does not show significant improvements. The RMSE for Tesla slightly increases from 21.31 to 23.17, and the MAE increases from 15.99 to 18.25. For NVIDIA, the RMSE and MAE values remain relatively low, with the optimized model performing marginally better. These results suggest that the baseline model is already performing well for Tesla and NVIDIA, and further optimization does not lead to substantial improvements.
Figures 2 to 5 demonstrate the optimized model's ability to capture the trends in the stock prices of Tesla, BYD, Panasonic, and NVIDIA. The close correspondence between the predicted and actual values for most stocks indicates a high degree of precision in the models' predictions. However, some deviations, particularly noticeable in the predictions for Panasonic and NVIDIA during 2023, indicate areas where further model refinement could be beneficial. These deviations are evident from the periods where the predicted values diverge from the actual stock prices, highlighting the need for improved model tuning or additional feature incorporation to enhance prediction accuracy further.
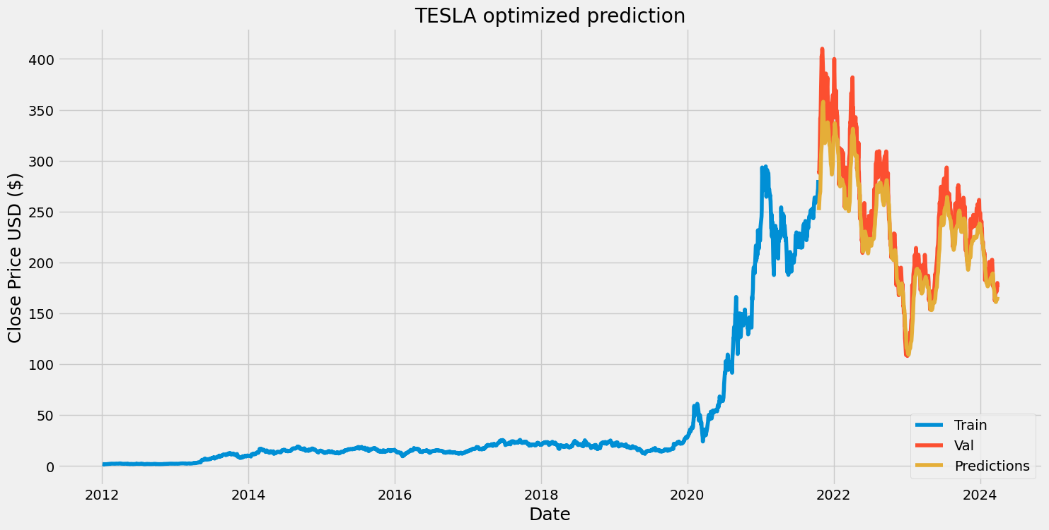
Figure 2: Predicted vs Actual stock prices for Tesla using the optimized LSTM model.
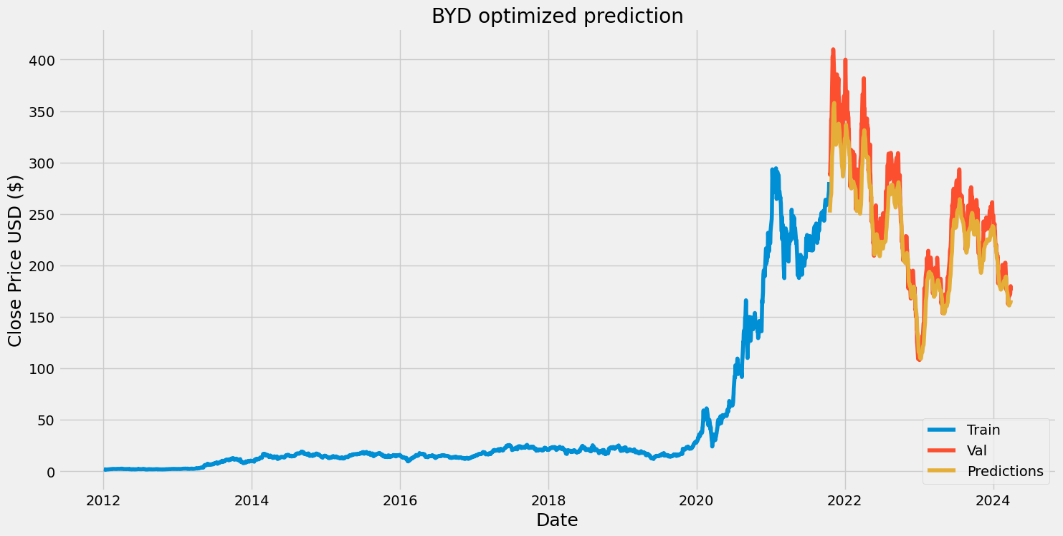
Figure 3: Predicted vs Actual stock prices for BYD using the optimized LSTM model.
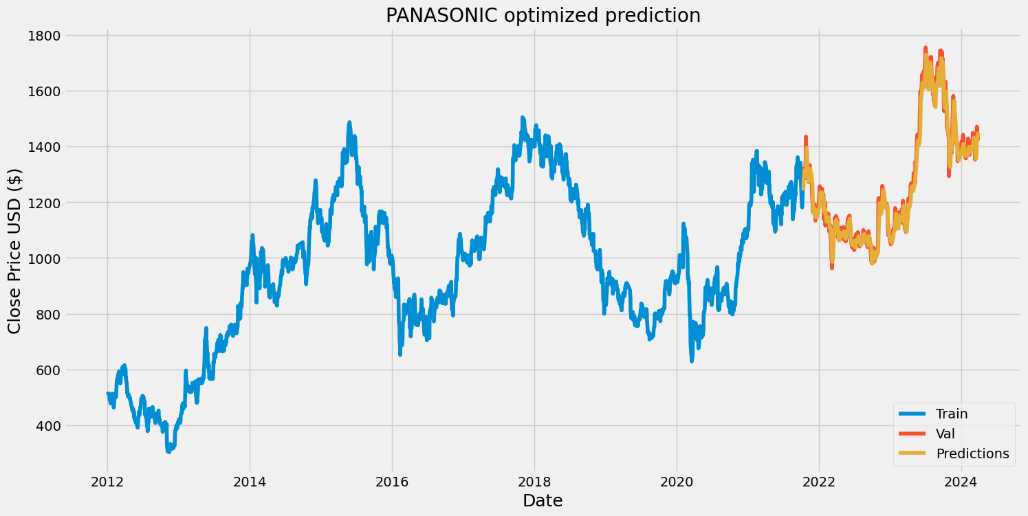
Figure 4: Predicted vs Actual stock prices for Panasonic using the optimized LSTM model.
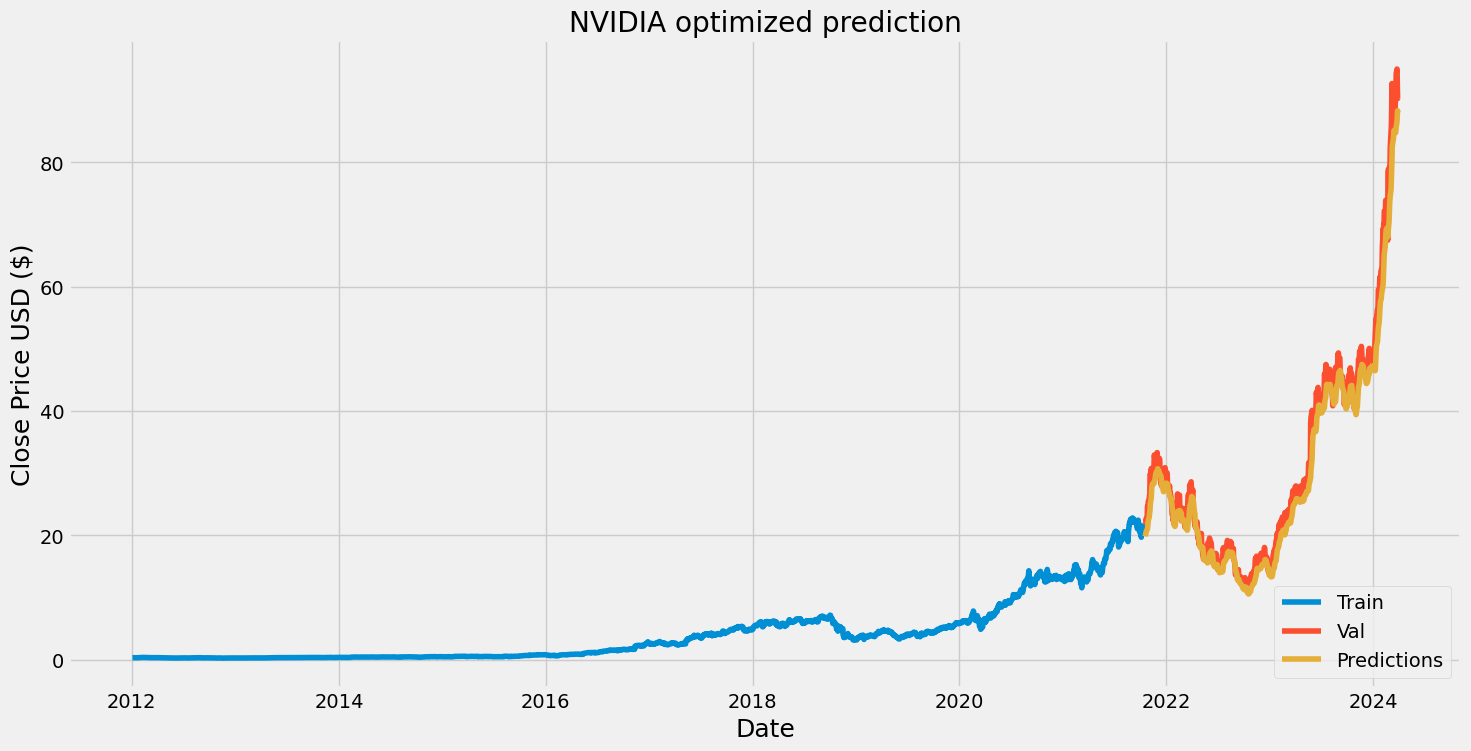
Figure 5: Predicted vs Actual stock prices for NVIDIA using the optimized LSTM model.
Overall, the LSTM models, particularly when optimized, demonstrate strong potential in predicting stock prices for companies within the electric vehicle and related sectors. The optimized model shows marked improvements for BYD and Panasonic, highlighting the importance of model tuning and optimization in achieving accurate predictions. These findings offer valuable insights for investors and analysts looking to leverage deep learning models for financial forecasting.
4. Discussion
The results from both the baseline and optimized LSTM models Emphasize the substantial potential of advanced neural network methods in predicting stock prices within the electric vehicle and related technology sectors. The baseline model provided a solid foundation with reasonable predictive accuracy for Tesla, BYD, and NVIDIA. However, it struggled significantly with Panasonic's stock price prediction, indicating that a more complex model might be necessary to capture the intricacies of Panasonic's stock price movements.
The optimized model, incorporating advanced techniques and increased complexity, showed substantial improvements in prediction accuracy for BYD and Panasonic. This highlights the importance of model tuning and optimization. The decrease in RMSE and MAE for these companies suggests that the optimized model more effectively captures the underlying patterns in their stock price data. The enhancement in R² values further confirms this, indicating that the optimized model accounts for more variance in the data than the baseline model.
For Tesla and NVIDIA, the baseline model was already performing well, and further optimization did not lead to significant improvements. This suggests that the initial model complexity was sufficient for these stocks, and additional tuning provided diminishing returns. This observation underscores the need for tailored model complexity based on the specific characteristics of each stock.
4.1. Further Optimization and Future Research
Future research can pursue several strategies to further enhance LSTM models for stock price prediction. One method is to incorporate additional features, such as macroeconomic indicators, trading volumes, and sentiment analysis from news and social media. Including these elements could offer A broader understanding of market dynamics and improve predictive accuracy. Additionally, Future research could explore advanced models that merge LSTM with other machine learning algorithms, like using convolutional neural networks (CNNs) for extracting features [7]. Ensemble methods, which combine the predictions of multiple models, might also boost performance by reducing prediction variance.
4.2. Practical Implications of Predictive Results
The predictive results of LSTM models have significant practical implications for investors and analysts in the electric vehicle and related technology sectors. Accurate stock price predictions can inform investment decisions, helping investors to identify potential opportunities and risks [8]. For instance, improved prediction accuracy for BYD and Panasonic can provide valuable insights for stakeholders interested in these companies' growth prospects within the electric vehicle supply chain. Moreover, financial institutions can leverage these models to develop trading strategies, optimize portfolio allocations, and manage risks more effectively. By anticipating market movements, businesses can also make informed decisions about strategic investments and resource allocations.
4.3. Challenges in Predicting Panasonic's Stock Prices
The challenge in predicting Panasonic's stock prices could stem from several factors. One possibility is the unique characteristics of the Japanese stock market, which may exhibit different patterns and behaviors compared to other markets. Japanese stock market behavior can be influenced by a distinct set of macroeconomic variables and investor sentiment, which might not be as prevalent in other global markets. This includes specific economic policies, corporate governance practices, and cultural factors that influence trading behaviors and stock performance uniquely [9]. Additionally, Panasonic's diverse business portfolio, spanning various industries such as electronics, automotive, and energy solutions, might introduce additional complexity that is difficult for the model to capture. Each segment of Panasonic's business could be affected by different market dynamics and external factors, making it challenging for a single model to accurately predict its overall stock performance [10].Another consideration is the model itself; the LSTM architecture, while powerful, might benefit from further tuning or the incorporation of more relevant features to better account for Panasonic's specific market dynamics.
In summary, the LSTM models, particularly when optimized, demonstrate strong potential in predicting stock prices for companies within the electric vehicle and related sectors. The optimized model shows marked improvements for BYD and Panasonic, highlighting the importance of model tuning and optimization in achieving accurate predictions. These findings provide significant insights for investors and analysts aiming to utilize deep learning models for financial forecasting. Future research should focus on integrating additional features and exploring hybrid models to further enhance predictive performance and applicability across diverse market conditions.
5. Conclusion
This study applies LSTM networks to predict the stock prices of Tesla, BYD, Panasonic, and NVIDIA. By creating both baseline and optimized models, this study illustrates the capability of LSTM networks in modeling intricate temporal relationships within stock price data. The optimized model, with its advanced features and increased complexity, significantly improves prediction accuracy for BYD and Panasonic, while the baseline model proves sufficient for Tesla and NVIDIA. These findings suggest that while LSTM networks are powerful tools for stock price prediction, the degree of model complexity and optimization required can vary significantly between different stocks.
Furthermore, the study highlights the importance of model tuning and optimization in achieving accurate predictions, particularly for stocks with more complex patterns like Panasonic. This study provides valuable insights for investors and analysts looking to employ deep learning models for financial forecasting. Accurate stock price predictions can inform investment decisions, optimize trading strategies, and manage risks more effectively.
Future research could delve deeper into integrating additional features like macroeconomic indicators, trading volumes, and sentiment analysis from news and social media to boost predictive performance. Furthermore, investigating composite models that integrate LSTM with alternative machine learning approaches, such as employing convolutional neural networks (CNNs) for feature extraction or ensemble methods, could enhance robustness and reliability across various market conditions. By addressing these areas, future studies can ensure more comprehensive and reliable stock price predictions, providing even greater value to financial markets and stakeholders.
References
[1]. Botunac I, Bosna J, Matetić M. (2024) Optimization of Traditional Stock Market Strategies Using the LSTM Hybrid Approach. Information. 15(3):136.
[2]. Ding, G., Qin, L. (2020) Study on the prediction of stock price based on the associated network model of LSTM. International Journal of Machine Learning and Cybernetics. 11, 1307–1317.
[3]. Yang, P., Li, S., Qin, S., Wang, L., Hu, M., & Yang, F. (2024) Smart grid enterprise decision-making and economic benefit analysis based on LSTM-GAN and edge computing algorithm. Alexandria Engineering Journal, 104, 314-327.
[4]. Lakshminarayanan, S. K., & McCrae, J. P. (2019) A Comparative Study of SVM and LSTM Deep Learning Algorithms for Stock Market Prediction. In AICS, 446-457.
[5]. Kapustin, Nikita O., & Dmitry A. Grushevenko. (2020) Long-term electric vehicles outlook and their potential impact on electric grid. Energy Policy, 137: 111103.
[6]. Kala, R. (2023) An introduction to machine learning and Deep Learning. Autonomous Mobile Robots. Retrieved from: https://www.sciencedirect.com/science/article/pii/B9780443189081000224
[7]. Fischer, T., & Krauss, C. (2018) Deep learning with long short-term memory networks for financial market predictions. European Journal of Operational Research, 270(2), 654-669.
[8]. Ahire, P., Lad, H., Parekh, S., & Kabrawala, S. (2021) LSTM based stock price prediction. International Journal of Creative Research Thoughts, 9(2), 5118-5122.
[9]. Mohammed, W. A. (2020). Challenges of Stock Prediction. In Valuation Challenges and Solutions in Contemporary Businesses. IGI Global, 234-252.
[10]. Fischer, T., & Krauss, C. (2018). Deep learning with long short-term memory networks for financial market predictions. European journal of operational research, 270(2), 654-669.
Cite this article
Wu,S. (2024). Predicting Stock Prices in the Electric Vehicle and Technology Sectors Using Long Short-Term Memory Models. Advances in Economics, Management and Political Sciences,94,148-156.
Data availability
The datasets used and/or analyzed during the current study will be available from the authors upon reasonable request.
Disclaimer/Publisher's Note
The statements, opinions and data contained in all publications are solely those of the individual author(s) and contributor(s) and not of EWA Publishing and/or the editor(s). EWA Publishing and/or the editor(s) disclaim responsibility for any injury to people or property resulting from any ideas, methods, instructions or products referred to in the content.
About volume
Volume title: Proceedings of ICFTBA 2024 Workshop: Finance in the Age of Environmental Risks and Sustainability
© 2024 by the author(s). Licensee EWA Publishing, Oxford, UK. This article is an open access article distributed under the terms and
conditions of the Creative Commons Attribution (CC BY) license. Authors who
publish this series agree to the following terms:
1. Authors retain copyright and grant the series right of first publication with the work simultaneously licensed under a Creative Commons
Attribution License that allows others to share the work with an acknowledgment of the work's authorship and initial publication in this
series.
2. Authors are able to enter into separate, additional contractual arrangements for the non-exclusive distribution of the series's published
version of the work (e.g., post it to an institutional repository or publish it in a book), with an acknowledgment of its initial
publication in this series.
3. Authors are permitted and encouraged to post their work online (e.g., in institutional repositories or on their website) prior to and
during the submission process, as it can lead to productive exchanges, as well as earlier and greater citation of published work (See
Open access policy for details).
References
[1]. Botunac I, Bosna J, Matetić M. (2024) Optimization of Traditional Stock Market Strategies Using the LSTM Hybrid Approach. Information. 15(3):136.
[2]. Ding, G., Qin, L. (2020) Study on the prediction of stock price based on the associated network model of LSTM. International Journal of Machine Learning and Cybernetics. 11, 1307–1317.
[3]. Yang, P., Li, S., Qin, S., Wang, L., Hu, M., & Yang, F. (2024) Smart grid enterprise decision-making and economic benefit analysis based on LSTM-GAN and edge computing algorithm. Alexandria Engineering Journal, 104, 314-327.
[4]. Lakshminarayanan, S. K., & McCrae, J. P. (2019) A Comparative Study of SVM and LSTM Deep Learning Algorithms for Stock Market Prediction. In AICS, 446-457.
[5]. Kapustin, Nikita O., & Dmitry A. Grushevenko. (2020) Long-term electric vehicles outlook and their potential impact on electric grid. Energy Policy, 137: 111103.
[6]. Kala, R. (2023) An introduction to machine learning and Deep Learning. Autonomous Mobile Robots. Retrieved from: https://www.sciencedirect.com/science/article/pii/B9780443189081000224
[7]. Fischer, T., & Krauss, C. (2018) Deep learning with long short-term memory networks for financial market predictions. European Journal of Operational Research, 270(2), 654-669.
[8]. Ahire, P., Lad, H., Parekh, S., & Kabrawala, S. (2021) LSTM based stock price prediction. International Journal of Creative Research Thoughts, 9(2), 5118-5122.
[9]. Mohammed, W. A. (2020). Challenges of Stock Prediction. In Valuation Challenges and Solutions in Contemporary Businesses. IGI Global, 234-252.
[10]. Fischer, T., & Krauss, C. (2018). Deep learning with long short-term memory networks for financial market predictions. European journal of operational research, 270(2), 654-669.