


1.Introduction
Since huge profits can be obtained from buying and selling stocks, many people invest in the stock market in hopes of maximizing their profits. As far as China is concerned, as of the end of 2020, the number of stock investors in China has exceeded the 150 million mark and reached a new height of 178 million, of which natural person investors account for 99.77%. It showed that stock trading is an important part of national production and operations [1]. Although society's attitude towards the stock market is that investment is risky and unsuitable for trading, many investors believe that risks come with benefits [2, 3]. When stock prices fluctuate greatly, risks of the stock increasing, investors can generate huge returns between the initial price and the final price [4]. However, when the stock price is relatively stable, the risk of stock return is low, but it is unable to produce expected return in the short term, only long-term holding producing benefits [4]. As a result, more and more investors pay more attention to stock prediction and expect to predict stock price trends through modeling analysis and mathematical analysis to maximize their stock returns. To cater to the needs of investors, financial analysts use some forecasting algorithms to predict stock trends and give investors some advice.
Today, there are many ways to improve the accuracy of the stock price trends prediction. There two most-used models. One of them is artificial neural network (ANN), another is ARIMA models. As the research deepens, researchers have found that the LSTM has great accuracy for stock price prediction. Kimoto and Asakawa predicted buying and selling timing on the Tokyo Stock Exchange by using MNN. As a result, their experimental results were impressive [5]. Yoon and Swales proposed four-layer neural network (NN) to predict the stock prices of US, and the result showed that this method was better than MDA [6]. Takahashi et al. proposed a NN containing multi-line segment regression technology to predict stock prices. The tangent and length of the multi-line segment regression were specified as the output of the NN. Finally, the results showed that this method has excellent effects on stock price prediction [7]. Kim and Chun used an array probabilistic network with a multi-valued output model, which outperformed case-based reasoning models, recurrent NN methods, and traditional backpropagation NNs in terms of prediction results [8]. Kamijo and Tanikawa found a new way to predict stock prices on the Tokyo Stock Exchange It was the pattern recognition technique, which proposed to evaluate recurrent networks to reduce mismatching patterns [9]. After understanding various models, this article aims to predict the price trends of the stocks of four technology companies in the technology industry by the ARIMA model in time series, testing the accuracy of the model's stock price predictions under today's economic situation.
Since time series analysis is not limited by the assumptions of any basic model or related equations and the prediction results of ARIMA are based on the input variables and error terms, so it is very effective in analysis and prediction [10]. As a linear regression model, the ARIMA deviate if it is used to deal with nonlinear problems. But in short-term forecasting, the prediction of the ARIMA model is more accurate than that of the nonlinear model [11]. In terms of data selection, the predictions of stock prices are based on that the stock prices are the latest, so this article selects the latest stock data of these five technology companies in the past five years to make data analysis.
Then, this article uses the ARIMA model to predict and analyze stock data of five companies. This data results show that the future trend of the stocks of the four leading technology companies (AMAZON, APPLE, GOOGLE, and META) continues to rise, but OpenAI, a popular artificial intelligence company that has emerged in recent years, has seen a downward trend in its stock trend. After that, this article analyzes and interprets the results of the model through finance, company size, news hotspots, etc., and then makes suggestions for investors' future investment plans based on the conclusions, so that they can better plan their funds.
At the end, the article shows the structure of this article. In the 2th Section, this article will discuss the concepts and applications of the ARIMA model. In the 3th Section, the article may provide the details about the dataset on which this article makes predictions. In the 4th section, the article will discuss and show the experimental procedures and experimental results of this article in detail. In the 5th Section, this article will illustrate the conclusions, and then it will adjust and optimize the model based on the results. In the 6thSection, it will summarize the research and the result.
2.Method
2.1.Data Source
In the stock market, financial professionals hope to plan future funding arrangements through stock forecasts, while ordinary investors also hope to gain benefits through stock market forecasts. Therefore, this paper aims to predict the stocks of five technology companies (Amazon, Apple, Google, Meta, OpenAI) based on the ARIMA model, investigating these trends of the model's prediction for stocks.
The data used in the article comes from MAANG companies Stock prices (updated daily) compiled by a data expert named Nikhil on the Kaggle data website and Yahoo Finance. This dataset, covering the complete data of MAANG companies’ stock prices since their initial public offerings (IPOs) (from 1997 to the day of processing data), contains several kinds of stock prices of five companies and is automatically updated with the latest data from Yahoo Finance every day to ensure the data is up to date.
2.2.Indicator Selection and Explanation
This article selects five well-known and representative companies in the technology industry as experimental objects to ensure the integrity and significance of the experimental data. What’s more, the article considers that the stock as a short-term financial product, the price fluctuations and trends of stocks are easily affected by the times. To be specific, as the times develop, more data used for stock prediction does not mean that stock predictions will have more accurate results.
To solve this problem, the article performs data preprocessing on the collected data sets. Firstly, the article observes that the data time span is too large and has too much historical data. Since the article was written in 2024, on the premise of ensuring that the amount of data is sufficient (more than 1,000 data lines for each company), the article selects the daily stock data of each company for the past five years (from 2020 to 2024). Moreover, the dataset observes several factors, details are as follows (Take Amazon as an example):
Table 1: Factors of Dataset of AMAZON.
Factors | Parameter | Min | Max |
Year | T | \ | \ |
Opening Price | X1 | 82.076 | 189.160 |
Highest Price | X2 | 83.480 | 191.700 |
Lowest Price | X3 | 81.301 | 187.440 |
Closing Price | X4 | 81.820 | 189.500 |
Adjusted Closing Price | X5 | 81.820 | 189.500 |
In the prediction of stock price trends, the adjusted closing price of the stock on that day is often used as experimental data, so the article simplifies the dataset. To show the general trend of the data, this article makes four time series charts of the year(T) and the adjusted closing prices of the five companies (X5). The detailed data trend chart is shown in the below (Since the number of OpenAI data is inconsistent, so, it is not shown):
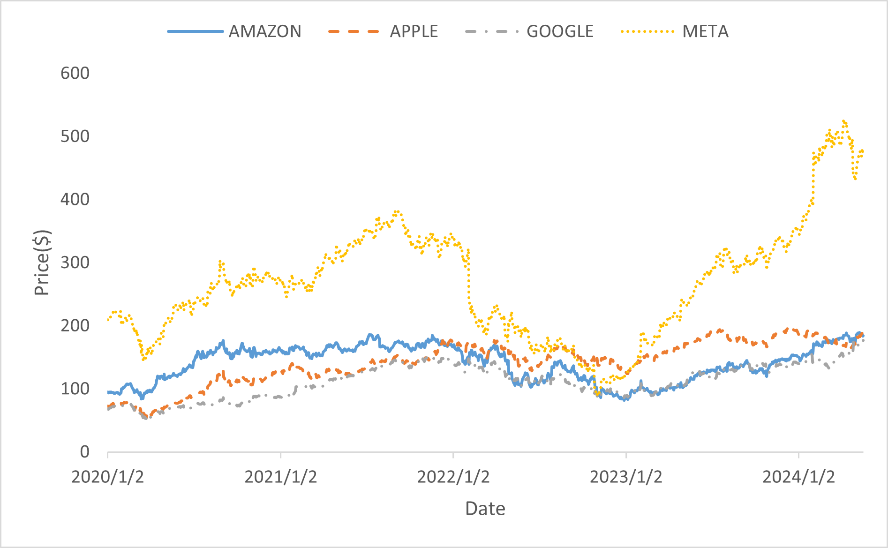
Figure 1: Stock Trends.
What the picture shows is that the stocks of the four technology companies have experienced a fluctuation rise and generally the stock prices have risen. It shows that when comparing the stocks of the five companies vertically, META's stock price far exceeds that of other companies, and GOOGLE's stock price has been the lowest for a long time. From a horizontal perspective, in 2022, the stock prices of the five companies were hit and showed a downward trend. Among them, META's stock price fell sharply, and the stock prices of the other three companies showed a slow downtrend.
2.3.Introduction of the method
In time series analysis, commonly used models include autoregressive model (AR), moving average model (MA), autoregressive moving average model (ARMA) and ARIMA. In the article, the method used to predict stock trends is the ARIMA model, proposed by Box and Jenkins in 1976. This model can predict the changes in time series, which is abbreviated as ARIMA (p, d, q) model:
\begin{cases}Φ(Β){∇^{d}}{x_{t}}=(1-{θ_{1}}Β-⋯-{θ_{q}}{B^{q}}){ε_{t}} \\ E({ε_{t}})=0,Var({ε_{t}})=σ_{ε}^{2},E({ε_{t}}{ε_{s}})=0,s≠t \\ E({ε_{s}}{ε_{t}})=0,∀s \lt t\end{cases} (1)
What’s more, {∇^{d}}={(1-B)^{d}} and Φ(Β){∇^{d}}{x_{t}}=(1-{θ_{1}}Β-⋯-{θ_{q}}{B^{q}}){ε_{t}} are autoregressive coefficient polynomial of stationary reversible ARMA (p, q) Model. The essence of the ARIMA model is a combination of difference operation and ARMA model, which shows that any non-stationary sequence can achieve stationarity through appropriate d order difference, then ARMA fitting can be performed on this differenced sequence. Before predicting data by using this model, the datasets are necessary to conduct a stationarity test and a white noise test through a unit root test, to ensure that the datasets have stationarity and are non-white noise series. Then, the ARIMA model should be identified by checking the ACF graph and PACF graph. Finally, the models which best fit to the datasets are determined and are used to predict future stock trends.
3.Result and Discussion
3.1.Stationary test
This article uses the ARIMA model to conduct data experimental analysis on the stock data of five companies. Since the ARIMA model prediction needs to ensure that the prediction sequence is stable, this paper conducts a stationary test on the adjusted closing prices of the five companies in the data set, and the results are as follows:
Table 2: ADF Inspection Table.
Company | Difference Order | t | P | AIC | Critical Value | ||
1% | 5% | 10% | |||||
AMAZON | 0 | -1.818 | 0.371 | 5498.366 | -3.436 | -2.864 | -2.568 |
1 | -33.918 | 0.000*** | 5496.761 | -3.436 | -2.864 | -2.568 | |
APPLE | 0 | -1.709 | 0.427 | 5145.302 | -3.436 | -2.864 | -2.568 |
1 | -34.092 | 0.000*** | 5143.529 | -3.436 | -2.864 | -2.568 | |
0 | -0.69 | 0.849 | 4819.334 | -3.436 | -2.864 | -2.568 | |
1 | -35.214 | 0.000*** | 4814.279 | -3.436 | -2.864 | -2.568 | |
META | 0 | -0.357 | 0.917 | 7379.366 | -3.436 | -2.864 | -2.568 |
1 | -34.892 | 0.000*** | 7371.657 | -3.436 | -2.864 | -2.568 | |
OpenAI | 0 | -8.114 | 0.000*** | -729.035 | -3.5 | -2.892 | -2.583 |
1 | -9.022 | 0.000*** | -716.808 | -3.5 | -2.892 | -2.583 | |
Note: ***, **, and * represent the significance levels of 1%, 5%, and 10% respectively.
By interpreting the ADF test table, this article finds that the sequences of the five companies all showed non-stationarity without differential testing, that is, the hypothesis that the series is not stationary can not be significantly rejected ( P \gt 0.05 ). In order to make the sequence stable, this article performes first-order and second-order difference processing on the four sets of sequences. After processing, the sequences all have stability( P \lt 0.05 ). Then, the most appropriate difference order is selected based on the AIC. Since the smaller the AIC value, the better the degree of fitting. This article observes that the sequences of the five companies all have the smallest AIC at the first-order difference. Then d=1 in the ARIMA model of this forecast. Therefore, the best differential sequence diagrams of the five companies are as follows (Take Amazon as an example):
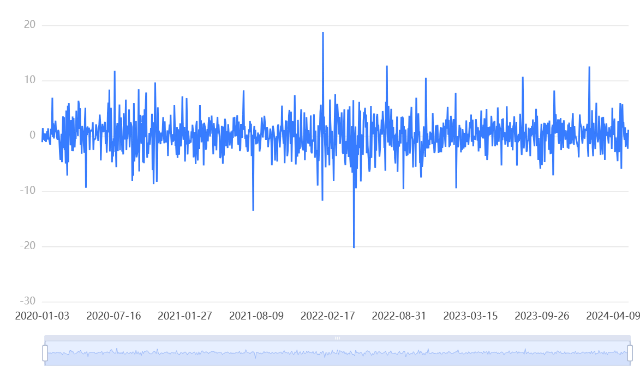
Figure 2: AMAZON.
3.2.Model determination
After confirming the order of difference and the stationarity of the series, this article conducts partial (autocorrelation analysis) on the time series to estimate the values of p and q of the ARIMA model, and estimates the parameters according to truncation of the series. The details of the four technology companies are as follows (Take Amazon as an example):
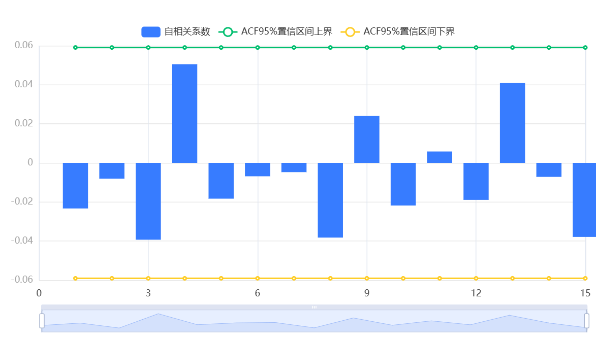
Figure 3: ACF of AMAZON.
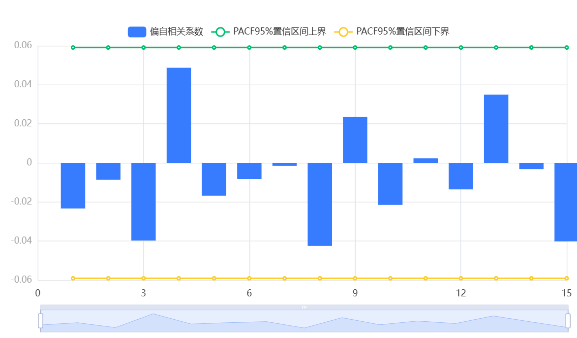
Figure 4: PACF of AMAZON.
According to the analysis of the autocorrelation diagram and partial autocorrelation diagram of the time series, this article selects multiple ARIMA models (ten or more) for each country to process the data set. After selecting the candidate models, this article fits the models and compares the values of BIC and AIC to select the most suitable prediction model for each company. The table is as follow:
Table 3: ARIMA model test table.
Company | ARIMA (p, d, q) | AIC | BIC |
AMAZON | 1,1,1 | 5453.874 | 5473.779 |
0,1,1 | 5453.054 | 5467.983 | |
1,1,0 | 5453.055 | 5467.984 | |
APPLE | 0,1,1 | 5236.889 | 5246.897 |
1,1,0 | 5238.002 | 5253.014 | |
1,1,1 | 5239.295 | 5259.311 | |
0,1,1 | 4900.109 | 4915.121 | |
1,1,1 | 4901.863 | 4921.879 | |
1,1,0 | 4900.121 | 4915.133 | |
META | 0,1,1 | 7514.910 | 7529.922 |
1,1,1 | 7515.292 | 7535.308 | |
1,1,0 | 7515.097 | 7530.109 | |
OpenAI | 1,1,1 | -3907.928 | -3907.893 |
0,1,1 | -3908.629 | -3895.587 | |
1,1,0 | -3908.473 | -3895.436 |
By observing the test table of the ARIMA model, the article compared the AIC and BIC of each model of each company and found that the most suitable model for each company is ARIMA (0,1,1).
3.3.Forecast the application
This article has found the best models for stock prediction of five companies. Next, this article will use these models to predict the trend of closing stock prices of various companies. The results are shown in the following figure (blue line is the true value, green line is the fitted value and yellow line is the predicted value):
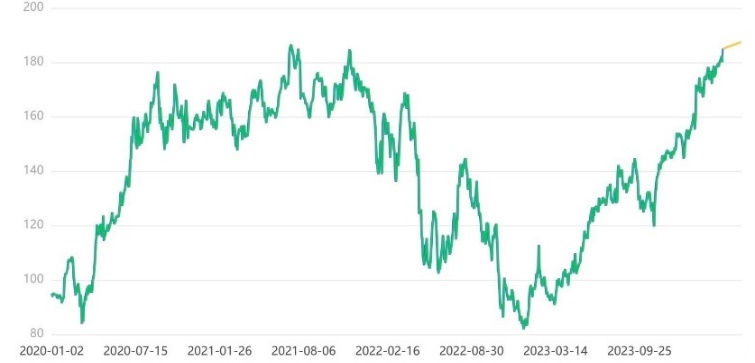
Figure 5: AMAZON.
The stock trends of AMAZON, APPLE, GOOGLE and META are shown using AMAZON as an example. The data fit of the four companies is very high and the stocks of the four companies are all on an upward trend, which means that the stock prices of these four companies will rise steadily in the next month. However, when analyzing the data, this article found that the stock market trend of OpenAI was the opposite, and the stock prediction was declining, so this article shows the result as follows:
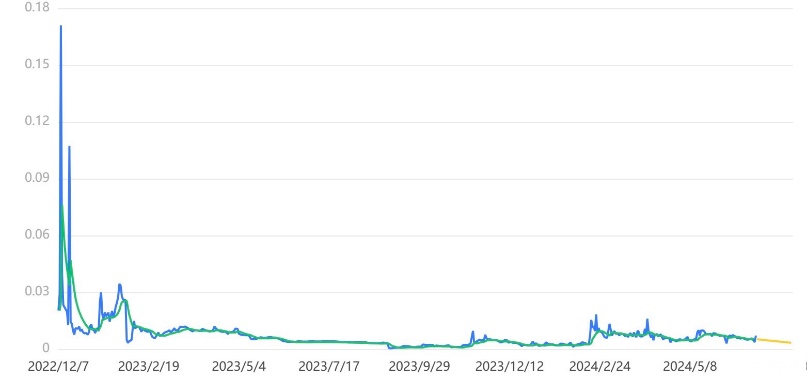
Figure 6: OpenAI.
Based on the experimental results, this paper concludes that the ARIMA model accurately predicts the trend of the adjusted closing prices of the stocks of these five technology companies in the next month, so that the purchase and sale of the stocks of these technology companies can be planned in reference to finance. Among them, the stock trends of the four large technology companies represented by AMAZON have shown a steady upward trend. This paper believes that these four companies have a relatively stable economic strength with years of economic accumulation and business expansion. Although the four companies are also affected by major global events, which has caused a trend of large fluctuations in stock prices, the overall development prospects are bright and can lead the development of the technology industry. Therefore, this paper recommends that conservative investors can invest in the four companies. However, OpenAI, as a new technology company that has emerged in recent years, its main business is artificial intelligence (for example: ChatGPT). This product has attracted the attention of the world and aroused heated discussions in society. For a time, the company's stock price has grown rapidly. But later the product encountered various problems: first, ChatGPT was used for academic fraud and other academic misconduct, which was opposed and boycotted by the academic community; second, the company was supervised by the US and UK anti-AI monopoly laws, and some of its businesses were affected; and OpenAI made a series of decisions such as dismissing the CEO and abandoning the Chinese mainland market, which made investors wait and see, causing the stock trend to decline all the way. So, in the future development of the company, this article recommends that investors need to maintain a long-term wait-and-see attitude towards the company. For investors who already hold the company's stocks, this article does not recommend long-term holding of the company's stocks and always observing market trends. For investors who intend to buy, they can always pay attention to financial information and choose the right price to buy at the right time. Overall, the ARIMA model used in this article has a clear prediction of the stock trend of technology companies.
The results of this study show that the ARIMA model is a suitable stock market analysis and forecasting tool. The model is used to predict the trend of the adjusted closing prices of major technology companies with reasonable accuracy. This finding is consistent with previous studies, and this article highlights the effectiveness of the ARIMA model in predicting trends in time series data such as stock prices. However, this study has several shortcomings that should be improved in the future. First, the dataset has a small number of objects, which may limit its ability to be applied to different time periods or fields. In addition, the model was evaluated only using AIC and BIC, and further analysis using other indicators would provide a more comprehensive evaluation of the model performance. What’s more, the stock market is affected by a variety of external factors, including economic policies, social opinions, and technological development. Incorporating these factors into the model may improve its prediction accuracy. Future research could combine the ARIMA model with machine learning techniques such as LSTM.
4.Conclusion
The research topic of this paper is to predict the stock trend of technology companies based on the ARIMA model. The data used in this paper is from MAANG companies Stock prices (updated daily) compiled by a data expert named Nikhil on the Kaggle website and Yahoo Finance. The historical data contains the stock closing prices of five companies every day from 2009 to 2024. This paper reads relevant literature and finds that the basic model used for stock prediction is the ARIMA model. Therefore, this paper selects historical data from 2020 to 2024 in the database for data preprocessing and differential processing, and finally compares the true value with the predicted value to observe the prediction accuracy. This paper predicts the stocks of companies in the technology field through relevant ARIMA models, obtains better prediction results, and finds that four of the stocks show an upward trend, the stock of OpenAI show a downward trend. However, the ARIMA model only predicts the general trend of technology company stocks, and then financial analysts analyze investment recommendations based on the trend and relevant knowledge. This article hopes that in the following experiments, the ARIMA model can be combined with related models in machine learning to achieve more accurate predictions of technology company stocks, to make more detailed investment recommendations.
References
[1]. Xin Wang, Qianqian Shi, Ruyi Chen, Guoqing Chen. "Research on stock forecasting based on LSTM-ARIMA model" [J]. Frontiers of Social Sciences, 2022, 11(7): 2843-2856.
[2]. Meher, Bharat Kumar, et al. "Forecasting stock market prices using mixed ARIMA model: A case study of Indian pharmaceutical companies." Investment Management and Financial Innovations 18.1 (2021): 42-54.
[3]. Ma, Qihang. "Comparison of ARIMA, ANN and LSTM for stock price prediction." E3S Web of Conferences. Vol. 218. EDP Sciences, 2020.
[4]. WAHYUDI, SETYO TRI. "The ARIMA Model for the Indonesia Stock Price." International Journal of Economics & Management 11 (2017).
[5]. Kimoto, Takashi, et al. "Stock market prediction system with modular neural networks." 1990 IJCNN international joint conference on neural networks. IEEE, 1990.
[6]. Yoon, Youngohc, and George Swales. "Predicting stock price performance: A neural network approach." Proceedings of the twenty-fourth annual Hawaii international conference on system sciences. Vol. 4. IEEE, 1991.
[7]. Takahashi, Shuntaro, Yu Chen, and Kumiko Tanaka-Ishii. "Modeling financial time-series with generative adversarial networks." Physica A: Statistical Mechanics and its Applications 527 (2019): 121261.
[8]. Kim, Steven H., and Se Hak Chun. "Graded forecasting using an array of bipolar predictions: application of probabilistic neural networks to a stock market index." International Journal of Forecasting 14.3 (1998): 323-337.
[9]. Kamijo, Ken-ichi, and Tetsuji Tanigawa. "Stock price pattern recognition-a recurrent neural network approach." 1990 IJCNN international joint conference on neural networks. IEEE, 1990.
[10]. Tabachnick, Barbara G., Linda S. Fidell, and Jodie B. Ullman. Using multivariate statistics. Vol. 6. Boston, MA: pearson, 2013.
[11]. Meyler, Aidan, Geoff Kenny, and Terry Quinn. "Forecasting Irish inflation using ARIMA models." (1998): 1-48.
Cite this article
Xu,J. (2024). Technology Company Stock Trend Prediction Based on ARIMA Model. Advances in Economics, Management and Political Sciences,94,240-247.
Data availability
The datasets used and/or analyzed during the current study will be available from the authors upon reasonable request.
Disclaimer/Publisher's Note
The statements, opinions and data contained in all publications are solely those of the individual author(s) and contributor(s) and not of EWA Publishing and/or the editor(s). EWA Publishing and/or the editor(s) disclaim responsibility for any injury to people or property resulting from any ideas, methods, instructions or products referred to in the content.
About volume
Volume title: Proceedings of ICFTBA 2024 Workshop: Finance in the Age of Environmental Risks and Sustainability
© 2024 by the author(s). Licensee EWA Publishing, Oxford, UK. This article is an open access article distributed under the terms and
conditions of the Creative Commons Attribution (CC BY) license. Authors who
publish this series agree to the following terms:
1. Authors retain copyright and grant the series right of first publication with the work simultaneously licensed under a Creative Commons
Attribution License that allows others to share the work with an acknowledgment of the work's authorship and initial publication in this
series.
2. Authors are able to enter into separate, additional contractual arrangements for the non-exclusive distribution of the series's published
version of the work (e.g., post it to an institutional repository or publish it in a book), with an acknowledgment of its initial
publication in this series.
3. Authors are permitted and encouraged to post their work online (e.g., in institutional repositories or on their website) prior to and
during the submission process, as it can lead to productive exchanges, as well as earlier and greater citation of published work (See
Open access policy for details).
References
[1]. Xin Wang, Qianqian Shi, Ruyi Chen, Guoqing Chen. "Research on stock forecasting based on LSTM-ARIMA model" [J]. Frontiers of Social Sciences, 2022, 11(7): 2843-2856.
[2]. Meher, Bharat Kumar, et al. "Forecasting stock market prices using mixed ARIMA model: A case study of Indian pharmaceutical companies." Investment Management and Financial Innovations 18.1 (2021): 42-54.
[3]. Ma, Qihang. "Comparison of ARIMA, ANN and LSTM for stock price prediction." E3S Web of Conferences. Vol. 218. EDP Sciences, 2020.
[4]. WAHYUDI, SETYO TRI. "The ARIMA Model for the Indonesia Stock Price." International Journal of Economics & Management 11 (2017).
[5]. Kimoto, Takashi, et al. "Stock market prediction system with modular neural networks." 1990 IJCNN international joint conference on neural networks. IEEE, 1990.
[6]. Yoon, Youngohc, and George Swales. "Predicting stock price performance: A neural network approach." Proceedings of the twenty-fourth annual Hawaii international conference on system sciences. Vol. 4. IEEE, 1991.
[7]. Takahashi, Shuntaro, Yu Chen, and Kumiko Tanaka-Ishii. "Modeling financial time-series with generative adversarial networks." Physica A: Statistical Mechanics and its Applications 527 (2019): 121261.
[8]. Kim, Steven H., and Se Hak Chun. "Graded forecasting using an array of bipolar predictions: application of probabilistic neural networks to a stock market index." International Journal of Forecasting 14.3 (1998): 323-337.
[9]. Kamijo, Ken-ichi, and Tetsuji Tanigawa. "Stock price pattern recognition-a recurrent neural network approach." 1990 IJCNN international joint conference on neural networks. IEEE, 1990.
[10]. Tabachnick, Barbara G., Linda S. Fidell, and Jodie B. Ullman. Using multivariate statistics. Vol. 6. Boston, MA: pearson, 2013.
[11]. Meyler, Aidan, Geoff Kenny, and Terry Quinn. "Forecasting Irish inflation using ARIMA models." (1998): 1-48.