


1. Introduction
The pharmaceutical industry was early in the 19th century. The US pharmaceutical industry originated in the early 19th century, when pharmaceutical production was mainly carried out by individual pharmacists in small-scale laboratories. The first pharmaceutical company, Merck, was established in the United States in 1823. Patented drugs also began to appear. In the early 20th century, with the development of the Industrial Revolution, the production of drugs became industrialized and standardized. The pharmaceutical industry began to achieve large-scale production. Some drugs had fixed preparation tables and proportions. At the same time, people began to realize that drug research and development was dangerous and expensive. In 1906, the Federal Food and Drug Act was passed and the FDA was established. The US began to institutionalize the regulation of drug safety and effectiveness [1].
In the mid-20th century, the US pharmaceutical industry had biotechnology development. For example, the development of antibiotics during World War II. From the late 1970s to the 1980s, advances in biotechnology gave rise to the development of genetic engineering and biopharmaceuticals. Large pharmaceutical companies such as Pfizer, Merck, and Johnson & Johnson began to expand globally. The current development status of the US pharmaceutical industry is relatively stable. Most pharmaceutical companies invest heavily in drug research and development. Many new drugs and innovative therapies such as gene therapy and immunotherapy originate from American companies such as Merck and Johnson & Johnson. American pharmaceutical companies have a rich R&D pipeline, including hundreds of drugs under development. In terms of regulations and supervision, the FDA is responsible for supervising the development, testing, approval and market supervision of drugs to ensure the safety and effectiveness of drugs. The patented drug (branded drug) and generic drug markets coexist, and drugs after patent expiration are usually replaced by generic drugs, thereby reducing drug prices. Every company is committed to developing patented drugs to gain market share. There is a clear trend of mergers and acquisitions and integration among large pharmaceutical companies, aiming to expand product lines, increase market share and enhance R&D capabilities. This market has good prospects because technologies such as artificial intelligence, big data and precision medicine are changing the R&D and production model of the pharmaceutical industry. In addition, emerging treatments such as cell therapy, gene therapy and RNA therapy have broad prospects and are expected to completely change the treatment of certain diseases [1].
Johnson & Johnson has made significant contributions in the healthcare sector, with two achievements standing out in particular. One of these achievements was the mass production of sterile sutures, which revolutionized surgical practices. This breakthrough played a key role in minimizing the risk of death by reducing the infection rate associated with surgery. From research to marketing, the biopharmaceutical corporation is in complete control of its operations. In addition to prescription medications, it also specializes in vaccinations, biologic therapies, and items for animal health. Nonetheless, the company's primary focus areas are diabetes and oncology; according to Statista, its top-selling medications in 2022 were Januvia, a type 2 diabetes treatment, and Keytruda, a cancer medication. Pfizer effectively addresses a wide range of medical conditions, including women's health concerns and cardiovascular disease. Pfizer is the first FDA-approved COVID-19 vaccine manufacturer, which reflects its innovation. In addition, the business has a long history of accomplishments, including being the first to produce vitamin C and penicillin on a significant scale, which have made significant contributions to advances in healthcare [2]. Bristol-Myers Squibb has made significant contributions to healthcare with its exceptional research capabilities and innovative drugs. Among its notable products are the blood thinners Eliquis and Plavix, as well as the psychiatric medication Abilify. Furthermore, the business created the immunotherapy Opdivo for combating certain forms of cancer [3].
As shown in Fig. 1, Merck, Johnson & Johnson, Bristol Myers Squibb each of them has 5% market share. Pfizer has 7% of the market share. The market is relatively competitive due to huge number of competitors [4]. The reference sources are articles from Google scholar, news, and online articles. There are four companies that are giants in the pharmaceutical industry, and all four of them are great investments. Merck is one of the world's largest pharmaceutical companies. Sales of the company's top cancer medication, Keytruda, increased by 20% during the first quarter, contributing to a 9% gain in revenue. Gardasil, Merck's vaccine against human papillomavirus, saw a 14% rise in sales as well. Strong Keytruda sales, according to analyst Geoff Meacham, helped Merck outperform analysts' forecasts for first-quarter results. Meacham anticipates Merck to maintain its current pace in 2024, when it will launch key products such as V116, HER3-DXd, and sotatercept. Additionally, Merck just disclosed a reorganization plan to improve its manufacturing network and increase efficiency [5]. The second company is Johnson & Johnson. It is a large pharmaceutical company. J&J offers a wide range of products, such as the immunology medications Tremfya and Stelara and the cancer medications Darzalex and Erleada. In 2023, Johnson & Johnson intends to split off its consumer health segment into an independent company. This will provide the corporation access to its two fastest-growing business segments, which are medical devices and pharmaceuticals. J&J has increased its yearly dividend for fifty nine consecutive years and is named the dividend king. However, with the spinoff of the company's consumer health business, investors don't have to worry about the dividend. J&J expects its dividend plus the expected dividend from the new entity to remain at least at the same level as before the deal is completed [6].
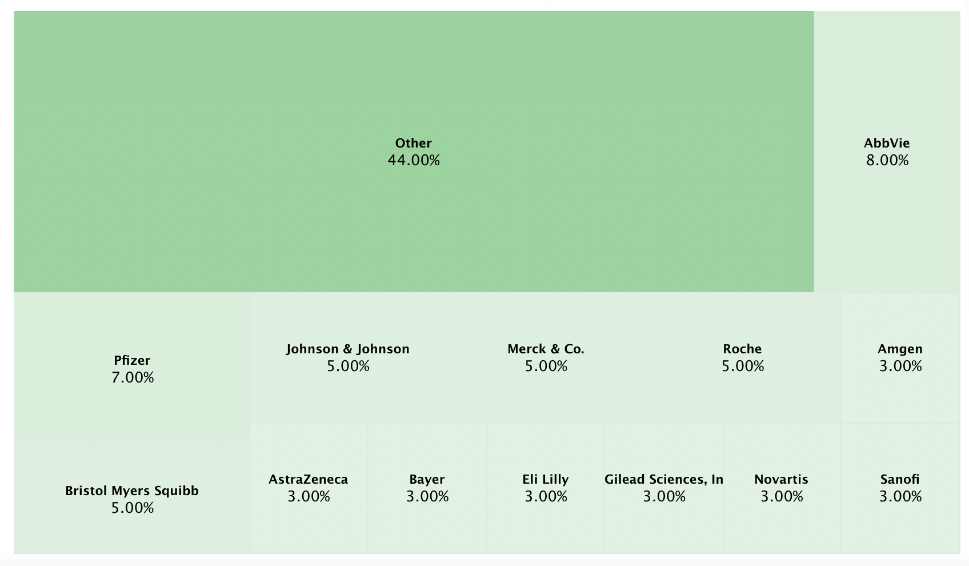
Figure 1: Market share each company has in pharmaceutical market in 2022.
Pfizer sells a variety of blockbuster products. These include the blood thinner Eliquis (marketed by Pfizer in partnership with Bristol-Myers Squibb), the cancer medications Ibrance and Xtandi, and the pneumococcal vaccination Prevnar. Most notably, Pfizer developed the first COVID-19 vaccine. Sales of Pfizer's COVID-19 pill Paxlovid have generated $4.1 billion in revenue for Pfizer. The drugmaker has more than 30 clinical programs in late-stage testing or awaiting regulatory approval. Particularly intriguing is the company's potential vaccination candidate against respiratory syncytial virus. For a long time, income-seeking investors have favored Pfizer. The business has distributed a quarterly dividend for over 83 years. The dividend of Pfizer has grown by 25% in the last five years [6]. Bristol-Myers Squibb (BMS) has acquired several companies to expand its product range. BMS is working on more than 50 clinical testing projects. In an effort to treat more cancer kinds, the business is investigating the use of Yervoy in conjunction with Opdivo as an immunotherapy. Also, the business is testing a number of new cancer immunotherapies. BMS has increased its yearly dividend for the past 13 years. The dividend payout has increased by almost 38% during the previous five years. Therefore, it's a wise investment [6].
Medicines, medical facilities, and medical technology are necessities for human beings because people will get sick. Some diseases are mild, while others are more serious. The development of the pharmaceutical industry is vital in society. In addition, human society has just experienced an epidemic, namely COVID-19. This further highlights the indispensability of the pharmaceutical industry in society and the huge attention it has attracted recently. The potential consumers facing the pharmaceutical industry are all human beings, so investing in pharmaceutical companies is based on prospects. Therefore, it is necessary to analyze the four giant companies in the pharmaceutical industry. This article will analyze which company is the worthiest of investment through various data and calculated ratios, evaluate return rates, profitability, growth rates, and other factors.
2. Data and Method
The data is collected from the website Estimize, an open financial estimates platform of listed stocks. The company Johnson & Johnson, Pfizer, and Bristol-Myers Squibb are chosen to be compared with Merck, because these companies are the leading company in the global range. The prosperity of these companies is positive and the size, sales, potential consumers are considerable. There is high competitiveness between them. These companies operate in the similar areas. They compete each other in the same industry. All of them have research and development in similar therapeutic areas. Examples include oncology, immunology, cardiovascular disease, and infectious diseases. These companies want to increase sales of medicine and thereby increase revenue by gaining a larger market share. These companies operate globally and compete for market share in different regions. They all want to become the global market leader and maintain their existing market positions. The data collected are from 2023 second quarter to 2024 first quarter, and with the forecasted data from 2024 second quarter to 2025 first quarter.
TTM and NTM EPS, TTM and NTM P/E ratio, EPS growth rate, Revenue growth rate, PEG ratio, and GP/A ratio of the companies are compared. TTM EPS represent the earnings per share of a company over the most recent 12 month. NTM EPS represent the forecasted earnings per share of a company for the upcoming 12 months. Both of the values measured company’s profitability. The higher the EPS ratio, the more profitable the company is. TTM P/E ratio is used to evaluate the current stock price relative to its profitability over the past twelve months. NTM P/E ratio is to used to evaluate for the upcoming twelve months in the future. It is used to determine whether the stock is overvalued or undervalued. It is calculated by \( Current stock price/TTM or NTM EPS \) . If the P/E ratio is significantly lower than the overall market, then the stock is undervalued which means the stock price is lower than the real value of the stock. If the P/E ratio is significantly higher than the overall market, then the stock is overvalued which means the stock price is relatively higher than its real value. Undervalued stock is more worthwhile to invest in. EPS growth rate measures the increase of a company’s profitability. The greater the EPS growth rate, the greater the increasing of the company, which is calculated as EPS growth rate \( =(NTM EPS-TTM EPS)/TTM EPS×100\% \) . Revenue growth rate measures the change of a company’s sales revenue over certain period. It is calculated by \( (Current Revenue-Forcast Revenue)/Current Revenue×100\% \) . PEG ratio is used to evaluate the Price to Earnings ratio by taking into account the growth of earnings [7], hwihc is calculated as \( PEG ratio=TTM P/E ratio/EPS growth rate \) . Gross profits to Assets ratio (GP/A) is used to measure a company’s efficiency in using its assets to generate profits. The higher the GP/A ratio, the more efficient the company can use its assets to generate profits [8], which can be obtained as \( GPA=Gross profit/Total Assets \) .
3. Results and Discussion
Seen from Table 1, MRK and JNJ are expensive stocks, by contrast, PFE and BMY are cheaper stocks. The trend of EPS is most steady in JNJ. It is very fluctuated in Merck, PFE, and BMY. JNJ has a high TTM and NTM EPS ratio, which means that it has better profitability. PFE has the lowest TTM and NTM EPS ratio, which means the profitability is not good, and PFE is not good to invest in when only looking at EPS ratio. MRK and BMY has a similar TTM and NTM EPS ratio, so the profitability is roughly similar. BMY has a very high TTM P/E ratio and a very low NTM P/E ratio of 6.22. This trend shows in the future, it is expected that investors will paying less for each dollars of earning in the future. MRK, JNJ, and PFE has similar NTM P/E ratio, so their competitiveness is not as great as BMY. JNJ has a negative revenue growth ratio, so its sales are decreasing and is not suggested to invest it.
As presented in Table 2, both MRK and BMY has a really high EPS growth rate, which is very attractive because the company is increasing its profitability. Merck has several large acquisition cooperation agreements in 2023 [9]. BMY has also acquired many companies in recent years [10]. This also leads to a small EPS base for both companies. BMY has the highest EPS growth rate of 550.5%, and then is the MRK which is 310.6%. However, in the past four quarter, both MRK and BMY has a fluctuating EPS ratio that include a negative EPS ratio in one of the quarters, so more analysis is required. PFE has the highest revenue growth ratio, which means the company is operating very well in gaining market share.
Table 1: Stock price, EPS ratio, and P/E ratio of four stocks.
Merck | J&J | Pfizer | BMY | |
Stock prices | 131.50 | 146.82 | 27.42 | 42.50 |
TTM EPS | 2.17 | 10.46 | 1.42 | 1.05 |
NTM EPS | 8.91 | 10.6 | 2.44 | 6.83 |
TTM P/E | 60.60 | 14.04 | 19.31 | 40.48 |
NTM P/E | 14.76 | 13.85 | 11.24 | 6.22 |
Table 2: EPS growth rate, Revenue growth rate, PEG ratio, and GP/A ratio of four stocks.
Merck | J&J | Pfizer | BMY | |
EPS Growth Rate | 310.6% | 1.3% | 71.8% | 550.5% |
Revenue Growth Rate | 5.70% | -0.6% | 12.6% | 1.0% |
PEG | 0.20 | 10.80 | 0.27 | 0.07 |
GP/A | 41.2% | 35.0% | 14.8% | 36.1% |
JNJ has the highest PEG ratio, so it is overvalued which is not suitable to invest in. For the rest of the company MRK, PFE, and BMY, all of them has a PEG ratio below 1 which means the stock is undervalued relative to growth. MRK and PFE has similar PEG ratio which is 0.2 and 0.27. While BMY has the lowest PEG ratio 0.07, which has more attraction. There is a huge difference between EPS Growth Rate and Revenue Growth Rate for both BMY and MRK. This is due to the increase in operation efficiency to reduce production cost and paying off debt to reduce interest expenses (according to the 10-k report of these two companies). Merck paid off the debt by selling bonds, and BMY paid off 3 billion debts in 2022. MRK has the highest GP/A ratio of 41.2%, which means it is very efficient in using its assets to generate gross profits and reasonable cost management. The trend of GP/A ratio for MRK is very good because it is keep increasing for three years ago. BMY is the stock has the second high GP/A ratio. It is also good at using assets to generate gross profits efficiently. However, the GP/A ratio increases from 2020 to 2022, but with a slight drop in 2023. JNJ has the third high GP/A ratio and with growth trend. PEF has the lowest GP/A, so it is utilizing the assets the least efficient. The Net margin of Merck and Pfizer of both annual and quarter is very unstable and fluctuated. The gross margin and net margin are decreasing for Merck. The gross margin and net margin are increasing for Pfizer. BMS has a stable gross margin for both annual and quarter but also with a sudden negative trend from 2022 to 2023. So according to these two data, Pfizer is more attractive. Overall, the suggested stock is common stock of Bristol-Myers Squibb due to its cheap stock price, low NTM P/E ratio, high EPS growth rate, and low PEG ratio. However, there is still some risk factors that may fail the investment. Here are the three mean risk factors. The Increasing pricing pressure and other restrictions in the U.S. and around the world are negatively impacting Bristol-Myers Squibb's revenue and margins. Increasing pressures are being imposed in the U.S., the European Union, and other parts of the world to gain access to pharmaceutical products and to impose pricing controls and other discounts. This has led to price cuts, lower reimbursement rates, and a smaller population of payers to reimburse. And market access restrictions, pricing controls and discounts, and other restrictions will become more severe in the future. So, the company's future revenue and margins may be negatively impacted [11].
Contributing to these are changes in laws and regulations related to medicine pricing and reimbursement (such as potential penalties/price controls for price increases that exceed the rate of inflation), and other changes related to federal healthcare programs. Then cost-cutting measures in federal healthcare programs and increased scrutiny of medicine manufacturers (including any additional scrutiny of BMS or Celgene by the House Oversight and Reform Committee) could also negatively impact margins [11].
The company has a significant amount of debt, which could have a negative impact. Bristol-Myers Squibb's acquisitions of Mirati, MyoKardia, and Celgene increased the company's debt amount, resulting in higher interest costs, and they plan to take on more debt to finance their next acquisitions, such as Karuna and RayzeBio. This can make it harder for the business to afford to make more capital expenditures, create new goods, and announce dividend payments in the future [11]. For instance, Standard & Poor's reduced BMS's long-term credit rating from A+ to A (Long-Term Credit Outlook Stable) after the company announced the recent acquisitions [11].
Regarding to Difficulties or delays in the development and commercialization of new products, BMS expects sales of its major branded products, such as Revlimid, Eliquis, Sprycel, Abraxane and Pomalyst, to decline upon loss of market exclusivity for such products. Therefore, the company's future success is highly dependent on its new product pipeline. The failure rate inherent in the process of developing new medicine is high [11]. Therefore, it is very likely that the funds invested by BMS in research projects will not generate a return. Developing new compounds and products involves inherent risks and uncertainties, including efficacy and safety issues, which may result in failure of the company's investment and may have a negative impact on BMS' image if it enters the market. There are also delays or rejections of regulatory approvals, including due to difficulties in recruiting patients and completing clinical trials in a timely manner. Delays or challenges in large-scale manufacturing of products or excessive costs of manufacturing products leading to revenue declines [11].
4. Conclusion
According to the comparison and analysis of the data, Bristol-Myers Squibb's stock is the most suitable to be purchased. Because it is a very cheap stock at present, but it has a very prosperous development. It is a very cost-effective thing to obtain stocks at a low price and then obtain high profits in the future. According to the calculated data, the profitability growth rate of this stock is very high, so it is a very attractive stock. Because it is very efficient in using total assets to produce gross revenue. The four companies studied this time only have a lot of market share and potential consumers in the current pharmaceutical market. There are still many potential stocks worth investing in that have not been analyzed in this article. There can be more comprehensive papers on pharmaceutical analysis in the future. These results provide professional advice and valuable analysis for stock buyers, and helps professionals in the exploration and research of the pharmaceutical market.
References
[1]. Richmond, L. and Stevenson, J. (2017) The pharmaceutical industry: a guide to historical records. Routledge.
[2]. Goodman, J. (2020) Pharmaceutical industry. In Medicine in the twentieth century (pp. 141-154). Taylor & Francis.
[3]. MRL Recruitment. (2023) Top 10 pharmaceutical companies in the US. Retrieved from: https://www.mrlcg.com/resources/blog/top-10-pharmaceutical-companies-in-the-us/.
[4]. Statista. (2023) Pharmaceuticals. Statista. Retrieved from: https://www.statista.com/outlook/hmo/pharmaceuticals/united-states#analyst-opinion.
[5]. Lazonick, W. and Tulum, Ö. (2024) Sick with “shareholder value”: US pharma’s financialized business model during the pandemic. Competition & Change, 28(2), 251-273.
[6]. Ilmiyono, A.F., Octavianty, E., Agustina, R.A. and Andriani, D.D. (2024) Effect of Macroeconomic and Profit Growth on the Stock Prices of Pharmaceutical Companies in Indonesia. The Accounting Journal of Binaniaga, 9(01), 65-74.
[7]. Charles, S. (2023). How to value company stocks: P/E, PEG, and P/B ratios. Retrieved from: https://www.schwab.com/learn/story/how-to-value-company-stocks-pe-peg-and-pb-ratios.
[8]. Bustos, O. and Pomares-Quimbaya, A. (2020) Stock market movement forecast: A systematic review. Expert Systems with Applications, 156, 113464..
[9]. Clemetson, J. (2023) Merck Closes Prometheus Acquisition: PHARMA: $10.8 B buyout'Largest Biotech Deal in San Diego'. San Diego Business Journal, 44(26), 2-4.
[10]. Howes, L. (2024) BMS closes 2023 with 2 big buys. C&EN Global Enterprise, 102(1), 8.
[11]. Bristol-Myers Squibb Company. (2024) Stock analysis: Bristol-Myers Squibb Company 10-K report. EDGAR, 14272, 44
Cite this article
Li,A. (2024). Analysis of Financial Performances for Merck&Co: Comparison with Johnson&Johnson, Pfizer, and Bristol-Myers Squibb. Advances in Economics, Management and Political Sciences,117,45-51.
Data availability
The datasets used and/or analyzed during the current study will be available from the authors upon reasonable request.
Disclaimer/Publisher's Note
The statements, opinions and data contained in all publications are solely those of the individual author(s) and contributor(s) and not of EWA Publishing and/or the editor(s). EWA Publishing and/or the editor(s) disclaim responsibility for any injury to people or property resulting from any ideas, methods, instructions or products referred to in the content.
About volume
Volume title: Proceedings of the 3rd International Conference on Financial Technology and Business Analysis
© 2024 by the author(s). Licensee EWA Publishing, Oxford, UK. This article is an open access article distributed under the terms and
conditions of the Creative Commons Attribution (CC BY) license. Authors who
publish this series agree to the following terms:
1. Authors retain copyright and grant the series right of first publication with the work simultaneously licensed under a Creative Commons
Attribution License that allows others to share the work with an acknowledgment of the work's authorship and initial publication in this
series.
2. Authors are able to enter into separate, additional contractual arrangements for the non-exclusive distribution of the series's published
version of the work (e.g., post it to an institutional repository or publish it in a book), with an acknowledgment of its initial
publication in this series.
3. Authors are permitted and encouraged to post their work online (e.g., in institutional repositories or on their website) prior to and
during the submission process, as it can lead to productive exchanges, as well as earlier and greater citation of published work (See
Open access policy for details).
References
[1]. Richmond, L. and Stevenson, J. (2017) The pharmaceutical industry: a guide to historical records. Routledge.
[2]. Goodman, J. (2020) Pharmaceutical industry. In Medicine in the twentieth century (pp. 141-154). Taylor & Francis.
[3]. MRL Recruitment. (2023) Top 10 pharmaceutical companies in the US. Retrieved from: https://www.mrlcg.com/resources/blog/top-10-pharmaceutical-companies-in-the-us/.
[4]. Statista. (2023) Pharmaceuticals. Statista. Retrieved from: https://www.statista.com/outlook/hmo/pharmaceuticals/united-states#analyst-opinion.
[5]. Lazonick, W. and Tulum, Ö. (2024) Sick with “shareholder value”: US pharma’s financialized business model during the pandemic. Competition & Change, 28(2), 251-273.
[6]. Ilmiyono, A.F., Octavianty, E., Agustina, R.A. and Andriani, D.D. (2024) Effect of Macroeconomic and Profit Growth on the Stock Prices of Pharmaceutical Companies in Indonesia. The Accounting Journal of Binaniaga, 9(01), 65-74.
[7]. Charles, S. (2023). How to value company stocks: P/E, PEG, and P/B ratios. Retrieved from: https://www.schwab.com/learn/story/how-to-value-company-stocks-pe-peg-and-pb-ratios.
[8]. Bustos, O. and Pomares-Quimbaya, A. (2020) Stock market movement forecast: A systematic review. Expert Systems with Applications, 156, 113464..
[9]. Clemetson, J. (2023) Merck Closes Prometheus Acquisition: PHARMA: $10.8 B buyout'Largest Biotech Deal in San Diego'. San Diego Business Journal, 44(26), 2-4.
[10]. Howes, L. (2024) BMS closes 2023 with 2 big buys. C&EN Global Enterprise, 102(1), 8.
[11]. Bristol-Myers Squibb Company. (2024) Stock analysis: Bristol-Myers Squibb Company 10-K report. EDGAR, 14272, 44