


1. Introduction
The United States became one of the largest economic entities in the world in 1894, and has kept its front-runner status since then. Also, it is currently the only superpower in the world. As a result, the changing trend of the US economy is critical to the global economy as a whole. As a result, it’s really important to study the dollar economy. To do deeper research, based on the belief that the earning of a company is significantly affected by the currency value where it is located, this paper selected two indexes, which are the S&P500 and the USD index. The S&P500, which is a benchmark index of 500 large-cap U.S. stocks, can reflect the U.S. economic performance well. The USD index, which shows the exchange rate of U.S., can reflect the changes in the status of the U.S. in international exports indirectly. As a result, the S&P 500 and the USD index can be used to study the overall relationship between the U.S. economy and other economies. Besides, the quick growth in the global trade and capital flows has leaded to the results that monetary value became one of the most important determinants of corporation’s ability to make revenue and stock prices, contributing to considerable interests in the association of exchange rates with stocks prices[1].
Based on the assumption that the corporate earnings will be significantly affected by the fluctuation of currency value, many scholars have conducted analysis in different ways and obtained various conclusions about the negative or positive relationship between the S&P500 and the USD index. Furthermore, a lot of papers got the theories of goods market approaches and portfolio balance approaches. However, due to the lack of specific consideration of the special policy or economic environment of the studied country, the defects of these conclusions and theories have been expanded to be more and more obvious with the further expansion of globalization [2]. For that, this paper will focus on the United States’ economy situation and explain the correlation between the S&P 500 and the USD index with realistic situation like financial crisis in 2008 and the urgently cut interest rate controlled by the Federal Reserve System in the face of the economic crisis caused by the epidemic in 2020.
The following paragraphs of this paper are organized as follows: In Section 2, the literature review is presented. In Section 3, our empirical test is described, including sample selection, data source and analyze. In Section 4, the conclusion of this paper is drawn.
2. Literature Review
Nowadays, there are lots of different research that focus on the correlation between different change of exchange rates and stocks prices. However, the conclusions of these studies are different. For example, Aggarwal suggests that there is a positive relationship between the U.S. exchange rate and the U.S. stock value [3]. In contrast, Soenen and Hennigar concluded an opposite conclusion [4]. Most of the literature focus on finding links between exchange rates and stocks prices directly. BSH (Balassa-Samuelson) analyzes the impact of economic growth rate on exchange rate, which presents the conclusion that there is a positive relationship between these two [5]. Wu L. and Fu G. used nonlinear model to do research and find that the revaluation of the exchange rate can encourage the rising interest of some short-term cross-border investment that aim to get immediate profit, which furthermore cause the rise of the stock price [6]. Overall, most of the literature agrees that the economic growth rates and stock price has a significant mutual impact.
There are also some literatures do research from other perspective. For instance, Mao and Kao study the different shares of imports and exports in the domestic economic market separately [7]. Nieh and Lee studied separately from long-term and short-term and concluded that there, between the stock price and the exchange rate, is only a short-term relationship, but lacks long-term relationship [8]. Among the research on the degree of mutual impact, Yang and Doong concluded the asymmetric mutual influence between these two through the EGARCH model by finding that the volatility spillover of the stocks market to the currency is more obvious [9]. Except the growth relationship between these two, there are also studies on exchange rate fluctuation. Wilhborg concluded that risk-averse investors will reduce their investment when the exchange rate fluctuation is large, which may further lead to the decreasing of the stock price [10].
3. Empirical test of the correlation between the USD index and the S&P500
USD index is an index that used to reflect the overall performance of the U.S. dollar’s exchange rate in the international exchange market, which is used to present the degree changed of the exchange rate of the U.S. dollar against a basket of currencies. The S&P500, which represents the performance of the 500 largest companies in U.S. as a whole, is widely used to present the performance of the U.S. stock price as a whole and be regarded as one of the most representative stock indicators in the United States. According to the historical data, the change of the S&P500 index is closely related to a lot of indices like the value of the dollar, the oil price and the international gold prices [11]. Therefore, the study of the correlation between these two is high valued to the investors, policy makers and economists.
3.1. Sample selection and data source
This paper selects the daily closing prices of the USD index and the S&P500 from 30 July 2016 to 1 August, 2023 as the sample selection. All studied data obtained from the wind database, all data are taken as log value to eliminate other interference factors.
3.2. Correlation analysis of the USD index and the S&P500
As shown in Figure 1, through a comparative analysis, using the data of the daily closing prices of the USD index and S&P500 in the recent years, it can be found that there is a strong correlation between the trend of the U.S. dollar and the performance of the S&P500 index, and the relationship between the two is affected by international trade friction, the risk of economic recession and the global epidemic.
Overall, the index is a slight negative correlation between the USD index and the S&P500.
Figure 1: The comparison of the USD index and the S&P500 |
Photo credit: Original |
Through the correlation analysis of the USD index and the S&P500, this paper got the correlation matrix as follows. As shown in table 1, the correlation of the USD index and the S&P500 is negative -0.510, satisfy the conclusion got from the figure 1. To exclude the possibility of a pseudo correlation, the data was further examined and analyzed.
Table 1: Correlation matrix
USD index | S&P500 | |
USD index | 1.000 | -0.510 |
S&P500 | -0.510 | 1.000 |
3.3. ADF test of the USD index and the S&P500
As shown in the table 2, all the value of the ADF test of the USD index and the S&P500 is larger than the critical value of 1% significant level. So the assumption of the existence of the unit root cannot be rejected and these two sequences are non-stationary.
Table 2: Unit root test of the USD index and the S&P500
Parameter | Value of ADF test | critical value of 1% | critical value of 5% | Stability |
USD index | -2.144 | -3.430 | -2.860 | No |
S&P500 | -0.944 | -3.430 | -2.860 | No |
D(USD index) | -32.190 | -3.430 | -2.860 | Yes |
D(S&P500) | -36.687 | -3.430 | -2.860 | Yes |
Through conducting OLS regression of the related variables, the Table 3 shows the related results. From Table 3 and Table 4, there is a stable negative correlation between the USD index and the S&P500.
Table 3: OLS regression of the related variables
Coefficient | Std. Error | t-Statistic | P>|t| | |
USD index | -0.509 | 0.070 | -7.27 | 0.000 |
_cons | 0.0004 | 0.0003 | 1.62 | 0.106 |
This paper used first order difference to analyze this two sequences and then conducted the unit root test. The value of the ADF test is less than the critical value of 1% significant level, so this two sets of the sequences were stable.
Table 4: Cointegration test results of the USD index and the S&P500
Variable | Whether contain constants | Whether contain trend term | Lag order | ADF test value | 5% critical value | Conclusion |
Z(t) | No | No | 0 | -2.374 | -1.950 | Stable |
3.4. VAR model of the USD index and the S&P500
In order to capture the dynamic correlation of the USD index and the S&P500, this paper uses AIC、SC、FRE、L and HQ criteria to determine the order of lag length is 2 and built a VAR model based on it. Figure 2 shows that the feature roots are within the unit circle, indicating that the variable model is stable.
Table 5: VAR model test
Eigenvalues | Coefficient |
0.9984553 | 0.998455 |
0.9875699 | 0.98757 |
-0.4684635 | 0.468463 |
-0.4120352 | 0.412035 |
Through Granger causality test of VAR model, the test results as shown in table 6, the outcome of the Granger test shows that the change of the USD index can lead to the change of the S&P500 index, which means the USD index is the reason why the S&P500 index change. As a result, it is appropriate to take the USD index as an explanatory variable and the S&P500 index as the explained variable.
|
Figure 2: Unit circle test |
Photo credit: Original |
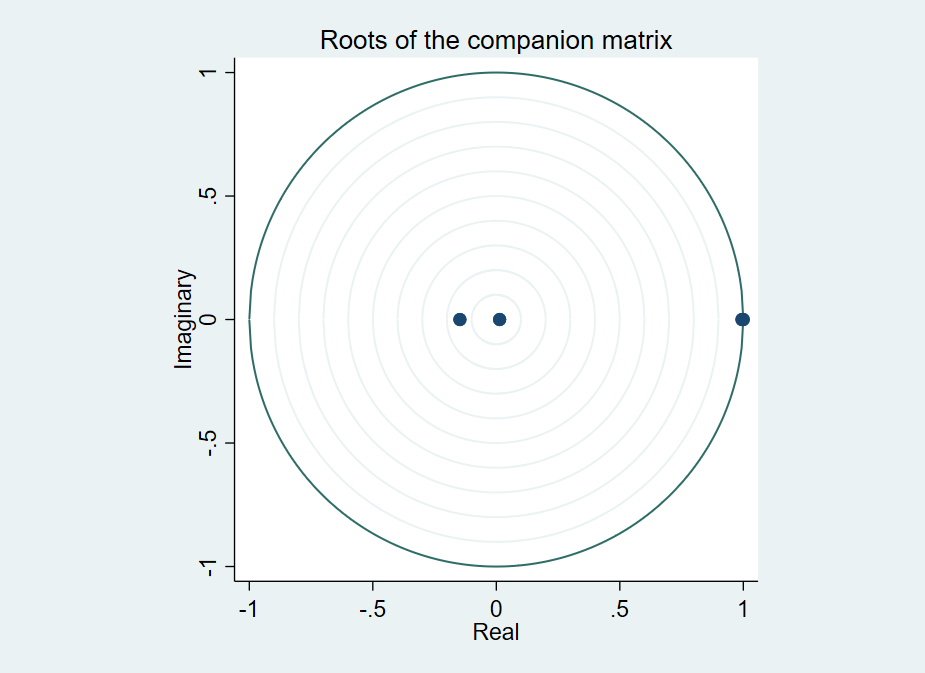
Table 6: The Granger causality test
Null Hypothesis | Observation | chi2 | P>chi2 |
S&P500 does not Granger Cause USD | 685 | 4.720 | 0.094 |
USD does not Granger Cause S&P500 | 14.466 | 0.000 | |
4. Conclusion
The main purpose of this paper was studying the correlation between the USD index and the S&P500. Based on the empirical analysis above, this paper concluded that there, between the USD index and the S&P500, is a negative correlation, which means the weakness of the U.S. dollar may be accompanied by the strength of the U.S. stocks to some extent. There are lots of reasons why there is a negative correlation between the USD index and the S&P500: (1) There are lots of factors affecting the stock market, such as the economic cycle, national macro policies, national economic performance, market news and so on. The US dollar index is only one of the influencing factors, which may have different effect to the U.S. stock market by combining with other factors. (2) Among the companies included in the S&P500, 43% of the companies’ revenue comes from overseas, and account nearly 60% among the technology industry which ranking top one. If the weakness of the dollar is due to the poor performance of the US economy relative to the rest of the world, it tends to be advantageous for these stocks. (3) The trends of the USD index and the U.S. stock are affected by the environment of the U.S. economy. If the U.S. economy faces challenges or the risks of increasing recession, it may lead to the negative impact on the U.S. dollar and the U.S. stock market. This paper select data from 30 July 2016 to 1 August, 2023, including the trade tensions between the China and the U.S., U.S. presidential election in 2016, brexit, covid-19 and many other tumultuous factors. In this period, the global economy entered a downward channel, forming multiple impacts on the U.S. stock market. (4) The strength of the U.S. dollar may be disadvantage to the export-oriented enterprises, reducing the revenue and competitiveness of these multinational companies and then having a certain negative impact on the U.S. stock market.
Compared with the influence of other variables on exchange rate, the impact of U.S. stock market on the exchange rate is relatively small. According to the historical data, the correlation between the changes in the USD index and the S&P500 is uncertain in different time period. It’s always essential to consider the actual situation when analyzing the correlation between this two[2]. For example, before the financial crisis in 2008, the USD index and the S&P500 always went up and down simultaneously. However, after the urgently cut interest rate controlled by the Federal Reserve System in the face of the economic crisis caused by the epidemic in 2020, the value of the U.S. stock increased dramatically while the USD index reached a new low; Since the 2022 rate hike cycle, the USD index and the S&P500, the USD index has been rising while the value of U.S. stock has been falling, which agrees with the conclusion this paper got that the strength of the dollar has certain negative affect on the U.S. domestic economy, which influence the rising of asset process such as the U.S. stocks as well. In the conclusion, the relationship between the USD index and the S&P500 is complex, the economic cycle, the national macro policy, the national economic operation status, market news and many other aspects would all affect the U.S. stock market. The devaluation of the U.S. dollar does not necessarily lead to the increasing of the U.S. stock market. Furthermore, it’s not appropriate to judge the change of the US. Stock Market simply by the changes of the exchange rate of the U.S. dollar. Therefore, to judge the impact of the dollar index on the US stock market, it’s not discreet enough to only pay attention at a single factor, instead, considering more economic, political and market changes is essential. In different time period, these factors will have different effects in different time periods.
References
[1]. Kim, K. (2003). Dollar exchange rate and stock price: evidence from multivariate cointegration and error correction model. Review of Financial Economics, 12(3), 301–313.
[2]. Zhu J. (2010). Summary of research on the relationship between exchange rate and stock price. #i{ China securities and futures }(8X), 3.
[3]. Aggarwal, R. (2003). Exchange rates and stock prices: a study of the us capital markets under floating exchange rates. Akron Business & Economic Review, 12(3), 7-12.
[4]. Hennigar, Soenen, L. A. (1988). An analysis of exchange rates and stock prices: The US experience between 1980 and 1986. Akron business and economic review, 19(4), .
[5]. Asea, P. K., & Corden, W. M. (1994). The Balassa‐Samuelson Model: an Overview*. Review of International Economics, 2(3), 191–200.
[6]. Wu L., & Fu G. . (2014). RMB Exchange Rate, Short-turn Capital Flows and Stock Price. Economic Research Journal, 49(11), 15.
[7]. Mao, C. K. G., & Kao, W. (1990), On Exchange Rate Changes and Stock Price Reactions Journal of Business. Finance and Accounting, 17 (3), 441-449.
[8]. Nieh, C., & Lee, C. (2001). Dynamic relationship between stock prices and exchange rates for G-7 countries. The Quarterly Review of Economics and Finance, 41, 477-490.
[9]. Yang, S., & Doong, S. (2004). Price and Volatility Spillovers between Stock Prices and Exchange Rates: Empirical Evidence from the G-7 Countries. International Journal of Business and Economics, 3(2), 139–153.
[10]. Wihlborg, C. (2014). Currency Risks in International Financial Markets Clas.
[11]. Sujit, K.S., Kumar, B.R. 2011. Study the dynamic relationship between gold price, oil price, exchange rate, and stock market returns. International Journal of Applied Business and Economic Research, 9(2): 145–165.
Cite this article
Zhang,T. (2024). The Research of the Correlation Between USD Index and S&P500. Advances in Economics, Management and Political Sciences,123,1-6.
Data availability
The datasets used and/or analyzed during the current study will be available from the authors upon reasonable request.
Disclaimer/Publisher's Note
The statements, opinions and data contained in all publications are solely those of the individual author(s) and contributor(s) and not of EWA Publishing and/or the editor(s). EWA Publishing and/or the editor(s) disclaim responsibility for any injury to people or property resulting from any ideas, methods, instructions or products referred to in the content.
About volume
Volume title: Proceedings of ICEMGD 2024 Workshop: Policies to Enhance Sustainable Development through the Green Economy
© 2024 by the author(s). Licensee EWA Publishing, Oxford, UK. This article is an open access article distributed under the terms and
conditions of the Creative Commons Attribution (CC BY) license. Authors who
publish this series agree to the following terms:
1. Authors retain copyright and grant the series right of first publication with the work simultaneously licensed under a Creative Commons
Attribution License that allows others to share the work with an acknowledgment of the work's authorship and initial publication in this
series.
2. Authors are able to enter into separate, additional contractual arrangements for the non-exclusive distribution of the series's published
version of the work (e.g., post it to an institutional repository or publish it in a book), with an acknowledgment of its initial
publication in this series.
3. Authors are permitted and encouraged to post their work online (e.g., in institutional repositories or on their website) prior to and
during the submission process, as it can lead to productive exchanges, as well as earlier and greater citation of published work (See
Open access policy for details).
References
[1]. Kim, K. (2003). Dollar exchange rate and stock price: evidence from multivariate cointegration and error correction model. Review of Financial Economics, 12(3), 301–313.
[2]. Zhu J. (2010). Summary of research on the relationship between exchange rate and stock price. #i{ China securities and futures }(8X), 3.
[3]. Aggarwal, R. (2003). Exchange rates and stock prices: a study of the us capital markets under floating exchange rates. Akron Business & Economic Review, 12(3), 7-12.
[4]. Hennigar, Soenen, L. A. (1988). An analysis of exchange rates and stock prices: The US experience between 1980 and 1986. Akron business and economic review, 19(4), .
[5]. Asea, P. K., & Corden, W. M. (1994). The Balassa‐Samuelson Model: an Overview*. Review of International Economics, 2(3), 191–200.
[6]. Wu L., & Fu G. . (2014). RMB Exchange Rate, Short-turn Capital Flows and Stock Price. Economic Research Journal, 49(11), 15.
[7]. Mao, C. K. G., & Kao, W. (1990), On Exchange Rate Changes and Stock Price Reactions Journal of Business. Finance and Accounting, 17 (3), 441-449.
[8]. Nieh, C., & Lee, C. (2001). Dynamic relationship between stock prices and exchange rates for G-7 countries. The Quarterly Review of Economics and Finance, 41, 477-490.
[9]. Yang, S., & Doong, S. (2004). Price and Volatility Spillovers between Stock Prices and Exchange Rates: Empirical Evidence from the G-7 Countries. International Journal of Business and Economics, 3(2), 139–153.
[10]. Wihlborg, C. (2014). Currency Risks in International Financial Markets Clas.
[11]. Sujit, K.S., Kumar, B.R. 2011. Study the dynamic relationship between gold price, oil price, exchange rate, and stock market returns. International Journal of Applied Business and Economic Research, 9(2): 145–165.