


1. Introduction
1.1. Research Background and Motivation
Unemployment rate is a measure of a country’s economy because it comprises phases of economic cycles, recession and economic volatility. The decade of 2014 to 2024 was characterized marked by significant events in the international environment comprising of COVID-19, Brexit, and shifts in the labor markets through automation, digitalization, and globalization. All these have greatly transformed the employment and unemployment situation in the UK and the Eurozone. These changes and their effects must be well-understood by the governments and other policymakers who face these issues in their countries.
In light of this, the following paper explores the Unemployment trends in the UK and the Eurozone for the major events between 2014 and 2024 and future forecasts. Furthermore, this study proposes to look at how forecasting approaches particularly the ARIMA time series model can help in future employment trends and contribute towards the formulation of good social security measures. That is why this survey will be useful for improving government transparency, for the better identification of needs and therefore for the allocation of resources, and for the better understanding of economic policy in everyday life.
1.2. Literature Review
TIKHOMIROVA, Tatiana, in a study of the unemployment rate in the labor market in various regions of Russia, found that most of the techniques for making short-term forecasts of unemployment are based on the use of the ARIMA model, which relates the current value of the indicator to the level of the past period. The authors develop an ARIMA (2,2,0) autoregressive model, which uses the monthly unemployment rate values of the country between October 1994 and October 2017 as source data to develop an expected increase in unemployment rate model for Russia. With good results, according to its estimates for the next 3 months, the country's unemployment rate will be 5.4-5.6% [1]. Md Junayed Hossain studied the relationship between GDP and unemployment rate, he chose ARIMA model to predict the future GDP of Britain, and included unemployment rate as an exogenous variable in the model, trying to analyze the impact of unemployment rate on GDP. The authors used the ARIMA (1,0,0) model for predictive analysis. The configuration of the model includes autoregressive and moving average processing of lagging terms of GDP and unemployment data. When predicting GDP, ARIMA model shows a negative correlation between GDP and unemployment rate, which can capture a certain trend. However, its limited effect in predicting GDP shows the limitations of the model, especially in the processing of complex multi-variable relationships. Thus, using ARIMA for a more single unemployment rate forecast can better capture time series trends [2]. Mayhew and Paul Anand investigated COVID-19 and the UK Labour market, they explored the fact that rise in unemployment in UK resulted from the pandemic. And due to actions of the UK Chancellor of the Exchequer and Bank of England starting to set fiscal and monetary policy as well as the Application for furloughing Scheme or Job Retention Scheme (JRS) by UK government, unemployment in the UK initially rose less than in some other countries, but still reached its peak after a period of moderation until unemployment rebounded from its slump in the later stages of the pandemic [3]. When examining the relationship between the monthly unemployment rate and Brexit, Mihaela Simionescu used the micro-data of political instability, a panel data model considering UK countries during a particular period, and a multi-level mixed effects model. Applying the random effects model could indicate that the long-term effect of Brexit on the conditions of economic growth and employment status in the UK might be very unfavorable. Inability to invest because of Brexit implications will lead to long term adverse effects to the sustainable future of UK. Hence when confronted with similar effects of the epidemic the unemployment rate in the UK accommodates attributes of higher uncertainty than the EU and hence it will be more volatile [4].
1.3. Research Contents
The authors selected monthly unemployment data for the UK and the Eurozone over a 10-year period and used the ARIMA model for forecasting and analysis to help governments make policies and allocate resources more effectively.
2. Method
2.1. Data Selection and Source
The author selected the monthly unemployment rate data of the UK and the Eurozone for the decade 2014-2024 from TRADING ECONOMICS [5].
2.2. ARIMA
The ARIMA model is a widely used method for analyzing and predicting time series data. It consists of three parts, namely autoregression (AR), difference (I) and moving average (MA), AR captures the relationship between the current observation and past observations, I represents differencing of the raw data to make the time series stationary and MA models the relationship between the current observation and past forecast errors. The parameter p represents how many past observations were used to predict the current value, the parameter d represents the number of differences, and the parameter q represents how many past prediction errors were used to correct the current prediction. The general formula for the ARIMA model is:
\( {Y_{t}}={ϕ_{1}}{Y_{t-1}}+{ϕ_{2}}{Y_{t-2}}+⋯+{ϕ_{p}}{Y_{t-p}}+{θ_{1}}{ε_{t-1}}+{θ_{2}}{ε_{t-2}}+⋯+{θ_{q1}}{ε_{t-q}}+{ϵ_{t}} \) (1)
Where \( {Y_{t}} \) is the observed value at time t, \( {ϕ_{1}} \) , \( {ϕ_{2}} \) , ... \( {ϕ_{p}} \) is the parameter of the autoregressive part, \( {θ_{1}} \) , \( {θ_{2}} \) ,... \( {θ_{q}} \) is the parameter of the moving average part, and ϵt is the white noise error term at time t.
The ARIMA model is especially useful when dealing with non-stationary data that should be made stationary using the first difference. Economic unemployment data tend to show a strong, temporal auto correlation characterized by current values shaped by past values and thus, the fit of ARIMA models. Furthermore, from the raw data, it is also obvious that the unemployment rates both in regions are non-stationary and therefore it is reasonable to use ARIMA because of the difference to achieve stationarity. In conclusion, it is appropriate to go ahead with the modeling of unemployment rates in both the UK and the Eurozone using ARIMA.
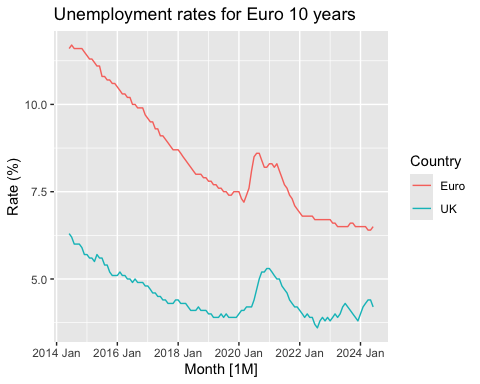
Figure 1: Unemployment rates for persons 10 years (seasonally adjusted).
The result of data visualization is shown in Figure 1. The unemployment rate in the UK can be observed to have continued to fall from a high level in 2014 to a low point in 2019, after which it rose slightly in early 2020, possibly due to the impact of COVID-19, before falling steadily again. The unemployment rate in the euro area also began to decline gradually from a high level in 2014. Around the end of 2019, the unemployment rate reached a low level, then saw a significant increase in early 2020 due to the impact of the pandemic, and then gradually declined. After the beginning of 2022, the unemployment rate in the euro area showed a steady trend. In order to test whether the original data is predictable, the stationarity test (ADF test) is carried out on the original data, and the results are shown in Table 1:
Table 1: ADF test.
P-value | |
UK | 0.3408 |
Euro | 0.7452 |
As can be seen from Table 1, the p-value of the two groups of time series data is greater than 0.05, and at the significance level of 5%, there is sufficient reason to reject the null hypothesis, that is, the two unemployment rate data series are not stable and need to be difference-processed. The features function is used to extract the features of the time series, and the number of difference required to make the time series stationary is determined based on the ADF test in combination with the unitroot_ndiffs function. The optimal number of difference given by the features function for both sets of time series data is 1. Then the time series diagram after difference was visualized and ACF and PACF diagrams were drawn, and the results were shown as Figures 2-3.
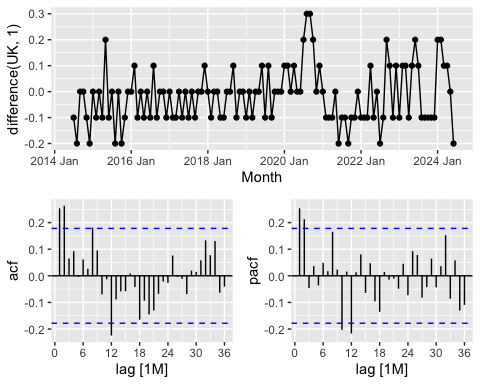
Figure 2: The result after difference (UK).
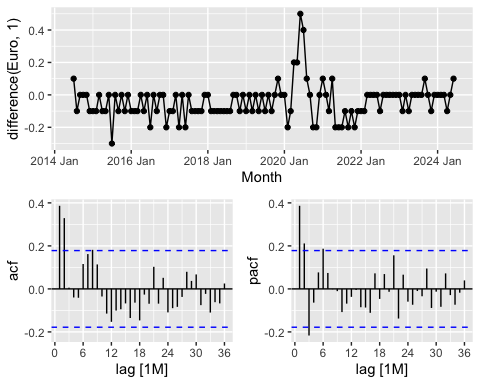
Figure 3: The result after difference (Euro).
It can be seen that the fluctuation of the Figures 2-3 of time series data after first-order difference is small, showing a certain degree of stationarity. The autocorrelation coefficients in the ACF and PACF graphs decay rapidly to zero, indicating that the data after first-order difference is already stable.
3. Results
The data set is splited, the data before 2023 is used as the training set and the data after 2023 is used as the test set. The selection of the model is done through the automated process, and the combination of parameters that can best fit the data is selected. For the unemployment rate data of the United Kingdom, the non-seasonal ARIMA model with seasonal autoregressive part is selected: ARIMA (2,1,0)(1,0,0)[12] considers two non-seasonal autoregressive terms and one seasonal autoregressive term, and includes one drift term. The goodness of fit of the model shows the good fit of the model. For the unemployment rate data of the euro area, the non-seasonal ARIMA model containing the seasonal moving average is selected: ARIMA (0,1,2)(0,0,1)[12]. The goodness of fit of the model shows the good fit of the model. Details of the model, including selected parameters are shown in Table 2:
Table 2: ARIMA model.
model | AIC | AICc | BIC | |
UK | ARIMA (2,1,0)(1,0,0)[12] | -185.16 | -184.54 | -172.04 |
Euro | ARIMA (0,1,2)(0,0,1)[12] | -179.35 | -178.73 | -166.23 |
The training set was used to fit unemployment data for the UK and the Eurozone, respectively, to generate forecasts for the test set cycle, and measures such as ME, RMSE, and MAPE were used to assess the accuracy of the model. Based on the prediction results of the UK unemployment rate, the measurement values of Mean Error (ME), Root Mean Squared Error (RMSE), Mean Absolute Percentage Error (MAPE) on the training set show that the accuracy of the model is very good, and the error between the predicted value and the actual value is very small. On the test set, the model's prediction error increases, especially for ME and MAPE, which means that the model does not perform as well on the test set as on the training set, and the prediction performance decreases on the test set, which may be caused by new exogenous shocks or policy changes in the data after 2023. But the ARIMA model still managed to capture a small increase in the unemployment rate in the early months of 2023, and the model's predictions were very close to the actual data. The focus of the model when forecasting is still on short-term trends, not long-term fluctuations. Therefore, as the author move into 2023, the model still references the previous data trends and predicts future declines in the unemployment rate based on long-term historical data performance. The prediction results of the model on the training set and the comparison between the predicted value and the real value of the test set are shown in the Figures 4-5.
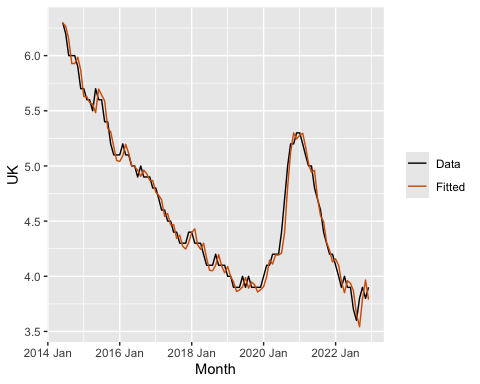
Figure 4: Training set (UK).
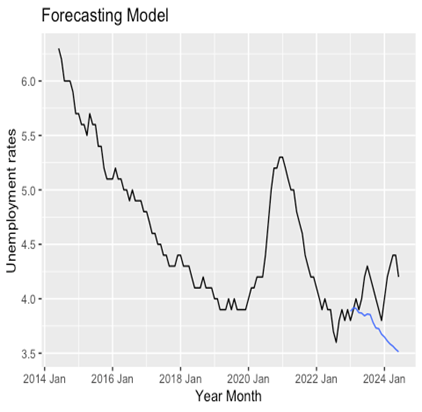
Figure 5: Test set (UK).
The results of Ljung-Box test show that the P-value of autocorrelation detection of ARIMA model residuals is 0.1981081, which is much higher than the commonly used significance level (0.05), indicating that there is not enough evidence to reject the hypothesis that the residuals are white noise. This shows that the ARIMA model has captured the information in the data well, and the model residuals are displayed as randomness, which proves that the fitting effect of the model is appropriate.
Based on the forecast results of the unemployment rate in the euro area, the ARIMA model for the euro area agrees well with the training data, the error indicators are very low, and the difference between the predicted and actual values is small. On the test set, although the model predicted a slightly higher value than the actual value, there is a certain bias, but the ARIMA model caught the signal of the unemployment rate in the early months of 2023, and successfully predicted the relative stability of the unemployment rate over this period. Going into the future forecast phase, the model may still predict a slight decline rather than a continuation of stability because of the long-term downward trend present in the data throughout the time series, but the model's forecast performance is better than that of the UK unemployment rate, and the overall performance is more reliable. The prediction results of the model on the training set and the comparison between the predicted value and the real value of the test set are shown in the Figures 6-7.
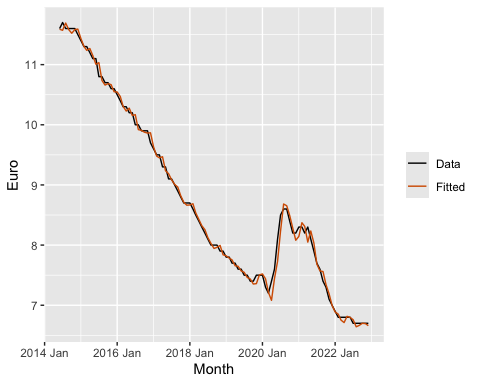
Figure 6: Training set (Euro).
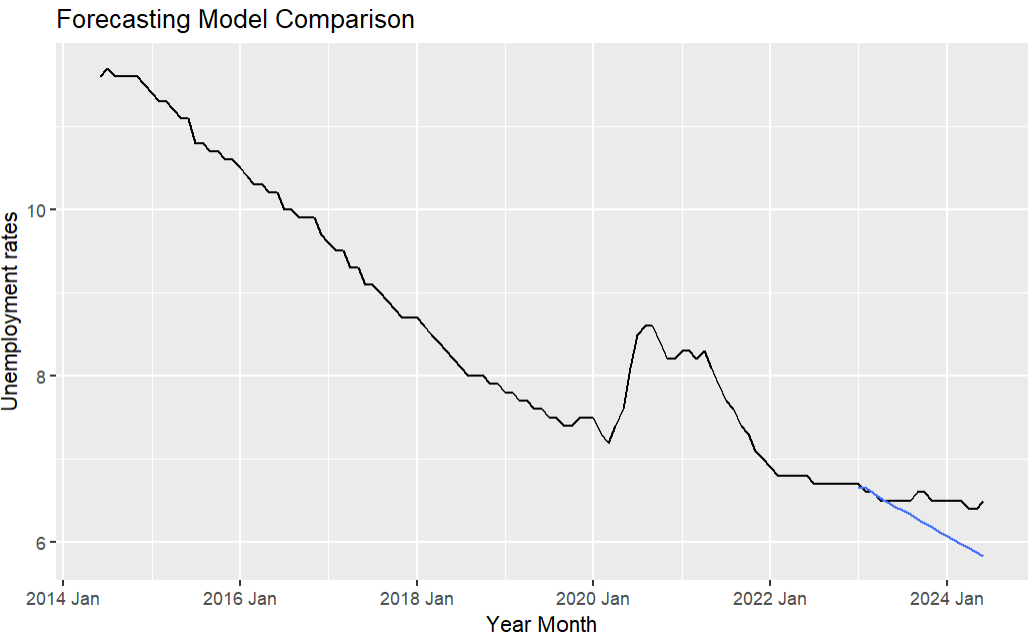
Figure 7: Test set (Euro).
The results of Ljung-Box test show that the P-value of the autocorrelation detection for the residual of the ARIMA model is 0.7324913, which is much higher than the commonly used significance level (such as 0.05), indicating that there is not enough evidence to reject the hypothesis that the residual is white noise. This shows that the ARIMA model has captured the information in the data well, and the model residuals are displayed as randomness, which proves that the fitting effect of the model is appropriate. In summary, the ARIMA model is very suitable for the unemployment rate in the UK and the Eurozone, and although there may be some errors in the specific forecast points, the conclusions are generally reasonable. The model successfully captured the major trends, and the residual tests showed that the model had fully fitted the data. The higher accuracy in the euro area can be attributed to a more consistent trend in the data, while the UK data show more variability.
4. Discussion
From 2014 to 2024, unemployment rates in the UK and the euro area experienced significant changes due to a number of major events. By analyzing the changes of unemployment rate in these two regions, the author can better understand the causes of these changes and put forward corresponding policy recommendations.
4.1. Analysis of the Underlying Reasons
Unemployment in the UK has been falling since 2014. During this period, the UK economy began to rebound from the effects of the 2008 global financial crisis, and the government implemented a number of pro-employment policies such as quantitative easing and low interest rates to tackle unemployment. However, in the 2016 financial year, business uncertainty in the UK rose as a result of Brexit, capital investment fell and overall GDP growth was subdued. Although unemployment has not risen significantly in the short term, there are signs that Brexit has slowed the annual rate of decline in unemployment in the run-up to 2020. The COVID-19 pandemic had a huge impact on the economy in 2020. Britain has imposed strict lockdowns and restrictions, leading to a massive exodus of businesses and unemployment starting to rise in 2020. Nonetheless, rapid government intervention, such as the Support for Work Programme, helped to slow the rise in unemployment; However, unemployment will peak in 2021 [6]. After 2021, the gradual weakening of the economic impact of population vaccination and the pandemic led to a decline in unemployment [7]. But because of supply chain problems and inflation, unemployment rose to 2022 levels. The reason for the volatility is the uncertainty of the economic recovery after the pandemic. From 2023 onwards, the real unemployment rate is forecast to fall again. However, due to Brexit and unresolved global economic uncertainties resulting in the specific trade relationship between the UK and the EU, the unemployment rate forecast remains very vague.
Similar to the UK, the Eurozone also experienced a sustained decline in unemployment between 2014 and 2019. Thanks to the monetary easing policies of the European Central Bank and the stability of the internal market of the European Union, the Eurozone countries have gradually recovered from the economic crisis and the unemployment rate has maintained a steady decline. However, the 2020 pandemic will hit the Eurozone even harder. Due to the diversification of the economic structure of the Eurozone member states, the response measures and effects of the epidemic in each country are also different, resulting in a sharp rise in the overall unemployment rate in the Eurozone in 2020. In the early stages of the epidemic, unemployment quickly stabilized in 2021[8], thanks to fiscal stimulus policies by governments and support from the European Central Bank. However, with the outbreak of the Russia-Ukraine conflict in 2022, the Eurozone faced an energy crisis and inflationary pressures, leading to a rebound in unemployment in 2022. The Russian-Ukrainian conflict has particularly affected manufacturing powerhouses such as Germany and France, adding to the volatility of unemployment [9]. Nonetheless, model projections suggest that unemployment in the euro area will gradually decline after 2023, indicating the strong recovery capacity of the EU internal market and the effectiveness of integration policies.
4.2. Suggestion
First, the author identified the strategic areas that the UK should focus on to resolve the economic issues brought about by Brexit. To start with, uncertainty should be minimized in the market through the development of international trade and investments cooperation with non-European countries and attracting foreign investments in the trade cooperation. Secondly, efforts should be directed towards improving occupational training as well as re-employment services within sectors that have been negatively impacted by Brexit. These training initiatives can help governments place the unemployed into new opportunities and foster change in the economy. Finally, science and technology development in combination with a digital economy can create high quality jobs. The government should support development of such areas through provision of tax incentives and favorable policies.
To overcome the challenges facing the Eurozone, certain strategic moves are required. First of all, the shift of energy policy is necessary as the energy crisis that occurred due to the conflict between Russia and Ukraine shows. It prepares the Eurozone to develop non-Russian energy sources and apply renewable energy to get the economy back on track and minimize the level of unemployment. Second, continuation and enhancement of the internal market is crucial; liberalisation and opening up of barriers to economic interconnection between member states will spur growth and employment [10]. Finally, improving and enhancing social security measures is essential during economic cycles to guarantee the necessities of the unemployed since unemployment rises in challenging economic times to avoid upsetting the social order.
5. Conclusion
This paper highlights the ability of the ARIMA model to predict long-term unemployment trends, but also points out its limitations in capturing short-term fluctuations. The ARIMA model performs better in the euro area, forecasting a slight decline in unemployment after 2023. However, the model shows a higher forecast error for the UK data, suggesting that while ARIMA is useful, it may not fully account for sudden economic shocks or policy changes. Prospective works could enhance forecasting and predictions like including factors such as political events and global crises as exogenous variables to enhance the models. And other mixed models that incorporate features of ARIMA and machine learning to provide a more accurate reflection of the state of economic indicators. Further, the paper advises policymakers to look at a wider array of models and to update input frequently so as to enhance the exactness of unemployment projections. It could foster preferable economic policies as well as help get ready for the future uncertainty.
References
[1]. TIKHOMIROVA, T., & NECHETOVA, A. (2019). Models for the short-term and mid-term forecasting of the unemployment rate. Revista Espacios, 40 (30).
[2]. Md Hossain. (2023). Comparative Analysis of ARIMA, SARIMAX, and Random Forest Models for Forecasting Future GDP of the UK in Relation to Unemployment Rate. International Journal of Management, Accounting and Economics, 10(11), 924-937.
[3]. Mayhew, K., & Anand, P. (2020). COVID-19 and the UK labour market. Oxford Review of Economic Policy, 36, S215-S224.
[4]. Simionescu, M., Streimikiene, D., & Strielkowski, W. (2020). What does Google Trends tell us about the impact of Brexit on the unemployment rate in the UK?. Sustainability, 12(3), 1011.
[5]. Trading Economics. (2024). Unemployment rate in the United Kingdom. Retrieved from https://tradingeconomics.com/united-kingdom/unemployment-rate.
[6]. Costa Dias, M., Joyce, R., Postel‐Vinay, F., & Xu, X. (2020). The challenges for labour market policy during the Covid‐19 pandemic. Fiscal Studies, 41(2), 371-382.
[7]. Fernández-Reino, M., & Rienzo, C. (2022). Migrants in the UK labour market: An overview. Migration Observatory, 6.
[8]. Mogoș, R. I., Dinu, M., Constantinescu, V. G., & Istrate, B. (2022). Unemployment in European union during the COVID-19 pandemic. A cluster analysis. In 8th BASIQ international conference on new trends in sustainable business and consumption, 117-124.
[9]. Prohorovs, A. (2022). Russia’s war in Ukraine: Consequences for European countries’ businesses and economies. Journal of risk and financial management, 15(7), 295.
[10]. Wulfgramm, M. (2014). Life satisfaction effects of unemployment in Europe: The moderating influence of labour market policy. Journal of European Social Policy, 24(3), 258-272.
Cite this article
Yan,Y. (2024). Research on UK Unemployment Rate Forecast Based on ARIMA Model. Advances in Economics, Management and Political Sciences,123,26-35.
Data availability
The datasets used and/or analyzed during the current study will be available from the authors upon reasonable request.
Disclaimer/Publisher's Note
The statements, opinions and data contained in all publications are solely those of the individual author(s) and contributor(s) and not of EWA Publishing and/or the editor(s). EWA Publishing and/or the editor(s) disclaim responsibility for any injury to people or property resulting from any ideas, methods, instructions or products referred to in the content.
About volume
Volume title: Proceedings of ICEMGD 2024 Workshop: Policies to Enhance Sustainable Development through the Green Economy
© 2024 by the author(s). Licensee EWA Publishing, Oxford, UK. This article is an open access article distributed under the terms and
conditions of the Creative Commons Attribution (CC BY) license. Authors who
publish this series agree to the following terms:
1. Authors retain copyright and grant the series right of first publication with the work simultaneously licensed under a Creative Commons
Attribution License that allows others to share the work with an acknowledgment of the work's authorship and initial publication in this
series.
2. Authors are able to enter into separate, additional contractual arrangements for the non-exclusive distribution of the series's published
version of the work (e.g., post it to an institutional repository or publish it in a book), with an acknowledgment of its initial
publication in this series.
3. Authors are permitted and encouraged to post their work online (e.g., in institutional repositories or on their website) prior to and
during the submission process, as it can lead to productive exchanges, as well as earlier and greater citation of published work (See
Open access policy for details).
References
[1]. TIKHOMIROVA, T., & NECHETOVA, A. (2019). Models for the short-term and mid-term forecasting of the unemployment rate. Revista Espacios, 40 (30).
[2]. Md Hossain. (2023). Comparative Analysis of ARIMA, SARIMAX, and Random Forest Models for Forecasting Future GDP of the UK in Relation to Unemployment Rate. International Journal of Management, Accounting and Economics, 10(11), 924-937.
[3]. Mayhew, K., & Anand, P. (2020). COVID-19 and the UK labour market. Oxford Review of Economic Policy, 36, S215-S224.
[4]. Simionescu, M., Streimikiene, D., & Strielkowski, W. (2020). What does Google Trends tell us about the impact of Brexit on the unemployment rate in the UK?. Sustainability, 12(3), 1011.
[5]. Trading Economics. (2024). Unemployment rate in the United Kingdom. Retrieved from https://tradingeconomics.com/united-kingdom/unemployment-rate.
[6]. Costa Dias, M., Joyce, R., Postel‐Vinay, F., & Xu, X. (2020). The challenges for labour market policy during the Covid‐19 pandemic. Fiscal Studies, 41(2), 371-382.
[7]. Fernández-Reino, M., & Rienzo, C. (2022). Migrants in the UK labour market: An overview. Migration Observatory, 6.
[8]. Mogoș, R. I., Dinu, M., Constantinescu, V. G., & Istrate, B. (2022). Unemployment in European union during the COVID-19 pandemic. A cluster analysis. In 8th BASIQ international conference on new trends in sustainable business and consumption, 117-124.
[9]. Prohorovs, A. (2022). Russia’s war in Ukraine: Consequences for European countries’ businesses and economies. Journal of risk and financial management, 15(7), 295.
[10]. Wulfgramm, M. (2014). Life satisfaction effects of unemployment in Europe: The moderating influence of labour market policy. Journal of European Social Policy, 24(3), 258-272.