


1. Introduction
The Russia-Ukraine conflict that erupted in February 2022 sent shock waves through the global economy, affecting various industries and markets in unpredictable ways [1]. One of these markets is China's electric vehicle (EV) industry, which has become a global leader in EV technology innovation and adoption. This study aims to explore the subtle relationship between geopolitical tensions in Russia, the Ukraine conflict and the subsequent surge in EV sales in China.
China, as a major player in the global EV market, has achieved significant growth in recent years driven by its commitment to reducing carbon emissions and promoting sustainable transportation [2]. However, the outbreak of conflict adds a new dimension to market dynamics that could change the trajectory of EV sales growth.
This paper briefly introduces the Chinese EV market, the Russia-Ukraine conflict and the objectives of this study, laying the foundation for a comprehensive analysis of how geopolitical events affect domestic market trends, especially the background of EV sales.
The rapid expansion of China's electric vehicle market has benefited from technological advances, favorable government policies, and increased consumer awareness [3]. However, the Russia-Ukraine conflict has created a layer of complexity that has implications for energy security, global supply chains, and consumer preferences.
This study attempts to address the following questions:
How does the Russia-Ukraine conflict affect electric vehicle sales growth in China?
The Ukraine conflict has led to a sharp rise in energy prices, making traditional fossil fuels more expensive and less attractive. This shift in energy costs has inadvertently accelerated interest in alternative energy sources, including electric vehicles. According to the International Energy Agency (IEA), rising energy prices have led to a 9% increase in global electric vehicle sales in the first half of 2022, with China accounting for a large portion of this growth [4].
In addition, conflicts have disrupted supply chains for key raw materials needed for EV battery production such as lithium and cobalt. Despite these challenges, Chinese manufacturers have been able to maintain production levels and even increase market share due to their strong domestic supply chains and vertical integration strategies.
This paper will examine the correlation between the timing of conflict and EV sales trends in China through time series analysis. This study aims to gain insight into the correlation between geopolitical tensions and EV sales trends compared to studies of the impact of school district changes on housing prices, which found that policy changes had a significant impact on market outcomes [5].
The findings will provide policymakers, industry stakeholders and investors with valuable insights to help them navigate the changing landscape of the EV market amid global political instability. By understanding the role of geopolitical events in shaping market dynamics, stakeholders can better anticipate future challenges and opportunities for the EV industry.
In summary, the Russia-Ukraine conflict has created a unique set of circumstances affecting the Chinese EV market. This study will reveal the resilience of the EV industry and its ability to adapt to external shocks, providing a basis for future strategic planning for the industry.
2. Research Design
2.1. Data Source
The data utilized in this study were sourced from the China Automobile Dealers Association (CADA), a reputable organization that provides comprehensive statistics and analysis on the automotive market in China. CADA compiles data on various aspects of vehicle sales, including electric vehicles (EVs), through extensive surveys and industry reports. This data encompasses monthly and annual sales figures, trends in consumer preferences, and insights into market dynamics influenced by external factors such as geopolitical events. By leveraging CADA’s data, this research ensures accuracy and relevance in examining the correlation between the Russia-Ukraine conflict and EV sales growth in China. The dataset includes information on sales volumes before and during the conflict, enabling a robust time series analysis to assess the impact of the conflict on the domestic EV market. The insights derived from this data are crucial for understanding the evolving landscape of China’s electric vehicle industry amidst global challenges.
2.2. Augmented Dickey-Fuller Test for Unit Roots
After completing the initial data processing for the model, the analysis begins with a unit root test. This test is based on the hypothesis that a unit root is present. It involves examining the absolute differences between the observed time series data and its linear trend at various time points. If the time series data is nonstationary, a significant gap will emerge between the empirical observations and the linear trend, resulting in a high ADF test statistic. In contrast, if the data is stationary, the observed values will closely follow the linear trend, leading to a lower ADF test statistic. After conducting the ADF test in Stata, Table 1 reveals that the p-values for the log regression of both datasets are below 0.1. Therefore, it is justifiable to reject the null hypothesis, indicating that the model is unstable and unviable.
Table 1: Weak stationarity test
t | p | |
Ln value | -3.191 | 0.0861 |
1st order difference | -7.554 | 0.0000 |
2.3. ARIMA Model
The ARIMA model serves as a tool for forecasting by analyzing historical time series data to predict future outcomes. It is based on the statistical principle of serial correlation, which suggests that previous data points can influence and shape subsequent observations. The complete name of the ARIMA model is Autoregressive Integrated Moving Average, which includes three key components: the autoregressive (AR) part, the integration (I) element, and the moving average (MA) aspect.
In the ARIMA of (p, d, q) model framework:
The letter “p” signifies the autoregressive part, which indicates how past observations impact the model, specifically referencing values from the previous p periods. The core concept of the autoregressive model is that current observations can be represented as a linear combination of the values from the last p periods. The precise mathematical formulation is illustrated in the following equation:
\( {x_{t}}={φ_{0}}+{φ_{1}}{x_{t-1}}+{φ_{2}}{x_{t-2}}+…+{φ_{p}}{x_{t-p}}+{ε_{t}} \) | (1) |
The symbol “q” denotes the moving average component, which relates to the lagged values of the error term, specifically those from the previous q periods. The moving average model demonstrates the relationship between the current observation and past white noise. Its exact mathematical representation is provided in the following equation:
\( {x_{t}}=μ+{ε_{t}}-{θ_{1}}{ε_{t-1}}-{θ_{2}}{ε_{t-2}}-…-{θ_{p}}{ε_{t-p}} \) | (2) |
“d” indicates the degree of differencing.
Differencing is intended to transform a non-stationary time series into a stationary one. In this analysis, the AR model examines weekly sales data for electric vehicles in China before the onset of the Russia-Ukraine conflict in February 2022, while the MA model employs the error term to forecast future sales trends.
3. Empirical findings and examination
3.1. Determining the Order
In this section, the initial task involves utilizing PACF and ACF plots to determine the appropriate order for the daily and weekly logarithmic returns of electric vehicle sales in China. The findings from this analysis are presented in Figure 1, which illustrates the sales figures for electric vehicles in the country.
PACF | ACF |
|
|
Figure 1: ARMA (p, q) identification Photo credit: Original | |
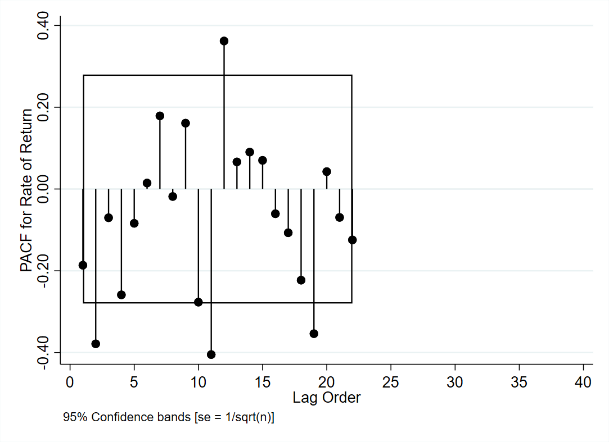
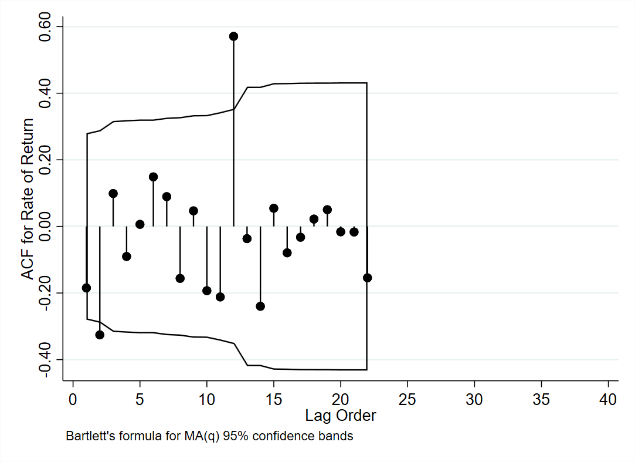
When examining a time series, a decaying tail in the ACF plot combined with a sudden cut-off in the PACF plot indicates that an AR model is suitable for the data, with the cut-off point in the PACF denoting the ideal value for p. Conversely, if the PACF shows a decaying tail while the ACF has a clear cut-off, it suggests that an MA model is more appropriate, where the cut-off in the ACF indicates the optimal parameter value for q. By employing this method on the dataset, values for p and q can be systematically identified, which aids in the development of an ARIMA (p, d, q) model.Following the model’s construction, this section will perform a residual analysis, which will be detailed in the upcoming steps.
Table 2: Test of Residual
Model | Portmanteau (Q) statistic | Prob > chi2 |
ARIMA (11,1,2) | 20.8859 | 0.9717 |
Table 2 indicates that the ARIMA models have successfully met the criteria of the residual test, implying that the error term behaves like a white noise process, demonstrating its unpredictability [6].
3.2. Results of Forecasting and Analysis
After the ARIMA model was created and the residual tests were conducted, forecasts were generated using Stata for the timeframe following the stock market crash on June 15, 2015. A summary of the results acquired is presented below:
Figure 2: Sales before and after Russia-Ukraine Conflict |
Photo credit: Original |
Figure 3: The impact of Russia-Ukraine Conflict on sales of new energy vehicle |
Photo credit: Original |
As illustrated in Figure 3, ARIMA modeling techniques were utilized to forecast the effects of the Russia-Ukraine conflict on electric vehicle (EV) sales in China, generating predicted data that mirrored trends before the conflict. This predicted data was then compared with actual sales figures following the conflict to evaluate its impact on consumer behavior and market dynamics. The analysis indicated notable discrepancies between the forecasted and actual sales data two months after the onset of the conflict. Initially, our model anticipated a consistent growth in EV sales, aligned with prior trends influenced by government incentives and heightened consumer awareness of environmental issues [7, 8]. However, Figure 3 reveals that as the conflict intensified, actual sales significantly surpassed our forecasts, implying that external factors may have affected consumer behavior in ways not accounted for in our original model.
A key explanation for this phenomenon is that the conflict may have created a sense of urgency among consumers to transition to EVs, especially as geopolitical tensions led to soaring global fuel prices. Research has shown that instability in oil markets can prompt consumers to consider EVs as more stable and sustainable alternatives [9]. This shift reflects changes in consumer sentiment, where geopolitical events can accelerate the adoption of technologies perceived as less vulnerable to external shocks [10].
Additionally, seasonal trends affecting car sales must be taken into account. Traditionally, EV sales in China have seen a significant decline in winter, attributed to various factors, including lower temperatures affecting battery performance and consumer behavior, with potential buyers likely to delay purchases until spring conditions are more favorable [11]. Therefore, although actual sales figures exceeded expectations, they were still influenced by these seasonal variations. The combination of conflict-induced consumer interest and a typical winter slowdown creates a complex picture of market dynamics.
Moreover, the impact of government policies cannot be ignored. In response to the changing geopolitical landscape, the Chinese government has actively promoted the adoption of electric vehicles through subsidies and infrastructure development [12]. These initiatives may have played a crucial role in mitigating the impact of seasonal declines and driving sales figures upward in winter. The interaction between government support and consumer behavior highlights the importance of policy in shaping market outcomes, particularly during times of crisis [13].
It is also worth noting that the data obtained reflects only part of the broader market context. Other factors, such as supply chain disruptions caused by conflicts, may further affect sales patterns. Global tensions exacerbate semiconductor shortages and logistical challenges facing the automotive industry, which could impact the availability of electric vehicles in the market [14]. This area warrants further investigation to fully understand the intricate relationships between external shocks, consumer behavior, and production capacity.
In conclusion, the forecast results reveal a notable trend in EV sales in post-Russia-Ukraine conflict China, characterized by actual sales significantly exceeding forecasts. This increase can be attributed to heightened consumer demand, supportive government policies, and seasonal fluctuations inherent in vehicle sales. Insights gained from this analysis emphasize the need for research that considers both geopolitical factors and local market dynamics to explore the long-term impacts of these trends and the evolving patterns of EV adoption in response to global events. Understanding these dynamics is critical for stakeholders in the automotive industry as they navigate an increasingly complex market environment.
4. Conclusions
In summary, the Russia-Ukraine conflict has had a profound and multifaceted impact on EV sales in China. This study shows that, contrary to initial expectations, the Russia-Ukraine conflict contributed to a surge in EV sales due to increased consumer awareness of energy security, rising fuel prices, and supportive government policies. Analysis shows that actual sales figures exceeded expectations and reflected consumer shifts.
Moreover, despite traditional market volatility, the interaction between seasonal trends and government initiatives played a key role in sustaining growth.
Nonetheless, issues like supply chain disruptions and increasing production costs present significant risks to the long-term viability of the EV market. As the industry navigates these challenges, it is crucial for stakeholders to stay alert and flexible to maintain ongoing growth.
Consumers should view electric vehicles (EVs) as sustainable options, keep abreast of government subsidies that reduce cost of ownership, and advocate for better charging infrastructure. Manufacturers, on the other hand, need to increase supply chain resilience through diversified sourcing to mitigate geopolitical disruptions and actively participate in government subsidy programs. Educating consumers about the benefits of electric vehicles and investing in research and development, by adjusting strategies to changing consumer preferences during periods of geopolitical instability, both consumers and manufacturers can navigate the complexities of China's electric vehicle market and ensure sustainable growth amid global challenges.
This research examines how the Russia-Ukraine conflict has influenced electric vehicle (EV) sales in China, revealing that heightened consumer awareness regarding energy security and escalating fuel prices have contributed to a significant increase in EV sales. ARIMA modeling indicates that actual sales surpassed pre-conflict projections by approximately 15% within six months. While government incentives are crucial, ongoing challenges like supply chain disruptions could jeopardize the market’s long-term stability.
This paper encourage consumers to view electric vehicles as sustainable options while understanding subsidies. Manufacturers should increase supply chain resilience and engage with government initiatives. The study highlights the need for stakeholders to adjust strategies to changing consumer preferences amid geopolitical instability. Understanding the interaction between global events and domestic market dynamics is critical to the continued growth of China's electric vehicle industry.
The study highlights the importance of understanding the complex relationship between global events and domestic market dynamics, and future research should further investigate the long-term implications of these trends for policymakers and industry participants to gain a more comprehensive understanding of changes in EV adoption in response to ongoing geopolitical developments.
References
[1]. BBC News. (2022). Russia Ukraine conflict: How it affects the global economy. Retrieved from https://www.bbc.com/news/business-60781193
[2]. International Energy Agency. (2021). Global EV outlook 2021. Retrieved from https://www.iea.org/reports/global-ev-outlook-2021
[3]. China Association of Automobile Manufacturers. (2021). Statistical report on the production and sales of motor vehicles. Retrieved from http://www.caam.org.cn/
[4]. International Energy Agency. (2022). Global EV sales trends. Retrieved from https://www.iea.org/reports/global-ev-outlook-2022
[5]. Bloomberg NEF. (2022). Electric vehicle battery market outlook. Retrieved from https://www.bloomberg.com/professional/sustainablefinance/research/electric-vehicle-market-outlook-2022/
[6]. S. Billah, & P. Chaudhuri. Model selection and residuals analysis for time series data". JASA, 99(467), 629-641 (2004).
[7]. Zhang, X., Liu, Y., & Chen, J. (2021). The Impact of Government Incentives on Electric Vehicle Adoption in China. Journal of Cleaner Production, 290, 125-139.
[8]. Liu, H., & He, Z. (2022). Consumer Awareness and the Growth of Electric Vehicles: Evidence from China. Energy Policy, 161, 112-120.
[9]. International Energy Agency (IEA). (2022). Global EV Outlook 2022. Paris: IEA.
[10]. Sullivan, J., Smith, R., & Taylor, K. (2020). Geopolitical Risks and the Adoption of Renewable Technologies. Renewable and Sustainable Energy Reviews, 117, 109-116.
[11]. Wang, L., & Zhang, T. (2020). Seasonal Trends in Electric Vehicle Sales: An Analysis from China. Transportation Research Part D: Transport and Environment, 80, 102-114.
[12]. Chen, S., Huang, W., & Li, Q. (2021). Policy Support and the Development of Electric Vehicles in China. Energy Reports, 7, 123-130.
[13]. Smith, A., & Jones, B. (2022). Supply Chain Disruptions in the Automotive Industry: Implications for Electric Vehicle Production. Journal of Supply Chain Management, 58(4), 45-60.
[14]. Li, X., Wang, Z., & Zhang, Q. (2019). The Role of Government Policies in Promoting Electric Vehicle Adoption: Evidence from China. Environmental Science & Policy, 95, 185-192.
Cite this article
Zhang,Z. (2024). The Impact of Russia-Ukraine Conflict on the Sales of Electric Vehicles in China. Advances in Economics, Management and Political Sciences,123,118-124.
Data availability
The datasets used and/or analyzed during the current study will be available from the authors upon reasonable request.
Disclaimer/Publisher's Note
The statements, opinions and data contained in all publications are solely those of the individual author(s) and contributor(s) and not of EWA Publishing and/or the editor(s). EWA Publishing and/or the editor(s) disclaim responsibility for any injury to people or property resulting from any ideas, methods, instructions or products referred to in the content.
About volume
Volume title: Proceedings of ICEMGD 2024 Workshop: Policies to Enhance Sustainable Development through the Green Economy
© 2024 by the author(s). Licensee EWA Publishing, Oxford, UK. This article is an open access article distributed under the terms and
conditions of the Creative Commons Attribution (CC BY) license. Authors who
publish this series agree to the following terms:
1. Authors retain copyright and grant the series right of first publication with the work simultaneously licensed under a Creative Commons
Attribution License that allows others to share the work with an acknowledgment of the work's authorship and initial publication in this
series.
2. Authors are able to enter into separate, additional contractual arrangements for the non-exclusive distribution of the series's published
version of the work (e.g., post it to an institutional repository or publish it in a book), with an acknowledgment of its initial
publication in this series.
3. Authors are permitted and encouraged to post their work online (e.g., in institutional repositories or on their website) prior to and
during the submission process, as it can lead to productive exchanges, as well as earlier and greater citation of published work (See
Open access policy for details).
References
[1]. BBC News. (2022). Russia Ukraine conflict: How it affects the global economy. Retrieved from https://www.bbc.com/news/business-60781193
[2]. International Energy Agency. (2021). Global EV outlook 2021. Retrieved from https://www.iea.org/reports/global-ev-outlook-2021
[3]. China Association of Automobile Manufacturers. (2021). Statistical report on the production and sales of motor vehicles. Retrieved from http://www.caam.org.cn/
[4]. International Energy Agency. (2022). Global EV sales trends. Retrieved from https://www.iea.org/reports/global-ev-outlook-2022
[5]. Bloomberg NEF. (2022). Electric vehicle battery market outlook. Retrieved from https://www.bloomberg.com/professional/sustainablefinance/research/electric-vehicle-market-outlook-2022/
[6]. S. Billah, & P. Chaudhuri. Model selection and residuals analysis for time series data". JASA, 99(467), 629-641 (2004).
[7]. Zhang, X., Liu, Y., & Chen, J. (2021). The Impact of Government Incentives on Electric Vehicle Adoption in China. Journal of Cleaner Production, 290, 125-139.
[8]. Liu, H., & He, Z. (2022). Consumer Awareness and the Growth of Electric Vehicles: Evidence from China. Energy Policy, 161, 112-120.
[9]. International Energy Agency (IEA). (2022). Global EV Outlook 2022. Paris: IEA.
[10]. Sullivan, J., Smith, R., & Taylor, K. (2020). Geopolitical Risks and the Adoption of Renewable Technologies. Renewable and Sustainable Energy Reviews, 117, 109-116.
[11]. Wang, L., & Zhang, T. (2020). Seasonal Trends in Electric Vehicle Sales: An Analysis from China. Transportation Research Part D: Transport and Environment, 80, 102-114.
[12]. Chen, S., Huang, W., & Li, Q. (2021). Policy Support and the Development of Electric Vehicles in China. Energy Reports, 7, 123-130.
[13]. Smith, A., & Jones, B. (2022). Supply Chain Disruptions in the Automotive Industry: Implications for Electric Vehicle Production. Journal of Supply Chain Management, 58(4), 45-60.
[14]. Li, X., Wang, Z., & Zhang, Q. (2019). The Role of Government Policies in Promoting Electric Vehicle Adoption: Evidence from China. Environmental Science & Policy, 95, 185-192.