


1. Introduction
Us Treasury bonds have long been regarded as an asset without default risk, and have the unique attribute of maintaining the highest liquidity in the world for a long time, which plays a very important role in the US and global financial system. The breadth and diversity of this market, which brings together so many investors,provide the necessary preconditions for the low and stable price of U.S. Treasury securities. On top of that, Treasurys exhibit a high degree of liquidity.High liquidity means that investors can buy and sell easily and quickly without having a significant impact on the price and volume of the transaction.However, the rise in liquidity risk indirectly indicates that the above trading conditions are difficult to achieve.
Since 2008, the US Treasury market has become much less resilient, but liquidity risk has increased. In particular, after the impact of the COVID-19 pandemic in 2020,the Federal Reserve's monetary policy tightening in 2022, followed by regional bank failures in 2023, all of which put the flow of US Treasury bonds under unprecedented pressure. These phenomena have prompted a broader and deeper exploration of the changes in US Treasury liquidity and their causes.
2. An overview of the development of US Treasury bond market
2.1. Market size
In the United States federal government debt, debt held by the public (excluding those held by government agencies) is market-traded Treasury securities that have a significant impact on market liquidity. This paper will also focus on this part of the Treasury debt.
Over the past decade or so, the public debt of the US federal government (referred to as "US debt") has shown an obvious growth trend. After the financial crisis in 2008, US debt soared from $5.2 trillion to $17.3 trillion by the end of 2019, and its share of GDP rose from 36% to 79%[1]. After the COVID-19 pandemic, the US debt soared to $25.58 trillion in the second quarter of 2023, accounting for 95% of GDP. According to the Congressional Budget Office (CBO), the US debt will continue to grow in the next ten years, and it is expected to reach 4.676 billion US dollars in 2033, accounting for 118.9% of GDP. Interest expense will also rise from 2.5% of GDP in 2023 to 3.7% in 2033, which may exceed the critical value of debt sustainability.
2.2. Market structure
The US bond market includes three sub-markets: spot, repo and futures, of which the spot market plays a crucial role and occupies a core position. Primary dealers, or brokers, are the main participants in this market. They need to be registered with the New York Fed and conduct transactions with the Fed. The transactions involve the full range of spot, repo and futures business of Treasury bonds. These dealers not only bid on prices in the primary market, but also make markets and provide trading information in the secondary market. They hold positions for a variety of purposes, including but not limited to meeting clients' liquidity needs, hedging risk, participating in Treasury auctions and the Federal Reserve's open market operations.
The liquidity of the physical Treasury market is largely dependent on the balance sheets and market-making activities of primary dealers. When there are few buyers, primary dealers maintain liquidity in the secondary market by increasing their holdings of Treasuries. The secondary market can be subdivided into two areas: first, interdealer transactions involving intermediaries such as dealers and main trading companies; The second is the dealer-client transaction, where the client group is more extensive than the former, such as asset management companies, pension funds, insurance companies and so on. Trading volumes in these two areas are basically flat. Old government bonds typically outnumber new issues in dealer-client transactions, most of which do not take place through central clearing.
In the U.S. repo market, dealers' primary role is to provide liquid funds to clients through pledged financing transactions. The market is characterized by high leverage and high-frequency trading[2], but these characteristics can exacerbate liquidity pressures in times of market volatility.
In the US Treasury futures market, traders mainly hedge market risks, which has relatively little impact on the overall market liquidity.
3. Primary market liquidity analysis
Primary market liquidity is a measure of the matching between demand and supply in the market, involving investor participation and auction bidding prices. The primary market trading of U.S. Treasury securities plays a crucial role in the pricing and stability of Treasury securities, thus affecting the overall supply, demand and liquidity of the market.
3.1. Primary market liquidity changes of US Treasury bonds are the main drivers
The liquidity of the US Treasury bond primary market is affected by economic fundamentals, policies, supply and demand relations and other factors. From this point of view, the relationship between supply and demand is a more important reference factor in assessing the state of the market, even more valuable than the amount of supply itself. Supply can be estimated from the U.S. Treasury's issuance schedule and actual issuance in previous years. As the debt ceiling has been raised, so has the growth in issuance. The Treasury expects to issue $776 billion in debt by the end of 2023 and $816 billion in the first quarter of 2024[3].
However, it is undeniable that there are still many difficulties in assessing and forecasting the demand for US Treasuries. At present, there are three key factors regarding the demand.
First, the total amount of US debt held by foreign investors is still on a growing trend, but their holdings as a percentage of outstanding US debt have fallen from 40 percent in 2014 to about 30 per cent in 2023. In the process, the monthly net increase of official institutions turned negative in June 2023, while the net increase of the private sector continued to rise.
Second, the outstanding holdings of government bonds by the banking sector declined. After the Federal Reserve introduced the Supplementary Leverage ratio rule in 2015, banks' willingness to hold debt weakened as their holdings were included in the calculation of the leverage ratio. From January 2015 to December 2019, the average monthly growth rate of outstanding bank Treasuries slowed from 9.3 per cent to 7.5 percent year-on-year. The Fed suspended the SLR during the pandemic, but then resumed it in March 2021. By August 2023, this growth rate has dropped significantly to an average of -4.3%, a historically rare decline.
Finally, the Fed plans to continue reducing its Treasury holdings. This kind of buying and selling of Treasury securities is part of monetary policy and is seen as an instrument of monetary policy and does not represent real market demand. During the pandemic, the Fed dramatically increased its holdings of Treasuries through quantitative easing, reaching an all-time high of 26 per cent at one point. However, with the plan to shrink the balance sheet, this proportion has fallen to 19% in the third quarter of 2023, and it is expected to further decline to below 10% in the future.
Overall, both the supply and demand sides of the equation face a dangerous environment that could lead to imbalances. In particular, Fitch's downgrade of the long-term foreign currency debt rating of the United States in August 2023 and the intensification of the global de-dollarization trend have increased uncertainty about future global demand for US Treasuries.
3.2. Evolution and trends of liquidity in the US Treasury primary market
3.2.1. Volatility Indicators of Treasury Bonds
The MOVE Index, compiled by Bank of America Merrill Lynch, is a key indicator to gauge investor sentiment and predict potential price volatility in U.S. Treasuries, with particular attention paid to primary market investors. Since the outbreak of the epidemic, with the increasing uncertainty of US fiscal and monetary policies and Treasury bond yields, the MOVE index has risen rapidly from a historical average of about 86 to more than 120, setting a record second only to the 2008 crisis. Data analysis shows that there is a negative long-term correlation between the MOVE index and the monetary policy uncertainty index of -0.4. In particular, since the Fed implemented QE to purchase Treasury bonds after the 2008 crisis, the long-term negative correlation between the MOVE index and the Fed's Treasury holdings has deepened to -0.54. The Fed's tapering of its Treasury holdings could weaken the resilience of the primary Treasury market, making it more vulnerable to extraordinary events, and could transmit this effect to the secondary market.
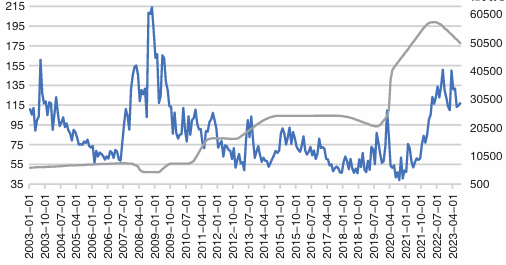
Figure 1: Us Treasury Volatility Index MOVE and Federal Reserve Treasury holdings monthly mean trend.
The left axis is the MOVE index, and the right axis is the monthly average of Federal Reserve Treasury holdings.
3.2.2. Treasury supply and demand indicators
The bidding multiple of national debt is a key indicator, which connects the supply and demand sides of national debt. This ratio can be determined by comparing the amount of money competing bidders bid in a Treasury auction with the amount the Treasury issues. When the bid multiple is high or rising, it reflects an increase in demand relative to supply, thus indicating higher liquidity; On the contrary, it indicates a lack of demand and reduced liquidity. In general, the threshold for the multiple of Treasury bids is set at 2. Looking back at the historical data, it is not difficult to find that there is a long-term negative correlation between the bid multiple of Treasury bonds and the MOVE index, especially the correlation between the bid multiple of 2-year Treasury bonds and the MOVE index reaches -0.5. This finding indicates that market volatility is the main factor affecting the change of auction demand and liquidity in the primary market[4].
Since 2020, the US Treasury market has experienced multiple shocks, such as market instability in the early stage of the epidemic, the start of the Federal Reserve's tightening policy, regional bank failures, and uncertainty caused by debt ceiling negotiations. Despite this, the monthly average of the bid multiple of US Treasuries with major maturities has remained above 2 even when it was below 2 on certain trading days, indicating that the primary market still maintains strong demand and high liquidity. During market turmoil, the Fed intervened in the primary market through its QE strategy and stabilized the secondary market as the market maker of last resort, which played a key role in boosting demand for US Treasuries and maintaining market stability.
4. Secondary market liquidity analysis
The challenges facing US Treasury liquidity are focused on the secondary market. The market is huge, with more than $600 billion in average daily volume in 2022, according to the Securities Industry and Financial Markets Association, with many participants and active trading. Its depth and breadth give US Treasuries the same high liquidity as cash. However, Treasuries are not cash, and their high liquidity can make them a priority to sell in times of market turmoil, causing them to become more volatile under liquidity pressure. For example, during the epidemic in March 2020, US Treasuries were sold in large quantities to cash out, triggering a sudden increase in selling pressure, resulting in supply-demand imbalances and price volatility. As the volume of US Treasury issuance increases, market resilience is particularly critical to maintaining high liquidity, and investors remain on high alert to changes in secondary market liquidity.
Table 1: Before and after the outbreak of the epidemic, the key maturity of US debt bidding times the average of several months.
year | 2-year Treasury bid index | 5-year Treasury bid index | 10-year Treasury bid index |
2001-2019 | 2.6 | 2.4 | 2.5 |
2020-2023 | 2.5 | 2.3 | 2.2 |
4.1. The relationship between changes in the secondary market of US Treasury bonds and liquidity
After the financial crisis in 2008, the US Treasury market changed significantly, and these changes directly affected the trading demand. First, investor demand for Treasurys, especially shorter-dated Treasurys, rose significantly. Asset managers and money market funds have increased their exposure to Treasurys, and trading activity has become more frequent. Open-ended funds use Treasuries not only for trading and hedging but also as a liquidity buffer to raise cash quickly. Leveraged investors, in turn, leverage their Treasury investments by raising funds and may quickly sell Treasuries when market volatility intensifies. In addition, electronic and automated trading technologies are widely used, which, while improving trading efficiency, also make the secondary market more prone to volatility, especially in times of market turbulence. At the same time, the growth of electronic trading volume has also strengthened the interconnectedness among financial sub-markets, which has accelerated the dissemination of information and risks.
The ability of traders to trade is difficult to measure directly and is constrained both by the institutions' own risk appetite and by regulatory measures on capital and liquidity, such as SLR rules. In particular, the Volcker rule, implemented in 2010, although it allowed banks to conduct market-making business on their own account, it required them to provide detailed information on their trading intentions, which significantly increased transaction costs and management complexity, leading to banks' reluctance to hold large amounts of Treasuries. The Fed's research shows that since 2007, the amount of Treasury primary dealers holding each dollar of outstanding Treasuries on their balance sheets has shrunk dramatically to a quarter of what it was previously.
4.2. Evolution and trends of secondary market liquidity for US Treasury securities
4.2.1. Average daily turnover rate of Treasury bonds
The average daily turnover of Treasury bonds directly reflects the trading ability of primary dealers and the liquidity of the market. Since 2008, this indicator has experienced a sustained period of decline and has fallen to a record low of 2.77 percent by July 2023. This downward trend is mainly influenced by long-term structural factors, which, once established, are relatively stable, so it is difficult to see a significant improvement in the short term.
Table 2: Us Treasury daily turnover rate.
Time(year) | percent |
2016 | 2.6 |
2017 | 2.5 |
2018 | 2.1 |
2019 | 2 |
2020 | 1.9 |
2021 | 1.8 |
2022 | 1.8 |
2023 | 1.5 |
4.2.2. Government debt liquidity index
The Bloomberg Treasury Liquidity Index is used to assess the extent to which Treasury yields diverge from their fair value[5]. The US Securities and Exchange Commission defines the fair value of a financial asset as the exchange price that market participants can reach through orderly transactions.
Based on the high liquidity of the US Treasury market, the US Securities and Exchange Commission (SEC) classifies the fair value of US Treasuries as the level 1 fair value of assets, and directly uses it as the benchmark for pricing other assets. This is because the degree of deviation between the transaction price and the fair value can be a key indicator to evaluate the liquidity status of the asset. Further analysis shows that the national debt liquidity index is mainly affected by economic policies and market cyclical fluctuations, and there is a long-term correlation of 0.74 with the monthly average of the MOVE index, which reveals a close relationship between the two in the trend of change.
4.2.3. The bid-ask spread of Treasury bonds
The high liquidity of the secondary market for U.S. Treasuries is also reflected in its large daily trading volume and small bid-ask spreads. These two indicators are mainly influenced by economic policies and cyclical market fluctuations. In particular, there is a long-term correlation between the bid-ask spread of the 2-year and 10-year notes and the monthly average of the MOVE index, which is 0.55 and 0.52, respectively. Since the Treasury liquidity index and the MOVE bid-ask spread share the same primary drivers, they also show some correlation. Since the outbreak of the pandemic, the liquidity index and the bid-ask spread have shown similar trends: both rose in the early days of the pandemic and then quickly stabilised following intervention by the Federal Reserve. However, after the start of the Fed tightening cycle, and especially in the wake of debt ceiling uncertainty and regional bank failures in early 2023, both indicators have risen again.
5. Conclusion
The US Treasury bond market will still face more difficulties and challenges. In order to better deal with these problems, different subjects give different solutions.
The FSB pointed out that in order to ensure the sound operation of the US Treasury market, a series of policy measures need to be paid attention to and considered in the future, such as effectively responding to sudden increases in liquidity demand, enhancing the flexibility of liquidity supply and strengthening risk monitoring. The Securities Industry and Financial Markets Association (SIFMA) laid out four key recommendations for structural reform of the U.S. Treasury market. First, push for greater use of central clearing. Research by the New York Fed suggests that central netting can reduce settlement exposure by up to 70 per cent, helping to ease liquidity pressures and reduce settlement failures. Second, it is proposed to build an all-to-all trading platform to encourage more diversified trading and improve market liquidity and price transparency by integrating market segmentation among dealers, clients and dealers. Third, it proposes to expand access to the Fed's long-term repo facility (SRF) and push for banking regulatory reforms, such as adjusting SLR rules, to support market stability. Finally, enhance the transparency of data and information disclosure of market participants to enhance market efficiency and reduce risks. These measures are essential for the healthy functioning of the US Treasury market.
In short, the core goal of the reform of the US Treasury market is to strengthen the elasticity of market liquidity and enhance the market-making ability of traders as the scale of market supply and demand grows, so as to meet the growing trading demand. When weighing the costs and benefits of reform, the primary focus should be on the achievement of these two objectives.
References
[1]. Financial Stability Board (FSB). Liquidity in Core Government Bond Markets[R/OL]. (2022-10-20)[2023-11-22].https://www.fsb.org/2022/10/liquidity-in-core-government-bond-markets/.
[2]. Goyenko, R., Subrahmanyam, A., & Ukhov, A. (2011). The term structure of bond market liquidity and its implications for expected bond returns. Journal of Financial and Quantitative Analysis, 46(1), 111-139.
[3]. Nguyen, G., Engle, R., Fleming, M., & Ghysels, E. (2020). Liquidity and volatility in the US Treasury market. Journal of Econometrics, 217(2), 207-229.
[4]. Jiang, G. J., Lo, I., & Verdelhan, A. (2011). Information shocks, liquidity shocks, jumps, and price discovery: Evidence from the US Treasury market. Journal of Financial and Quantitative Analysis, 46(2), 527-551.
[5]. Lu Xiaoming.(2023). Research on the liquidity change trend of US Treasury bond market. Bonds (12),33-38.
Cite this article
Chen,M. (2024). A Study on the Evolution and Driving Factors of US Treasury Bond Market Liquidity. Advances in Economics, Management and Political Sciences,124,212-218.
Data availability
The datasets used and/or analyzed during the current study will be available from the authors upon reasonable request.
Disclaimer/Publisher's Note
The statements, opinions and data contained in all publications are solely those of the individual author(s) and contributor(s) and not of EWA Publishing and/or the editor(s). EWA Publishing and/or the editor(s) disclaim responsibility for any injury to people or property resulting from any ideas, methods, instructions or products referred to in the content.
About volume
Volume title: Proceedings of the 8th International Conference on Economic Management and Green Development
© 2024 by the author(s). Licensee EWA Publishing, Oxford, UK. This article is an open access article distributed under the terms and
conditions of the Creative Commons Attribution (CC BY) license. Authors who
publish this series agree to the following terms:
1. Authors retain copyright and grant the series right of first publication with the work simultaneously licensed under a Creative Commons
Attribution License that allows others to share the work with an acknowledgment of the work's authorship and initial publication in this
series.
2. Authors are able to enter into separate, additional contractual arrangements for the non-exclusive distribution of the series's published
version of the work (e.g., post it to an institutional repository or publish it in a book), with an acknowledgment of its initial
publication in this series.
3. Authors are permitted and encouraged to post their work online (e.g., in institutional repositories or on their website) prior to and
during the submission process, as it can lead to productive exchanges, as well as earlier and greater citation of published work (See
Open access policy for details).
References
[1]. Financial Stability Board (FSB). Liquidity in Core Government Bond Markets[R/OL]. (2022-10-20)[2023-11-22].https://www.fsb.org/2022/10/liquidity-in-core-government-bond-markets/.
[2]. Goyenko, R., Subrahmanyam, A., & Ukhov, A. (2011). The term structure of bond market liquidity and its implications for expected bond returns. Journal of Financial and Quantitative Analysis, 46(1), 111-139.
[3]. Nguyen, G., Engle, R., Fleming, M., & Ghysels, E. (2020). Liquidity and volatility in the US Treasury market. Journal of Econometrics, 217(2), 207-229.
[4]. Jiang, G. J., Lo, I., & Verdelhan, A. (2011). Information shocks, liquidity shocks, jumps, and price discovery: Evidence from the US Treasury market. Journal of Financial and Quantitative Analysis, 46(2), 527-551.
[5]. Lu Xiaoming.(2023). Research on the liquidity change trend of US Treasury bond market. Bonds (12),33-38.