


1. Introduction
In the era of globalization and digitalization, the banking industry, as the core of the international financial system, plays a crucial role in economic development through its stability and efficiency. However, banks inevitably face various risks during their operations. These risks include traditional ones like credit risk, market risk, and operational risk, as well as emerging risks such as technological risk, legal and compliance risk, and strategic risk [1]. The complexity and challenges of bank risk management have significantly increased due to rapid changes in financial markets, the continuous innovation of financial instruments, and heightened global economic uncertainty. As noted by Huang et al., the economic recession triggered by the Covid-19 pandemic brought unprecedented uncertainty to the global banking system. Banks are confronted with critical market challenges driven by uncertain monetary policies, deteriorating credit quality, and regulatory and compliance pressures. These challenges highlight the importance of understanding the evolving role of financial intermediaries in facilitating efficient capital allocation and economic development [1].
Traditional bank risk management frameworks rely on historical data and linear models to predict and assess risk. However, these methods often fail to accurately capture the nonlinear relationships and dynamic changes within complex financial networks. For example, Dicuonzo et al. discussed the role of big data analytics (BDA) in the banking sector, emphasizing the importance of using more sophisticated algorithms to query large heterogeneous data sets [2]. This is crucial for enhancing the integrity of enterprise assets and improving the efficiency and effectiveness of service delivery. Through case studies, the literature also explored how small banks face technological challenges, illustrating the practical use of current big data collection and management techniques in supporting the risk management process [3]. Especially in the absence of artificial intelligence technologies, the limitations of traditional methods in handling big data are more pronounced. These limitations include slow data processing speeds, an inability to effectively identify underlying patterns in data, and a lack of in-depth understanding of complex data relationships. Therefore, finding more effective risk management methods has become a crucial issue for the banking industry.
This study explores the use of knowledge graph technology, particularly Neo4j, in bank risk management. It highlights how knowledge graphs improve risk identification, assessment, and prediction, offering a new solution for managing risks in the increasingly complex financial market.
2. Literature Review
2.1. Types of Risks in Banking
Researchers have identified and thoroughly analyzed various types of risks faced by the banking industry, including but not limited to credit risk, market risk, and operational risk. These risks arise from a range of internal and external factors such as changes in the economic environment, market price fluctuations, borrower defaults, internal process failures, human errors, and system instabilities [4-5]. Operational risk, as noted by Grdošić, includes the risk of loss resulting from inadequate or failed internal processes, human errors, poor information system implementation, or potential external events. Legal risk is often encompassed within the definition of operational risk. The literature provides tools for identifying and assessing these risks, capital requirements for operational risk, and the role of regulators in managing these types of risks [4]. Banks have developed various theories and methods to effectively manage these risks, aiming to minimize potential losses and ensure the stability and security of the banking system [4].
2.2. Existing Risk Management Methods
Over time, bank risk management methods have evolved. Early methods relied on traditional statistical techniques such as variance analysis and regression models, which provided powerful tools for risk assessment at the time. However, as technology advanced and data volumes surged, the limitations of traditional methods in handling large-scale complex data became apparent. Peng, Lin, and Wu proposed a hybrid approach based on big data characteristics and framework technology to improve the accuracy and timeliness of financial risk prediction in banking systems [6]. This work highlighted the potential shortcomings of traditional models when facing big data and suggested improvements. Traditional methods often assume data follows a specific distribution or has linear relationships, which can be overly simplistic in real-world data analysis. Complex and nonlinear relationships are difficult to express and capture in traditional models, limiting their application in complex financial risk management scenarios [6]. In risk prediction, traditional statistical methods often rely on historical data to forecast future risks, but these methods may not accurately predict future uncertainties and unforeseen events, leading to insufficient risk prediction accuracy [7]. Lê and Viviani compared the accuracy of traditional statistical techniques and machine learning techniques in predicting bank failures, finding that machine learning methods demonstrated higher accuracy when processing 31 financial ratio data extracted from bank financial reports [8]. This finding highlights the limitations of traditional methods in handling large and complex data sets. Consequently, the banking industry began exploring new methods to enhance the efficiency and accuracy of risk management.
2.3. Methods for Risk Management Using Knowledge Graphs
Knowledge graphs, as an emerging information organization and processing technology, provide richer contextual and semantic information by constructing graphical representations of entities and their interrelationships. In the banking industry, knowledge graphs can help banks better understand customer needs, assess credit risks, monitor market dynamics, and detect fraudulent activities. Yan and Liu emphasized the need to identify correlations and attack patterns from distributed and large volumes of heterogeneous data due to the rapid growth of cybersecurity data and increased cybersecurity risks [9]. They proposed constructing a cybersecurity knowledge graph to integrate this information for in-depth correlation analysis, better grasping the security status of cyberspace, and assisting decision-making processes [9]. Furthermore, Jia et al. proposed a cybersecurity knowledge base and inference rules based on a quintuple model, using machine learning to extract entities and construct ontologies, obtaining a cybersecurity knowledge base [10]. They used a path ranking algorithm to derive new rules and trained extractors using the Stanford Named Entity Recognizer (NER) to extract useful information. This approach not only improved the efficiency of cybersecurity knowledge extraction but also provided new tools and methods for future cybersecurity research and practice [10]. By combining knowledge graphs with advanced technologies such as machine learning, banks can achieve more precise and dynamic risk management. For example, in financial information security strategies, knowledge graphs can be applied to explore their role in financial information security risk control, leveraging their knowledge integration advantages to provide data analysis and knowledge inference support for threat modeling, risk analysis, and attack reasoning in cybersecurity, thereby providing foundational knowledge for screening potential information security risks [11].
3. Constructing Bank Knowledge Graphs Using Neo4j
3.1. Graph Model Design
3.1.1. Nodes
The design of the graph model is a crucial step in constructing the knowledge graph. It involves defining entity types, relationship types, and attributes. Entity types typically include customers, accounts, transactions, and products. Relationship types describe the various connections between entities, such as a customer "owns" an account or "initiates" a transaction. Attributes provide more descriptive information, like a customer's age or an account's creation date.
When designing the graph model, it's essential to consider the bank's business processes and data structure comprehensively to ensure the model accurately reflects the relationships between business entities. For instance, a transaction entity might be linked to both a customer entity and an account entity, indicating that the transaction was completed by the customer through the account. A well-designed graph model allows the bank to organize and query data more effectively, uncovering potential links between data points.
Nodes_Entities (Entity Nodes) Worksheet: Defines the main entities in the database, such as "Banking Entity," "Investment Projects," "Use of Funds," etc. Each entity has its unique type and attribute set, used to record information specific to each entity.
Nodes_Transactions (Transaction Nodes) Worksheet: Focuses on financial activities, such as transactions related to the balance sheet, providing detailed information on each transaction, including type and amount.
4. Constructing a Bank Knowledge Graph Based on Neo4j
This chapter aims to detail the experimental design of this study, including dataset preparation, experimental environment configuration, and the process of importing data into Neo4j. By selecting HSBC as a case study, this research intends to construct a bank knowledge graph model using Neo4j to perform risk prediction.
4.1. Case Background
This study selects HSBC as the case study bank due to its global business network, complex structure, high transparency, and extensive risk management experience, as detailed in its 2023 Annual Report. Data extracted from the report includes banking entities, investment projects, fund usage, transaction types, customer categories, SDGs, and ESG indicators. This comprehensive dataset forms the basis for constructing a Neo4j-based knowledge graph model to enhance risk prediction in financial risk management.
4.2. Data Import into Neo4j
Using IntelliJ IDEA software and prepared CSV data files through Java and Cypher languages to import data into Neo4j is a critical step in constructing the graph model. This study adopts the following steps to complete data import:
4.2.1. Node Import
In a graph database, nodes represent entities and are the basic elements for storing data. Properly importing nodes is crucial for the effective operation of the Neo4j database. The following details how to use Java code to import nodes into the Neo4j database.
Data Preparation: First, determine the data source and the required data format for import. The data may come from CSV files, SQL databases, APIs, or other formats.
Data Preprocessing: Preprocess the CSV files, including checking data integrity, formatting date and numerical fields, etc., to ensure data accuracy and consistency.
Define Graph Model: Design the graph data model based on the characteristics of the dataset and research objectives, specifying node types, properties, and relationships between nodes.
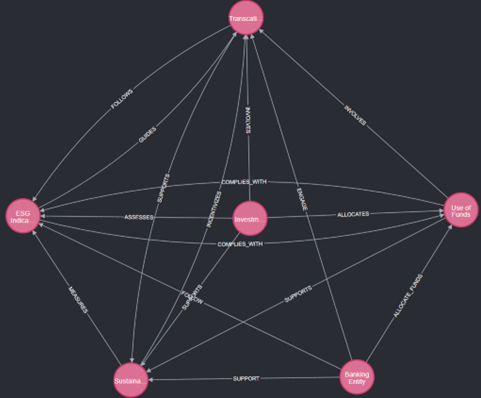
Figure 1: Viewing Results After Node and Relationship Import.
5. Empirical Analysis
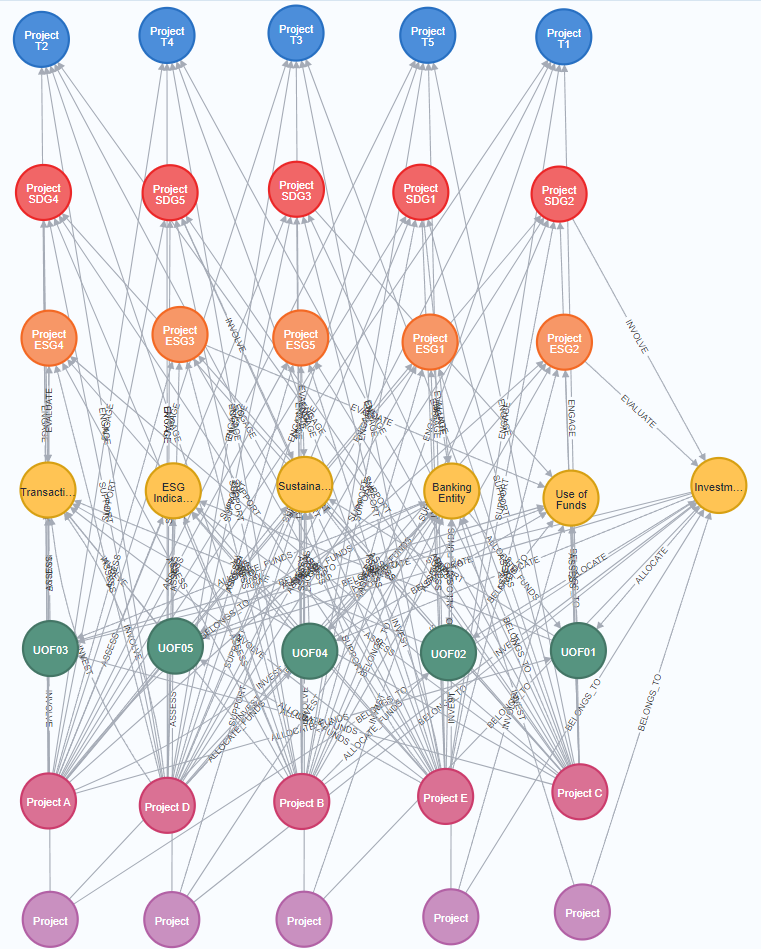
Figure 2: Visualization of Relationships in Neo4j After Importing Selected Data from the 2023 HSBC Report.
5.1. Analysis Method II: Relationship Between Two Projects
In graph database analysis, understanding the relationship between two specific nodes is crucial. This helps identify direct or indirect connections between nodes, and analyze their potential impacts and risks. Through this method, we can systematically assess interactions between nodes, uncover potential collaboration opportunities or conflict points, and provide data support for project management, resource allocation, and risk prediction. Below is the method for querying the relationship between two specific nodes (such as project nodes) and its description.
5.1.1. Method Description
Using Cypher queries, we can find relationships between two specific nodes (e.g., two project nodes). Specifically, we will look for direct or indirect relationships between these nodes and describe the types and nature of these relationships in detail. This method helps reveal mutual influences and potential risks between projects, providing a foundation for further decision-making and risk assessment. This method can answer the following key questions: Is there a relationship between Node 1 and Node 2? If so, what are the specific types of these relationships? How do these relationships affect the interactions between the two nodes? By identifying these relationships, we can understand the interaction between the two nodes and evaluate the risks or opportunities that these interactions may bring. This analysis method can be used in various scenarios, such as resource allocation in project management, risk assessment in investment decisions, and collaboration analysis in organizational structures.
5.1.2. Description of Cypher Query Implementation
For example, in the Funds Use Project, let's consider the "Strategic Acquisition to Support Global Expansion and Service Enhancement" (UOF02) project and the HSBC Bank plc (Project B) from the Banking Entity Project. Suppose we want to find and analyze the relationship between these two project nodes. By analyzing the relationship between UOF02 and HSBC Bank plc (Project B), we can understand whether there is an association between these projects and the specific types and nature of these associations. This analysis helps reveal the mutual influences and potential risks between projects, thereby supporting project management and decision-making.
After executing the code, the visualization of the returned results is shown in:
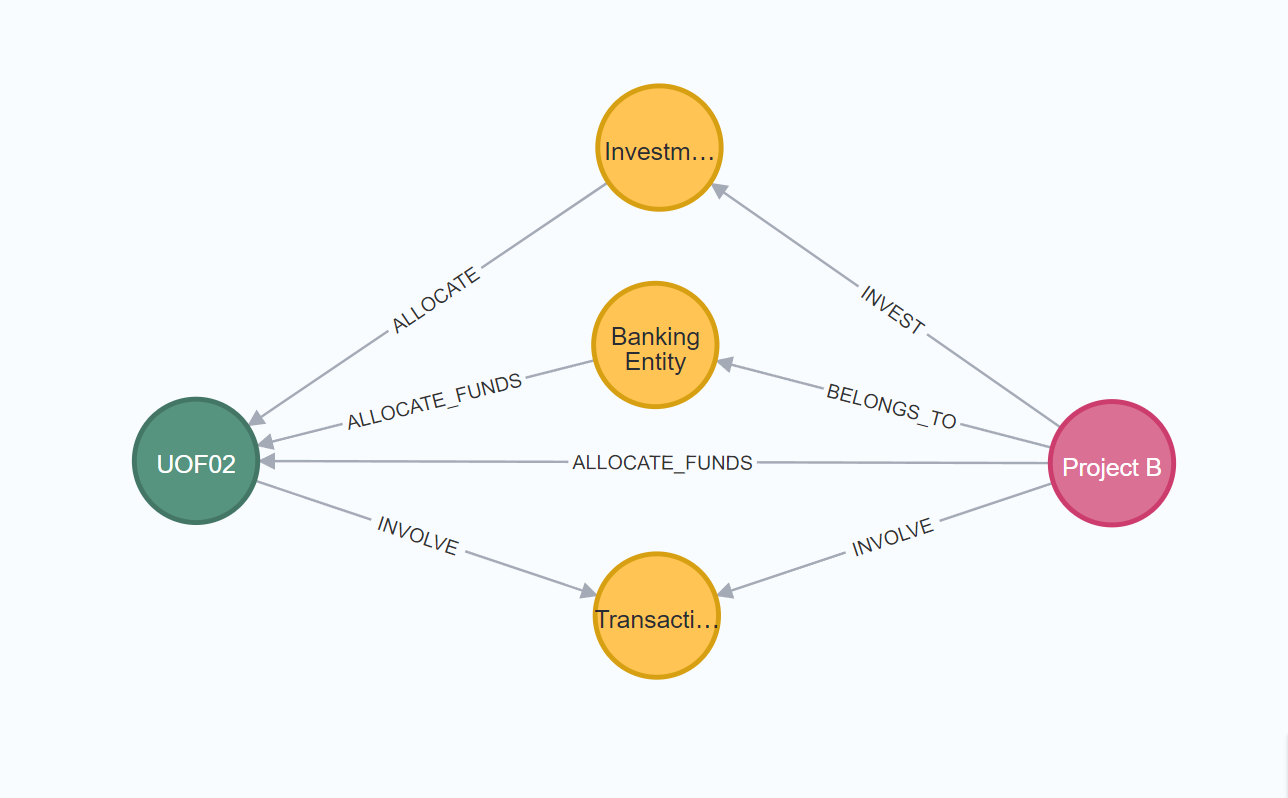
Figure 3: Visualization of the relationship between two projects.
In Figure 3, UOF02 represents the Funds Use Project, specifically the "Strategic Acquisition to Support Global Expansion and Service Enhancement"; Project B is a specific project in the Banking Entity Project; Investment represents the investment behavior node; Banking Entity represents the banking entity node; Transaction Type represents the transaction type node. The specific relationship analysis is as follows: There is an ALLOCATE relationship between UOF02 and the Investment node, indicating that the UOF02 project allocates funds to the Investment project. There is an ALLOCATE_FUNDS relationship between UOF02 and the Banking Entity node, indicating that the UOF02 project allocates funds to the banking entity. There is an INVOLVE relationship between UOF02 and the Transaction Type node, indicating that the UOF02 project involves specific transaction types. There is an INVEST relationship between the Investment and Project B nodes, indicating that the Investment project invests funds in Project B. There is a BELONGS_TO relationship between the Banking Entity and Project B nodes, indicating that Project B belongs to the banking entity, and an ALLOCATE_FUNDS relationship, indicating that the banking entity allocates funds to Project B. Finally, there is an INVOLVE relationship between the Transaction Type and Project B nodes, indicating that Project B involves specific transaction types.
5.1.3. Risk Prediction Using Method II
By analyzing the above relationships, we can perform risk predictions in the following areas. Firstly, through the ALLOCATE and ALLOCATE_FUNDS relationships, we can track the flow of funds from the UOF02 project to the Investment project and the banking entity, and then to Project B. Identifying these key paths helps predict potential risk points in the fund flow process. Secondly, analyzing the ALLOCATE relationship between the UOF02 project and the Investment project can assess the fund allocation situation from the UOF02 project to the Investment project. If the Investment project is at risk, the fund security of the UOF02 project may also be affected. Furthermore, analyzing the INVEST relationship between the Investment project and Project B can further evaluate the fund flow and risk of the Investment project.
By analyzing the ALLOCATE_FUNDS relationship between the UOF02 project and the Banking Entity, and the ALLOCATE_FUNDS and BELONGS_TO relationships between the Banking Entity and Project B, we can assess the risk in fund allocation and management within the banking entity. If the banking entity's fund management is poor, it may affect the fund security of Project B. Meanwhile, by analyzing the INVOLVE relationship between the UOF02 project and the Transaction Type, and the INVOLVE relationship between the Transaction Type and Project B, we can evaluate the risks of these transaction types. Understanding the risk characteristics of transaction types helps predict and manage potential risks in these trading activities. Comprehensive analysis of all relationships between UOF02, Investment, Banking Entity, Transaction Type, and Project B allows for a comprehensive assessment of the risks of the entire Funds Use Project. This includes all aspects of fund flow, specific investment project risks, transaction activity risks, and banking entity risks.
6. Conclusion
This paper explores the application of knowledge graph technology in bank risk management, particularly focusing on the construction and analysis methods based on Neo4j. The study elaborates on the concept and characteristics of knowledge graphs and their application scenarios in the banking industry. It demonstrates how knowledge graph technology can be utilized to enhance banks' capabilities in risk identification, assessment, and prediction, thereby improving the efficiency and effectiveness of risk management.
The key findings are as follows: Knowledge graphs have great potential in bank risk management, effectively building complex relationship networks and enhancing the comprehensiveness and accuracy of risk management. Neo4j graph databases have significant advantages in constructing knowledge graphs, with their efficient data mining capabilities and flexible query functions, supporting banks in rapidly conducting data queries and relationship analysis. The case study of HSBC Bank validates the practical application of knowledge graphs in risk management, demonstrating the advantages of graph database technology in improving risk prediction and management capabilities. This paper proposes two analysis methods: detailed analysis by fixing a specific node and querying the relationship between two specific nodes, helping banks better understand the complex relationships between data, conduct precise risk predictions, and support decision-making.
References
[1]. Huang, W., Molyneux, P., Ongena, S., & Xie, R. “The new challenges of global banking and finance.” The European Journal of Finance, 29, 693 - 699., 2023, https://doi.org/10.1080/1351847X.2023.2200145.
[2]. Dicuonzo, G., Galeone, G., Zappimbulso, E., & Dell’Atti, V. (2019). “Risk Management 4.0: The Role of Big Data Analytics in the Bank Sector | International Journal of Economics and Financial Issues.” EconJournals.com, 24 October 2019, https://www.econjournals.com/index.php/ijefi/article/view/8556. Accessed 14 March 2024.
[3]. “Victor I. Chang et al. "Scientific Data Analysis using Neo4j."” (2022): 75-84., https://doi.org/10.5220/0011036700003206.
[4]. Grdošić, L. “Operational Risks in the Banking Industry. Banking & Insurance eJournal.” (2016), https://papers.ssrn.com/sol3/papers.cfm?abstract_id=3282341.
[5]. I. I.Vasiliev et al. "Operational Risk Management in A Commercial Bank." International Journal of Engineering & Technology (2018). https://doi.org/10.14419/IJET.V7I4.36.24130.
[6]. Hua Peng et al. "Bank Financial Risk Prediction Model Based on Big Data." Scientific Programming (2022). https://doi.org/10.1155/2022/3398545.
[7]. N. Parfentseva et al. "Simulating Financial Risks on the Basis of Statistical Assessment Methods." Scientific Bulletin of the National Academy of Statistics, Accounting and Audit (2022). https://doi.org/10.31767/nasoa.1-2-2022.02.
[8]. H. H. Lê et al. "Predicting bank failure: An improvement by implementing machine learning approach on classical financial ratios." Research in International Business and Finance, 44 (2017): 16-25. https://doi.org/10.1016/J.RIBAF.2017.07.104.
[9]. Zhihao Yan et al. "A Review on Application of Knowledge Graph in Cybersecurity." 2020 International Signal Processing, Communications and Engineering Management Conference (ISPCEM) (2020): 240-243. https://doi.org/10.1109/ISPCEM52197.2020.00055.
[10]. Yan Jia et al. "A Practical Approach to Constructing a Knowledge Graph for Cybersecurity." Engineering, 4 (2018): 53-60. https://doi.org/10.1016/J.ENG.2018.01.004.
[11]. Xin Ye et al. “"Application of Knowledge Graph in Financial Information Security Strategy."” Proceedings of the 8th International Conference on Cyber Security and Information Engineering, (2023), https://doi.org/10.1145/3617184.3630130.
Cite this article
Zhang,H. (2024). Research on the Application of Knowledge Graphs in Bank Risk Management. Advances in Economics, Management and Political Sciences,111,62-69.
Data availability
The datasets used and/or analyzed during the current study will be available from the authors upon reasonable request.
Disclaimer/Publisher's Note
The statements, opinions and data contained in all publications are solely those of the individual author(s) and contributor(s) and not of EWA Publishing and/or the editor(s). EWA Publishing and/or the editor(s) disclaim responsibility for any injury to people or property resulting from any ideas, methods, instructions or products referred to in the content.
About volume
Volume title: Proceedings of the 8th International Conference on Economic Management and Green Development
© 2024 by the author(s). Licensee EWA Publishing, Oxford, UK. This article is an open access article distributed under the terms and
conditions of the Creative Commons Attribution (CC BY) license. Authors who
publish this series agree to the following terms:
1. Authors retain copyright and grant the series right of first publication with the work simultaneously licensed under a Creative Commons
Attribution License that allows others to share the work with an acknowledgment of the work's authorship and initial publication in this
series.
2. Authors are able to enter into separate, additional contractual arrangements for the non-exclusive distribution of the series's published
version of the work (e.g., post it to an institutional repository or publish it in a book), with an acknowledgment of its initial
publication in this series.
3. Authors are permitted and encouraged to post their work online (e.g., in institutional repositories or on their website) prior to and
during the submission process, as it can lead to productive exchanges, as well as earlier and greater citation of published work (See
Open access policy for details).
References
[1]. Huang, W., Molyneux, P., Ongena, S., & Xie, R. “The new challenges of global banking and finance.” The European Journal of Finance, 29, 693 - 699., 2023, https://doi.org/10.1080/1351847X.2023.2200145.
[2]. Dicuonzo, G., Galeone, G., Zappimbulso, E., & Dell’Atti, V. (2019). “Risk Management 4.0: The Role of Big Data Analytics in the Bank Sector | International Journal of Economics and Financial Issues.” EconJournals.com, 24 October 2019, https://www.econjournals.com/index.php/ijefi/article/view/8556. Accessed 14 March 2024.
[3]. “Victor I. Chang et al. "Scientific Data Analysis using Neo4j."” (2022): 75-84., https://doi.org/10.5220/0011036700003206.
[4]. Grdošić, L. “Operational Risks in the Banking Industry. Banking & Insurance eJournal.” (2016), https://papers.ssrn.com/sol3/papers.cfm?abstract_id=3282341.
[5]. I. I.Vasiliev et al. "Operational Risk Management in A Commercial Bank." International Journal of Engineering & Technology (2018). https://doi.org/10.14419/IJET.V7I4.36.24130.
[6]. Hua Peng et al. "Bank Financial Risk Prediction Model Based on Big Data." Scientific Programming (2022). https://doi.org/10.1155/2022/3398545.
[7]. N. Parfentseva et al. "Simulating Financial Risks on the Basis of Statistical Assessment Methods." Scientific Bulletin of the National Academy of Statistics, Accounting and Audit (2022). https://doi.org/10.31767/nasoa.1-2-2022.02.
[8]. H. H. Lê et al. "Predicting bank failure: An improvement by implementing machine learning approach on classical financial ratios." Research in International Business and Finance, 44 (2017): 16-25. https://doi.org/10.1016/J.RIBAF.2017.07.104.
[9]. Zhihao Yan et al. "A Review on Application of Knowledge Graph in Cybersecurity." 2020 International Signal Processing, Communications and Engineering Management Conference (ISPCEM) (2020): 240-243. https://doi.org/10.1109/ISPCEM52197.2020.00055.
[10]. Yan Jia et al. "A Practical Approach to Constructing a Knowledge Graph for Cybersecurity." Engineering, 4 (2018): 53-60. https://doi.org/10.1016/J.ENG.2018.01.004.
[11]. Xin Ye et al. “"Application of Knowledge Graph in Financial Information Security Strategy."” Proceedings of the 8th International Conference on Cyber Security and Information Engineering, (2023), https://doi.org/10.1145/3617184.3630130.