


1. Introduction
In the context of the increasing trend of demand for economic growth after the pandemic, the role of monetary policy becomes the key to discussion. According to the research results of Rabanal and Sandri [1], monetary policy measures should remain part of the monetary policy toolkit because they can provide crucial relief if a future severe recession pushes economies to the zero lower bound.
According to the definition given by the Federal Reserve Bank at ST. LOUIS, the definition of M2 is “a measure of the U.S. money stock that includes M1 (currency and coins held by the non-bank public, checkable deposits, and travelers' checks) plus savings deposits (including money market deposit accounts), small time deposits under $100,000, and shares in retail money market mutual funds [2].” This definition made the M2 a great measurement for the level of the market situation and its future development. According to data from the World Bank, the three largest economies in the world - the United States, China, and Japan - accounted for approximately 60% of the world's total GDP. This makes them the most suitable subjects for investigation in terms of monetary policy [3].
As a result of the economic problem raised by the global pandemic, it is worth examining the behavior of the current economic system, especially the relationship between economic growth and the M2. The M2 indicates the total amount of currency on the financial market. Compared to M0, M2 included the value of the assets in a market with a much wider definition. Where M0 included the physical currency held by the central bank only, M2 also measures the value stored in other forms. Compared to M1, M2 indicated a broader definition of currency. In addition to what is included in M1, M2 also includes time deposits, savings deposits, and non-institutional money market funds. It represents a wider array of financial assets that are relatively liquid and can be readily converted into cash. This allows the measurement of the total value of assets in an economy with a greater level of accuracy.
According to research that is done on the Nigerian economy, the study found that total reserves had a significant and inverse effect on economic growth, which contradicted the previously stated apriorist expectation that they should be positive [4]. Some of the used-to-be-believed theories are under challenge from the newly discovered data. However, another study on the Chinese economy from the University of Wisconsin-Milwaukee shows a different result “Our results show that the expansion of money encourages China’s growth, while a higher real interest rate impedes China’s growth. Our results also suggest that there is asymmetric effect of exchange rate on China’s growth [5].”
These discussions lead to the question of whether macroeconomic growth is driven by monetary policy, whether there are significant differences between different countries, and where the world economy should go from here. Throughout the scope of the analysis, this paper will use the Granger causality test to compare the various relationships between Chinese GDP and M2, Japanese GDP and M2, and the US GDP and M2. This paper will also analysis these countries’ GDP and M2 from a historical and current perspective. Based on the analysis results, this paper will evaluate the current monetary policy in the three countries and recommend valid policies.
2. GDP and Monetary Policy in the US
Figure 1 displays key indicators of the American economy, including Real GDP, population, M2 value, and residuals of Real GDP. The figure illustrates consistent growth in Real GDP and population over the past 50 years, with the exception of the pandemic period.
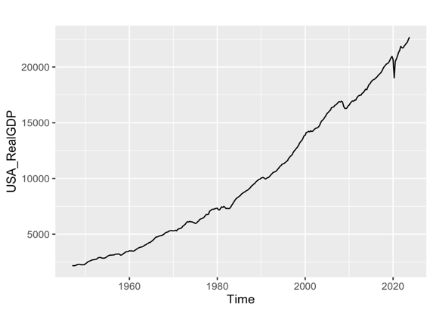
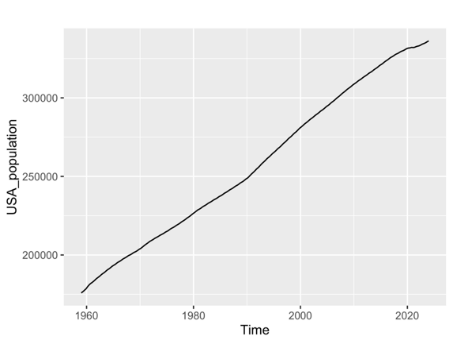
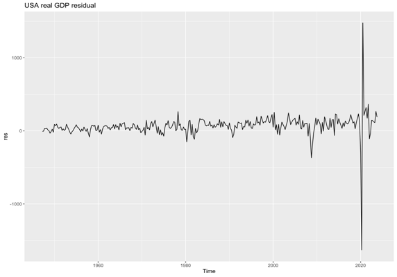
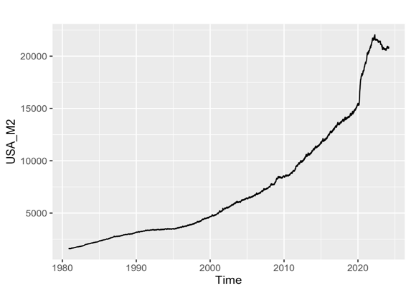
Figure 1: The economic situation of the US over time [6]
Another important feature of the US economy is its ongoing trade dispute with China. Cai (2020) discovered that [7] “This USA–China trade war initiated unilaterally by the United States is based on the trade deficit. In fact, the trade deficit originates from the economic structure of the United States itself.” As the USD serves as the primary trading currency in the globalized world, deficits occur in the USA to ensure an adequate supply of USD for trade. This also explains the rapid growth of USA M2 during and after the pandemic, as shown in Figure 1. In a report from the Congressional Research Service, it points out that “The Fed acted to promote economic and financial stability in both its monetary policy and its lender of last resort roles. Some of these actions were intended to stimulate economic activity by reducing interest rates, and others were intended to provide liquidity, so firms have access to needed funding [8].” The increase in liquidity in the economy also led to inflation, which could cause harm in the long run. Shortly after this action, the US Federal Reserve increased interest rates to curb the rapid inflation caused by the pandemic, resulting in the sharpest drop in M2 value in the US in the past 50 years.
3. GDP and Monetary Policy in China
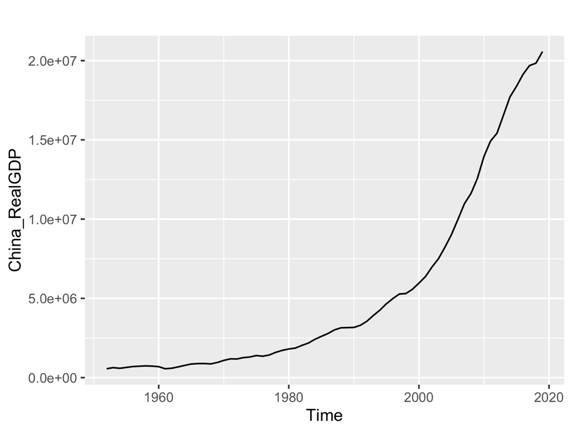
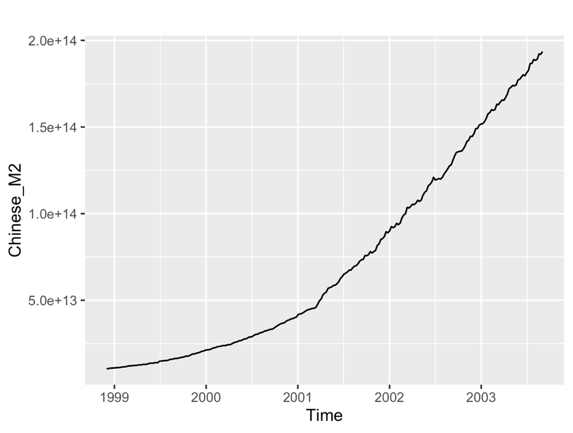
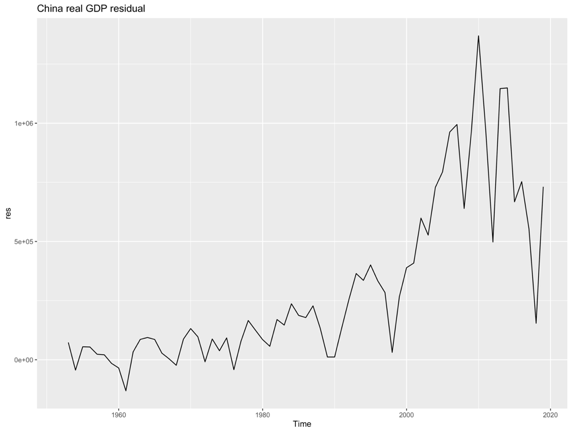
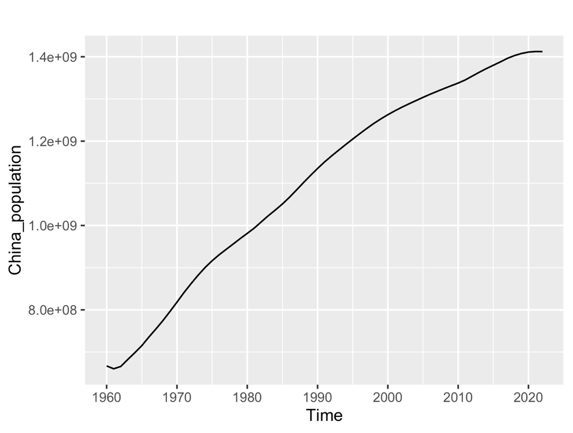
Figure 2: The economic situation of China over time [6]
Figure 2 illustrates the faster rate of growth in the Chinese economy compared to the USA. Since 2000, China's real GDP has grown exponentially, while the USA's economy has followed a different trend. Additionally, there has been a significant increase in the M2 value of the Chinese economy. The graph also shows a similar trend in the decline of GDP between the US and other countries during the pandemic period. This fragment highlights the impact of the pandemic on the global economy and emphasizes the importance of researching monetary policy. It also notes the slowing growth of China's population, as shown in the population diagram. Although the Chinese population is still growing, it is doing so at a slower rate and has recently experienced a decline, which has also affected the monetary policy of the Chinese government.
However, since 2000, the real GDP has increased significantly due to the rapid growth of the Chinese economy. This trend is very similar to the growth trend of the Chinese M2 suggesting a possible correlation between the two factors.
One major thing that is special about the Chinese economic system has been the ineffective communication between the government and the main actors from the market. According to a report from Kennedy and Wang [9], “Recent conversations with Chinese officials and a review of government documents suggest that the PBOC understands it needs to intensify and improve communication with markets to more effectively shape expectations about Chinese monetary policy and the overall direction of the economy.”
Previous study shown the policymakers in China should pay further attention to their approach when dealing with their monetary policy: “China can proceed with expanding of M2 to support its economic growth. However, China should pay attention to its M2 and GDP ratio. This is because the size of China’s M2 and GDP ratio currently is massive [10].”
4. GDP and Monetary Policy in Japan
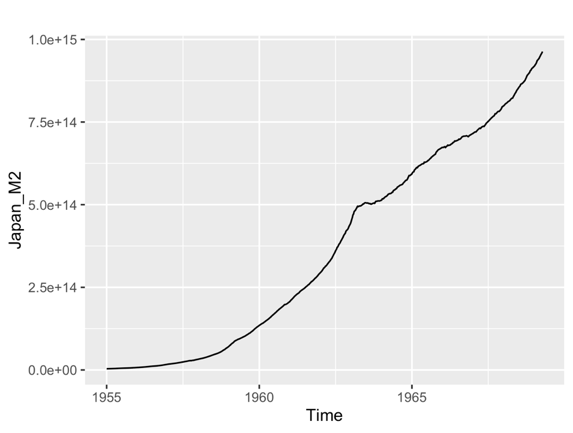
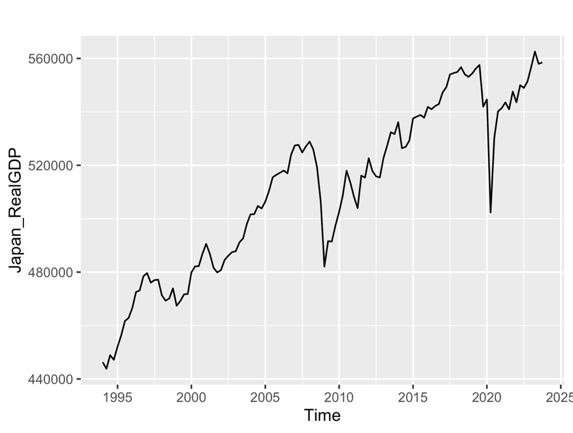
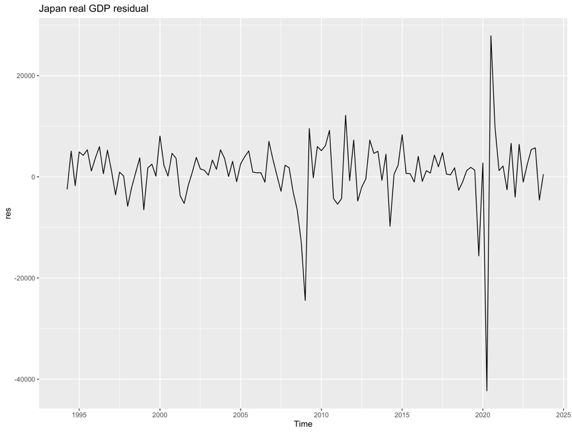
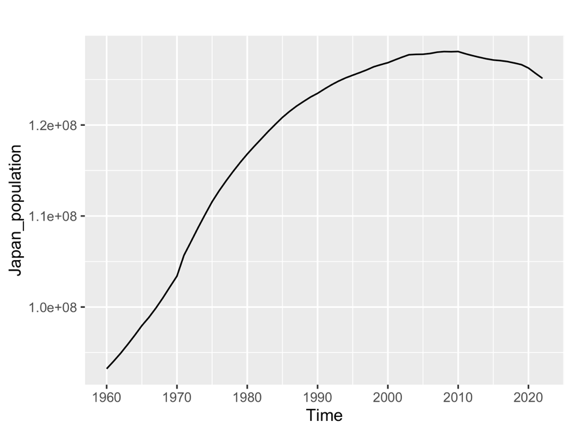
Figure 3: The economic situation of Japan over time [6]
Figure 3 illustrates the Japanese economy over the past 50 years. Like the US and Chinese economies, the Japanese economy has been heavily affected by the pandemic. However, unlike the Chinese and US economies, the 2008 economic crisis hit the Japanese economy the hardest. Despite this, the growth in the M2 value of the Japanese economy has been less affected by the current situation. The M2 diagram plot shows a consistent increase in currency supply in Japan, regardless of the country's GDP growth. However, the population trend in Japan differs from the other two countries. Since 2010, the population has plateaued and has been steadily declining. By 2010, it had already fallen to the same level as in 1990. However, it appears that the falling population has had less of an impact on the monetary supply and GDP. This suggests that there may be no correlation between the M2 value.
According to the “Outlook for Economic Activity and Prices (January 2024)” “Japan's economy is likely to continue recovering moderately for the time being, supported by factors such as the materialization of pent-up demand, although it is expected to be under downward pressure stemming from a slowdown in the pace of recovery in overseas economies. Thereafter, as a virtuous cycle from income to spending gradually intensifies, Japan's economy is projected to continue growing at a pace above its potential growth rate [11].”
5. Method Overview and Data Overview
In this section of the analysis, this paper will use Granger’s test to evaluate the correlation between the M2 value of a country and the GDP of a country. Throughout the scope of analysis, this paper used the data set from 1999 to 2024, utilizing the quarterly data from the FRED.
The Granger causality test measures the level of Granger causality between the two time series, where if the value is less than 0.1, the measure is considered significant. The hypothesis used in the Granger causality test is that M2 is the Granger cause of GDP or GDP is the Granger cause of M2.
Table 1: The statistical analysis of the M2 and GDP values
Variable | Mean | Standard deviation | Min | Max | Skewness | Kurtosis | ADF | p-value |
M2CN | 1.001 | 0.000 | 1.000 | 1.003 | 1.248 | 6.550 | -5.660 | 0.000 |
M2JP | 1.000 | 8.34E-05 | 1.000 | 1.000 | -0.090 | 2.992 | -3.234 | 0.018 |
M2US | 1.001 | 0.002 | 1.000 | 1.001 | 0.656 | 5.472 | -5.338 | 0.000 |
CNGDP | 1.002 | 0.001 | 1.000 | 1.007 | 0.268 | 3.134 | -2.847 | 0.052 |
JPGDP | 1.000 | 0.001 | 0.996 | 1.002 | -1.491 | 9.165 | -4.497 | 0.0002 |
USGDP | 1.001 | 0.0008 | 0.998 | 1.003 | -1.239 | 6.712 | -3.494 | 0.008 |
Before the datasets were tested, the data in this table were applied with a logarithmic first-order difference so they could stationarity and used in further analysis.
Table 1 shows the mean value, standard deviation, Min, Max, Skewness, Kurtosis, ADF, and p-value of M2 and GDP values used in this paper. with the Min and Max values indicating the minimum value and the maximum value. Table 1 shows both M2 and GDP have a long-term average value that is larger than 0, showing that they are always in a positive growth state.
6. Correlation Analysis Using Granger’s Method
Table 2: Granger causality test result for GDP and M2 for US
Equation Excluded | chi2 df Prob > chi2 |
M2US USGDP | 3.485 1 0.062 |
M2US ALL | 3.485 1 0.062 |
USGDP M2US | 0.193 1 0.660 |
USGDP ALL | 0.193 1 0.660 |
Table 3: Granger causality test result for GDP and M2 for China
Equation Excluded | chi2 df Prob > chi2 |
M2CN CNGDP | 0.028 1 0.867 |
M2CN ALL | 0.028 1 0.867 |
CNGDP M2CN | 3.702 1 0.054 |
CNGDP ALL | 3.702 1 0.054 |
Table 4: Granger causality test result for GDP and M2 for Japan
Equation Excluded | chi2 df Prob > chi2 |
M2JP JPGDP | 0.132 1 0.716 |
M2JP ALL | 0.132 1 0.716 |
JPGDP M2JP | 4.945 1 0.026 |
JPGDP ALL | 4.945 1 0.026 |
Table 2 shows the Granger causality test result of the US’s GDP and M2, Table 3 shows the Granger causality test result for Chinese GDP and M2, and Table 4 shows the Granger causality test result for Japanese M2 and GDP.
In the result of the Granger causality test, it is clearly shown that the Chinese M2 is the Granger cause of the Chinese GDP, and the Japanese M2 is the Granger cause of the Japanese GDP, where the US GDP is the Granger cause of the US M2. The Granger causality test result shows there is a reverse relationship between M2 and GDP in the US compared to the relationship in China and Japan.
In conclusion, the change in the monetary policy of China and Japan will affect their GDP, while the change in the GDP of the US will cause a change in the monetary policy of the US.
7. Further Discussion
From the Granger causality test results, this paper find that the USA has an opposite relationship in terms of M2 and real GDP compared with China and Japan. Beyond that, there may also be several worth-consider details that may impact the Granger Causality between the M2 and GDP.
According to Bao et al., “Regardless of the participation of the US, the US dollar is frequently used for settling the goods traded between almost any two countries in the world. The US dollar is so dominant in global trade that even large economies substantially depend on its role as an invoicing currency [12].” This shows the US dollar is currently the major supplier of currency in international trade, which could be an explanation for why it has a very different pattern in terms of the correlation between the GDP and the monetary supply level.
Compared to China and the US, Japan has a more severe problem with the aging population. According to the data from the World Data Bank, China has 17.25% of its population under 14, where there is 17.96% of its population is under 14 [13]. However, for Japan, there is only 11.62% of its population under 14. That means there may be a lower growth potential for the economy in the future. In research done by Leightner, “The US can choose to use fiscal and/or monetary policy to combat the recession, but using fiscal policy would help countries with flexible exchange rate regimes and hurt countries with fixed exchange rate regimes while using monetary policy would help countries with fixed exchange rate regimes and hurt countries with flexible exchange rate regimes [14].” This shows the US monetary policy affects the global economic situation in a way that other currency does not. This shows the change in the monetary policy of the US affects the global market, whereas the change in the other types of currency only affects their own country. As the increase in the monetary supply may stimulate economic growth in most countries, the US shows a different pattern and, therefore should apply a different approach when making monetary policy.
8. Conclusion
This paper discusses the relationship between the monetary policy and the GDP value of the different countries and their general economic situation. The Granger causality test is used to determine how the M2 and the GDP are correlated from 1999 to 2024, with the data source being the FRED.
According to the results from the Granger causality test, there is a piece of clear evidence that the M2 of a country is the Granger cause of the GDP of the country, potentially showing there is a correlation between the monetary supply and the economic growth of the country. However, the US shows a different pattern compared to China and Japan. As a result of that, the government should focus more on the impact of the monetary supply on the general economic situation, therefore referring to this area of study when making decisions.
Despite there being a clear linkage between economic growth and monetary, this paper has not investigated the detailed mechanism of how the monetary supply and the real GDP of a country may affect each other. This paper did not investigate how different periods of the same country may have different levels of correlation between monetary supply and the real GDP level. These issues could be studied in the future
In addition, all the logical links of this paper rely solely on one piece of evidence, additional and indirect evidence may be required to strengthen the quality and the accuracy of the conclusion. Adding to that, there should be further studies made to investigate more countries' test results, so that there could be a more comprehensive conclusion drawn.
In addition to this piece of study, the future study could focus on: How the aging population may affect the decision-making of the government and their consequences, different types of financial assets may impact the financial market and macroeconomic growth differently. Furthermore, how different countries at different historical periods may have different correlation results and how different countries at different periods may have different economic decision-making and how they impacted the economic performance.
References
[1]. Dell’Ariccia, G., Rabanal, P., & Sandri, D. (2018). Unconventional monetary policies in the euro area, Japan, and the United Kingdom. Journal of Economic Perspectives, 32(4), 147-172.
[2]. Board of Governors (2021). M2 Monetary Aggregate. Retrieved from https://www.stlouisfed.org/financial-crisis/data/m2-monetary-aggregate. Accessed June 29, 2024.
[3]. Word Bank Group (2024). GDP (current US$) – China, US, Japan. Retrieved from https://data.worldbank.org/indicator. Accessed June 29, 2024.
[4]. Ogunsanwo, O. F., Adelugba, I. A., Efuntade, A. O., & Ajoloko, M. O. (2023). Effects of financial market intermediation on economic growth in Nigeria. Journal of Developing Areas, 57(2), 51-64.
[5]. Wang, Y. (2023). Long-run Effects of monetary policy of China on its economic growth. The Chinese Economy, 56(6), 431-440.
[6]. Federal Reserve Bank (2024). M2. FRED. Retrieved from https://fred.stlouisfed.org/searchresults/?st=m2&isTst=1. Accessed June 29, 2024.
[7]. Cai, W. (2020). Financialization, economic structure change, and the USA–China Trade War. World Review of Political Economy, 11(2), 256–269.
[8]. Congressional Research Service (2021). The Federal Reserve’s response to COVID-19: Policy issues. Congressman ED Case. Retrieved from https://case.house.gov/uploadedfiles/r46411_fed_reserve.pdf. Accessed June 29, 2024.
[9]. Kennedy, S., & Wang, Y. (2021). Cheap talk: China’s central bank still struggles to speak to markets. Center for Strategic and International Studies (CSIS). http://www.jstor.org/stable/resrep28767. Accessed June 29, 2024.
[10]. Wang, Y. (2023). Long-run effects of monetary policy of China on its economic growth. Chinese Economy, 56(6), 431–440.
[11]. Bank of Japan (2024). Outlook for economic activity and prices (January 2024). Retrieved from https://www.boj.or.jp/en/mopo/outlook/gor2401a.pdf. Accessed June 29, 2024.
[12]. Bao, H. H. G., Le, H. P., Nguyen, B. H., & Vu, T. A. (2023). The US dollar and trade balance: New findings from the international trade of India with the European Union. Cogent Business & Management, 10(2), 2235817.
[13]. Word Bank Group (2024). Population ages 0-14 (% of total population). Retrieved from https://data.worldbank.org/indicator/SP.POP.0014.TO.ZS?skipRedirection=true&view=map. Accessed June 29, 2024.
[14]. Leightner, J. E. (2024). How US fiscal and monetary policy affect the GDP of countries with fixed and flexible exchange rates. Journal of Economic Integration, 39(1), 86-106.
Cite this article
Li,H. (2024). The Relevance of M2 and GDP: Comparative Analysis of US, China, and Japan. Advances in Economics, Management and Political Sciences,111,70-77.
Data availability
The datasets used and/or analyzed during the current study will be available from the authors upon reasonable request.
Disclaimer/Publisher's Note
The statements, opinions and data contained in all publications are solely those of the individual author(s) and contributor(s) and not of EWA Publishing and/or the editor(s). EWA Publishing and/or the editor(s) disclaim responsibility for any injury to people or property resulting from any ideas, methods, instructions or products referred to in the content.
About volume
Volume title: Proceedings of the 8th International Conference on Economic Management and Green Development
© 2024 by the author(s). Licensee EWA Publishing, Oxford, UK. This article is an open access article distributed under the terms and
conditions of the Creative Commons Attribution (CC BY) license. Authors who
publish this series agree to the following terms:
1. Authors retain copyright and grant the series right of first publication with the work simultaneously licensed under a Creative Commons
Attribution License that allows others to share the work with an acknowledgment of the work's authorship and initial publication in this
series.
2. Authors are able to enter into separate, additional contractual arrangements for the non-exclusive distribution of the series's published
version of the work (e.g., post it to an institutional repository or publish it in a book), with an acknowledgment of its initial
publication in this series.
3. Authors are permitted and encouraged to post their work online (e.g., in institutional repositories or on their website) prior to and
during the submission process, as it can lead to productive exchanges, as well as earlier and greater citation of published work (See
Open access policy for details).
References
[1]. Dell’Ariccia, G., Rabanal, P., & Sandri, D. (2018). Unconventional monetary policies in the euro area, Japan, and the United Kingdom. Journal of Economic Perspectives, 32(4), 147-172.
[2]. Board of Governors (2021). M2 Monetary Aggregate. Retrieved from https://www.stlouisfed.org/financial-crisis/data/m2-monetary-aggregate. Accessed June 29, 2024.
[3]. Word Bank Group (2024). GDP (current US$) – China, US, Japan. Retrieved from https://data.worldbank.org/indicator. Accessed June 29, 2024.
[4]. Ogunsanwo, O. F., Adelugba, I. A., Efuntade, A. O., & Ajoloko, M. O. (2023). Effects of financial market intermediation on economic growth in Nigeria. Journal of Developing Areas, 57(2), 51-64.
[5]. Wang, Y. (2023). Long-run Effects of monetary policy of China on its economic growth. The Chinese Economy, 56(6), 431-440.
[6]. Federal Reserve Bank (2024). M2. FRED. Retrieved from https://fred.stlouisfed.org/searchresults/?st=m2&isTst=1. Accessed June 29, 2024.
[7]. Cai, W. (2020). Financialization, economic structure change, and the USA–China Trade War. World Review of Political Economy, 11(2), 256–269.
[8]. Congressional Research Service (2021). The Federal Reserve’s response to COVID-19: Policy issues. Congressman ED Case. Retrieved from https://case.house.gov/uploadedfiles/r46411_fed_reserve.pdf. Accessed June 29, 2024.
[9]. Kennedy, S., & Wang, Y. (2021). Cheap talk: China’s central bank still struggles to speak to markets. Center for Strategic and International Studies (CSIS). http://www.jstor.org/stable/resrep28767. Accessed June 29, 2024.
[10]. Wang, Y. (2023). Long-run effects of monetary policy of China on its economic growth. Chinese Economy, 56(6), 431–440.
[11]. Bank of Japan (2024). Outlook for economic activity and prices (January 2024). Retrieved from https://www.boj.or.jp/en/mopo/outlook/gor2401a.pdf. Accessed June 29, 2024.
[12]. Bao, H. H. G., Le, H. P., Nguyen, B. H., & Vu, T. A. (2023). The US dollar and trade balance: New findings from the international trade of India with the European Union. Cogent Business & Management, 10(2), 2235817.
[13]. Word Bank Group (2024). Population ages 0-14 (% of total population). Retrieved from https://data.worldbank.org/indicator/SP.POP.0014.TO.ZS?skipRedirection=true&view=map. Accessed June 29, 2024.
[14]. Leightner, J. E. (2024). How US fiscal and monetary policy affect the GDP of countries with fixed and flexible exchange rates. Journal of Economic Integration, 39(1), 86-106.