


1. Introduction
This paper aims to analyze the intricate relationship between U.S. macroeconomic factors and gold prices by focusing on the U.S. market and employing machine learning techniques, specifically a Gradient Boosting Model (GBM). This approach enables us to handle the inherent non-linear interactions and complexities within economic data. The choice of GBM was driven by its robustness in predictive modeling, where it sequentially builds an ensemble of weak learners to improve the overall accuracy of the model. This study incorporated key macroeconomic indicators such as U.S. GDP growth, interest rates, inflation, and the U.S. dollar index, as these factors are well-known to influence gold prices [1]. Additionally, this paper considered oil prices due to their strong correlation with gold as a commodity. By integrating economic theory with machine learning to structure our analysis, this study aims to offer a comprehensive understanding of how these factors collectively impact gold prices [2]. The findings not only provide valuable insights into the dynamic relationship between U.S. macroeconomic factors and gold prices but also present a predictive framework that can guide investors and policymakers in making informed decisions. The use of machine learning techniques like GBM sets a foundation for future research, where further refinement of models and the inclusion of additional variables could enhance predictive accuracy and deepen our understanding of gold price movements in response to evolving economic conditions.
2. Literature Review
Jean highlights that various factors influence the gold prices, including the role of central banks holding paper currency and gold as reserves [3]. As central banks shift their reserves from paper currency to gold, the price of gold tends to rise. Similarly, gold prices are also influenced by the basic theory of global jewelry industry supply and demand. As demand of gold in jewelry industry increases, gold prices can also climb. Furthermore during periods of economic instability or uncertainty, such as recessions or periods of high inflation, investors often turn to gold to safeguard their wealth, which can drive up its prices. Therefore, in times of turmoil, gold is generally considered a safe haven for investors, because it holds enduring value when paper currency depreciate. From the previous literature, it can be seen that, given the prominence of the U.S. economy and the status of the U.S. dollar as a global reserve currency, U.S. macroeconomic factors play a critical role in influencing global gold prices. Key indicators such as U.S. GDP growth, inflation, interest rates, and the U.S. dollar index have been extensively studied in the literature. For example, rising U.S. interest rates generally strengthen the U.S. dollar, which in turn reduces the demand for gold, as gold becomes more expensive for investors holding other currencies. Conversely, during economic slowdowns, gold prices tend to rise as investors seek stability.
Recent studies have explored the use of hybrid models that combine the strengths of traditional econometric methods with modern machine learning techniques. These models are designed to capture the linear trends typically identified by econometric models and the nonlinear patterns at which machine learning models excel. For instance, a study by Muhammadullah and Khan demonstrated that a hybrid model combining ARIMA with Gradient Boosting Machine (GBM) significantly improved the accuracy of gold price predictions compared to using either model alone [4]. This hybrid approach offers a more comprehensive framework for understanding the factors influencing gold prices. Besides, an emerging trend encountered in the research literature is the incorporation of sentiment analysis and alternative resources like news articles, social media posts, and Google Trends into gold price prediction models. Sentiment analysis, which uses natural language processing (NLP) techniques, has been shown to correlate with price movement. For example, studies employing Twitter sentiment analysis have demonstrated that shifts in public sentiment may precede significant price changes, thereby providing additional predictive capability. The traditional econometric models, machine learning algorithms can dynamically adapt to changing market conditions, making them particularly useful for predicting volatile assets like gold [5]. The application of machine learning in financial markets has gained strong momentum because of it is capable of analyzing large datasets and identify complex non-linear relationships between variables. Research has shown that machine learning models, such as Support Vector Machines (SVM) and Neural Networks, often outperform traditional models in terms of predictive accuracy, especially when dealing with high-dimensional data [6]. Manjuala and Karthikeyan further emphasizes the effectiveness of ensemble methods like Gradient Boosting on predicting gold prices [7]. It highlights how these models, by incorporating various macroeconomic indicators, can outperform single-model approaches by providing more accurate and stable predictions. The ensemble-based approach is particularly well-suited for dealing with the complexities and volatilities inherent in financial markets, such as those observed in gold prices.
3. Data and Methods
3.1. Data
3.1.1. Factors Selection
Initially, this study considers three factors: U.S. GDP growth, U.S. interest rate, and U.S. inflation. The reason for choosing U.S. GDP growth as a factor is because U.S. GDP growth serves as a barometer of economic health, influencing investor confidence and demand for gold as a hedge against economic instability. Interest rates, partially influenced by central banks, affect the opportunity cost of holding assets that do not pay interest, like gold, thereby influencing its attractiveness. Inflation, a measure of the general price level increase, also plays a crucial role, as investors often treat gold as a hedge against inflationary pressures.
Meanwhile, this study also considers the strength of the U.S. dollar so that the U.S. dollar index is added to the research. The U.S. dollar index, representing the value of the U.S. dollar relative to a basket of other currencies, impacts gold prices because the decrease in U.S. dollar value will reduce the purchasing power of U.S. people, thus increasing the gold price. Finally, the oil price is added to our model since commodity prices like oil often correlate with gold's price. The oil price offers an additional perspective on commodity market dynamics. Oil's role as an essential energy source and its sensitivity to geopolitical and economic conditions can directly and indirectly affect inflation and economic stability, influencing gold prices.
3.1.2. Data Preprocessing
The data is collected from the Federal Reserve Bank of St. Louis, Yahoo Finance, and Macrotrends. The data-cleaning process is taken as follows: The first step is to clean all the non-value columns and remove unnecessary columns. Then, each date is renamed in a different Excel file to year_Q1, year_Q2, year_Q3, and year_Q4. Finally, all the data is paired by making data with the same date appear in the same Excel row.
3.2. Gradient Boosting Model
Gradient boosting is a powerful machine-learning technique that builds an ensemble of decision trees to improve projected performance. It works by iteratively building models upon previous one by correcting the errors, making it highly effective in capturing non-linear relationships in data. Gradient boosting models have been successfully applied in various financial predicting tasks, including stock prices, currency exchange rates, and, more recently, gold prices. These models' ability to handle various predictive factors, including macroeconomic indicators, makes them particularly suitable for analyzing the drivers of gold prices.
In the following context, this study explicates the process of predicting gold prices based on a gradient-boosting algorithm. This research first trains the machine learning model by using five independent variables, U.S. GDP, U.S. interest rate, U.S. dollar index, U.S. inflation, and U.S. oil price(which use West Texas Intermediate as a benchmark ) to predict the gold price. Then, this study calculates the feature importance of each factor. Feature importance measure how each factor contributes to the prediction. Moreover, one factor is taken out of the model at a time to see if a more accurate model can be obtained. In the event, the trail starts with the least significant factor and end with the most significant factor. Finally, we took three factors with the three most significant feature importance values.
4. Result and Discussion
4.1. The Seeking of the Best Model
In machine learning model training, it is helpful to put a portion of the data into training data sets and the rest into the testing data sets. A function from the machine learning library, sci-kit learn is used to split. During the event, the data is shuffled and then split into a ratio of 8:2 so that the two result data sets can be considered random. After preparing the data, the data set that represents 80% of the data is used to train the gradient boosting model. Then, the remaining 20% of the data is used to test it. As a result, we get 206.57 root mean square error and 0.86 R-squared. This result is strong since an R-squared close to one indicates a strong correlation [8]. We use the feature importance metric to show the contributions of the different factors. After calculating feature importance, the importance is plotted in Figure 1.
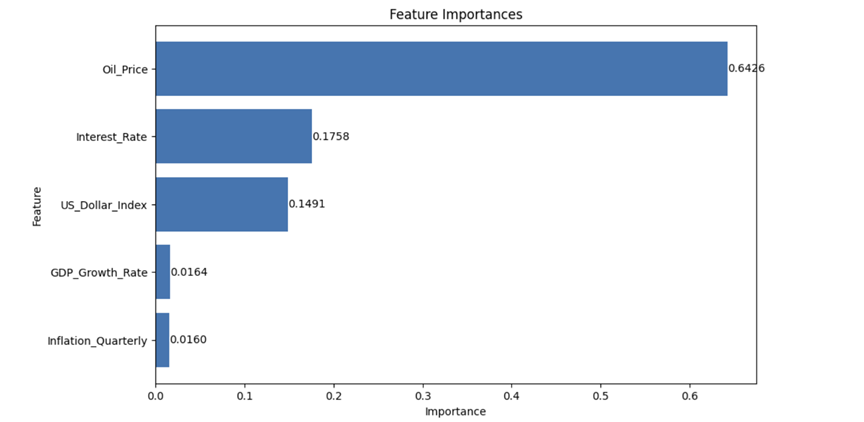
Figure 1: future importance
As shown from the feature importance in Figure 1, oil is the most significant factor that affects gold prices. The insight behind these is two: First, oil price influences the operation cost of gold mining. Second, the price of oil affects the transportation cost of gold. Moreover, it is reasonable to see whether our model will improve if one metric is removed at a time. So, the minorest significance factor, GDP growth rate, is taken out of the model and did the whole process again. We got a lower R-squared and higher root mean square error: 0.81 and 238.29. So, we can not exclude the GDP growth factors. The same experiment is done for inflation, the U.S. dollar index, interest rate, and oil price, and this research found that if only oil price, interest rate, U.S. dollar Index, and GDP growth rate are included in the model, the highest Rsquare 0.89 and Lowest Mean Square Error which is 182.13 can be achieved. Finally, the three most important factors, oil price, interest rate, and the U.S. dollar index, are included. However, the model's performance is not better than that of the model with the four factors mentioned in the previous argument. Table 1 summarizes the results of different models. This study concludes that the model with the oil price, interest rate, U.S. dollar index, and GDP growth as independent variables best predicts gold prices.
Table 1: Testing Different Models
Factor | RSQUARED | RSME | Comment |
Oil Price, Interest Rate,US dollar Index,GDP growth,Inflation | 0.86 | 206.57 | |
Oil Price, Interest Rate,US dollar Index,GDP growth | 0.89 | 182.13 | Best Result |
Oil Price, Interest Rate,US dollar Index, Inflation | 0.81 | 239.27 | |
Oil Price, Interest Rate, GDP growth,Inflation | 0.59 | 349.32 | |
Oil Price, US dollar Index,GDP growth,Inflation | 0.49 | 390.41 | |
Interest Rate,US dollar Index,GDP growth,Inflation | 0.44 | 408.42 | |
Oil Price, Interest Rate,US dollar Index | 0.84 | 218.94 |
4.2. Results of the Best Model
Then, the testing data set and predictions from the best model are used and plotted in the same graph: we get the result as shown in Figure 2. As Figure 2 shows, the shape of the prediction curve is very similar to the shape of the actual curve, and only a tiny portion of the curve's shape is discord between the two curves. The Figure indicates that our model's prediction is effective.
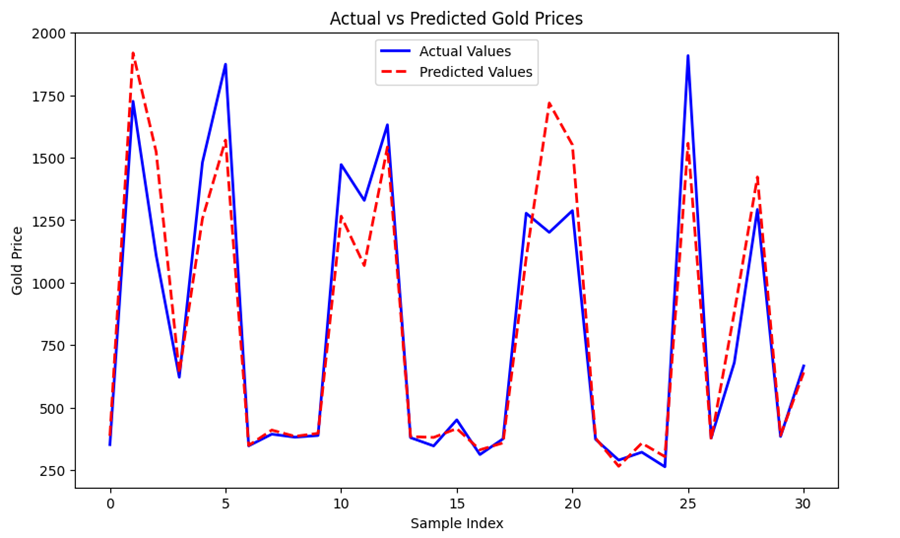
Figure 2: Predictions of gold price from model and actual gold
5. Conclusion
This study employed econometric and machine learning methods to examine how U.S. macroeconomic factors influence gold prices. This study offers a thorough understanding of the factors that influence gold prices, enabling investors to make more informed and precise investment choices. The findings indicate that while traditional econometric models can effectively capture linear relationships, the use of Gradient Boosting Models (GBM) reveals the complex non-linear interactions that play a significant role in determining gold prices. By integrating key macroeconomic indicators such as GDP growth, interest rates, inflation, and the U.S. dollar index, alongside the oil price, this study underscores the value of advanced predictive techniques in financial analysis. The results suggest that a model incorporating these factors offers a robust framework for predicting gold prices, helping investors and policymakers make informed and rational decisions. Future research could further refine these models by including additional variables and exploring more sophisticated machine learning techniques to enhance predictive accuracy in the evolving economic landscape.
Authors Contribution
All the authors contributed equally and their names were listed in alphabetical order.
References
[1]. A, L., Qin, Q., Kamran, H. W., Sawangchai, A., Wisetsri, W., & Raza, M. (2021). How macroeconomic indicators influence gold price management. Business Process Management Journal. https://www.emerald.com/insight/content/doi/10.1108/BPMJ-12-2020-0579/full/html
[2]. Yaqub, K. Q. (2022). The impact of macroeconomic factors on the price of gold. https://digitalcommons.buffalostate.edu/cgi/viewcontent.cgi?article=1036&context=economics_theses
[3]. Folger, J. (2023). What drives the price of gold?. Investopedia. https://www.investopedia.com/financial-edge/0311/what-drives-the-price-of-gold.aspx
[4]. Khan, F., Urooj, A., & Muhammadullah, S. (2021, January). An Arima-Ann Hybrid Model for Time Series forecasting https://www.researchgate.net/publication/263454208_An_ARIMA-ANN_hybrid_model_for_time_series_forecasting
[5]. Lucy, G. (2024). Predicting gold prices with alternative data https://www.neudata.co/intelligence/predicting-gold-prices-with-alternative-data
[6]. Varshini A, Kayal P, Maiti M. (2024). How good are different machine and deep learning models in forecasting the future price of metals? Full sample versus sub-sample, Resources Policy, 92.
[7]. Manjuala, R., & Karthikeyan, S. (2023). Gold Price Prediction using Ensemble based Machine Manjula K A Learning Techniques, https://ieeexplore.ieee.org/document/8862557
[8]. Naser, M.Z., Alavi, A.H. (2023). Error Metrics and Performance Fitness Indicators for Artificial Intelligence and Machine Learning in Engineering and Sciences. Archit. Struct. Constr. 3, 499–517.
Cite this article
Xiong,H.;Zhang,W. (2024). How the US Macroeconomic Factors Affect the Gold Price?. Advances in Economics, Management and Political Sciences,124,32-37.
Data availability
The datasets used and/or analyzed during the current study will be available from the authors upon reasonable request.
Disclaimer/Publisher's Note
The statements, opinions and data contained in all publications are solely those of the individual author(s) and contributor(s) and not of EWA Publishing and/or the editor(s). EWA Publishing and/or the editor(s) disclaim responsibility for any injury to people or property resulting from any ideas, methods, instructions or products referred to in the content.
About volume
Volume title: Proceedings of the 8th International Conference on Economic Management and Green Development
© 2024 by the author(s). Licensee EWA Publishing, Oxford, UK. This article is an open access article distributed under the terms and
conditions of the Creative Commons Attribution (CC BY) license. Authors who
publish this series agree to the following terms:
1. Authors retain copyright and grant the series right of first publication with the work simultaneously licensed under a Creative Commons
Attribution License that allows others to share the work with an acknowledgment of the work's authorship and initial publication in this
series.
2. Authors are able to enter into separate, additional contractual arrangements for the non-exclusive distribution of the series's published
version of the work (e.g., post it to an institutional repository or publish it in a book), with an acknowledgment of its initial
publication in this series.
3. Authors are permitted and encouraged to post their work online (e.g., in institutional repositories or on their website) prior to and
during the submission process, as it can lead to productive exchanges, as well as earlier and greater citation of published work (See
Open access policy for details).
References
[1]. A, L., Qin, Q., Kamran, H. W., Sawangchai, A., Wisetsri, W., & Raza, M. (2021). How macroeconomic indicators influence gold price management. Business Process Management Journal. https://www.emerald.com/insight/content/doi/10.1108/BPMJ-12-2020-0579/full/html
[2]. Yaqub, K. Q. (2022). The impact of macroeconomic factors on the price of gold. https://digitalcommons.buffalostate.edu/cgi/viewcontent.cgi?article=1036&context=economics_theses
[3]. Folger, J. (2023). What drives the price of gold?. Investopedia. https://www.investopedia.com/financial-edge/0311/what-drives-the-price-of-gold.aspx
[4]. Khan, F., Urooj, A., & Muhammadullah, S. (2021, January). An Arima-Ann Hybrid Model for Time Series forecasting https://www.researchgate.net/publication/263454208_An_ARIMA-ANN_hybrid_model_for_time_series_forecasting
[5]. Lucy, G. (2024). Predicting gold prices with alternative data https://www.neudata.co/intelligence/predicting-gold-prices-with-alternative-data
[6]. Varshini A, Kayal P, Maiti M. (2024). How good are different machine and deep learning models in forecasting the future price of metals? Full sample versus sub-sample, Resources Policy, 92.
[7]. Manjuala, R., & Karthikeyan, S. (2023). Gold Price Prediction using Ensemble based Machine Manjula K A Learning Techniques, https://ieeexplore.ieee.org/document/8862557
[8]. Naser, M.Z., Alavi, A.H. (2023). Error Metrics and Performance Fitness Indicators for Artificial Intelligence and Machine Learning in Engineering and Sciences. Archit. Struct. Constr. 3, 499–517.