


1. Introduction
1.1. Research Background and Significance
As international economic integration has grown, M&A have become an important way for major enterprises, especially multinational enterprises, to develop and expand their scale [1,2]. This paper will combine the potential rules of stock market changes of well-known international express companies, and investigate the effect of their decisions on the stock market through the actual cases of the acquisition of local express companies in various countries, so as to achieve the purpose of reducing risks and improving benefits. Accurate prediction of stock price has always been the direction that researchers are interested in, but the stock market price often fluctuates, showing complex nonlinearity and randomness. Enterprises have many factors that will affect the stock price, including economic indicators, company performance, market sentiment and so on. However, the amplitude and time of stock fluctuations also clearly reflect the effectiveness of corporate strategic decisions, so finding an effective forecasting method is one of the keys to help relevant practitioners develop better strategies. In the process of changes in the international express delivery market, cases of foreign enterprises acquiring local enterprises are still occurring. Consequently, this study forecasts the DHL Company's stock price using the ARIMA model and compares it with actual data to explore the impact of M&A on DHL Company, so as to provide reference for acquiring companies or target companies in the industry.
1.2. Literature Review
Prior to exploring merger and acquisition activity, it is essential to initially investigate the motivation behind it. The traditional theory of M&A motivation elucidates the reasons for conducting M&A, the microeconomic theory expounds that M&A stems from the economies of scale achievable through M&A, and the market power theory posits that M&A originates from the aspiration to enhance the monopolistic control over the business environment of enterprises [3]. M&A typically exert a considerable influence on a company's stock market. For instance, A company that is thought to be merging with another company typically sees a boost in the price of its stock or a change in the volatility of other companies' stock prices in the same industry. Moreover, the target enterprise typically obtains a greater increase in stock price than the main enterprise after the merger, thereby making the future trend of the stock an important basis for the company's decision-making. The selection of models to forecast stock price fluctuations has always been one of the primary issues studied by economists. Box Jenkins pioneered the ARIMA model for the first time, and Konstantinos Ioannou et.al employed the ARIMA model to predict the short-term dynamic price of new materials in Greece [4]. Ho, M. K, Hazlina Darman and Sarah Musa utilized the ARIMA model to model the closing price data of Bursa Malaysia from February 1, 2020 to January 19, 2021 to predict the stock price data with high volatility in the long run [5]. According to the results, the ARIMA model works well for short-term dynamic and static predictions but demonstrates a significant deviation for long-term trend predictions. Engle. R and Kraft. D pointed out that Both domestic and international academics now use the autoregressive conditional heteroskedasticity (ARCH) model and the GARCH model to anticipate trends in stock prices. However, traditional models have limited capabilities in predicting unexpected events. In financial markets, for example, unanticipated events such as M&A can have a substantial impact on stock prices, rendering traditional models difficult to accurately predict these events. To overcome the limitations of traditional models, the researchers proposed an improved ARMI-GARCH model. Babu, C. N, & Reddy, B. E respectively employed ARMA, ARMA-GARCH and ARMA-EGARCH models to forecast short-term interest rates. To assess the accuracy of the model, Indian stock market data is utilized and the performance of the model is compared with that of traditional models. The results demonstrate that the combined model surpasses other models in terms of prediction accuracy and data trend retention [6]. Therefore, this study will use the ARIMA-GARCH model to predict the stock of DHL company and combine the nodes of its company's merger and acquisition of other enterprises to verify the close relationship between the stock trend and the company's merger and acquisition, and provide a new reference direction for other companies in the same industry for strategic decision-making and data analysis.
1.3. Research Contents
As a way for modern enterprises to realize corporate strategy and promote optimal allocation of resources, it is worth thinking about how to evaluate the earnings after merger and forecast the direction of the stock price of the company. This paper selects the monthly closing price data of DHL from September 1, 2014 to August 16, 2024, a total of 122 sets of data, and uses R software and ARMI-GARCH model for fitting and estimating the stock's historical data. The prediction results of this model are compared with the actual data, and multi-angle analysis is made from macroeconomic environment to industry dynamics. Finally, the advantages and limitations of the ARMI-GARCH model are discussed, and the stock price development of DHL after M&A in various periods is studied and some enlightenment is obtained.
2. Methodology
2.1. ARIMA Model
The Autoregressive Integrated Moving is referred to as ARIMA. Another name for ARIMA is the Box-Jenkins technique. Box and Jenkins assert that by differentiating series Y t, non-stationary data can be made stationary. Where d is the total number of difference operations. The basic principles are as follows:
\( ϕ(B){∇^{d}}{Y_{t}}=θ(B){ε_{t}} \) (1)
\( E({ε_{t}})=0 \) (2)
\( var({ε_{t}})=σ_{ε}^{2} \) (3)
\( E({ε_{t}}{ε_{s}})=0, s≠t \) (4)
\( E ({Y_{s}}{ε_{t}})=0, ∀s \lt t \) (5)
\( {∇^{d}}={(1-B)^{d}} \) (6)
\( φ(B)=1-{φ_{1}}-…-{φ_{p}}{B^{p}} \) (7)
\( θ(B)=1-{θ_{1}}-…-{θ_{p}}{B^{p}} \) (8)
(1)-(8) are the autoregressive coefficient polynomial and the moving average coefficient polynomial of the stationary invertible ARIMA (p, q) model, respectively [7].
The standard ARIMA model allows predictions to be made based only on past values of the predictor. According to the paradigm, a variable's future value is determined by its past value in a linear fashion., as well as the value of its past (random) influence.
2.2. GARCH Model
On the basis of the ARCH model, BOLLERSLEV proposed the concept of conditional heterogeneity of lag and the volatile term of lag in 1986.
Generalized autoregressive conditional heteroscedasticity model is presented. GARCH model is a model used to describe the volatility of time series data, which is widely used volatility modeling and in the financial industry, risk management. The GARCH model is based on the concept of conditional heteroscedasticity to capture volatility in the data Aggregation features. Its expression is as follows:
\( σ_{t}^{2}=ω+{a_{1}}a_{t-1}^{2}+{a_{2}}a_{t-2}^{2}+…+{a_{q}}a_{t-r}^{2}+{β_{1}}σ_{t-1}^{2}+{β_{2}}σ_{t-2}^{2}+…+{β_{p}}σ_{t-s}^{2} \) (9)
Its constraint conditions are:
\( \sum _{i=1}^{r}{a_{i}}+\sum _{i=1}^{s}{β_{i}} \lt 1,{a_{0}}≥0,i=1,2,…,r, {β_{i}}≥0,i=1,2,…,s \) (10)
GARCH model can be more accurate describe the volatility and risk of time series data by introducing lagging volatility terms and conditional heteroscedasticity terms, the model can be more accurate describe the volatility and risk of time series data [8].
3. DHL's M&A History
3.1. Merger Time and Company
One of the top logistics firms in the world is DHL (Deutsche Post DHL Group), and its history of M&A has been an important part of its global network expansion and business growth. Here are some of the key M&A events in DHL's history:
In 2002, Deutsche Post becomes DHL's largest shareholder and completes its full acquisition of DHL in 2003; In 2005, Deutsche Post DHL Group acquires British logistics company Exel, one of the largest M&A in the logistics industry at the time, further consolidating DHL's position in the global logistics market; In 2006, DHL acquires American air cargo company Ameriflight to enhance its air freight capabilities in the North American market; In 2008, DHL sells its domestic express business in the United States, but retains its international express business. The move marks a shift in DHL's global strategy. In 2010, DHL acquires UK Mail, a British mail and parcel service provider, in an acquisition strategy that expands its presence in the UK market; In 2011, DHL acquires Safmarine, a South African freight forwarding company, to enhance its presence in the African market; In 2015, DHL completes the acquisition of Us-Based supply chain management company Williams Lea Tag in order to enrich its services in the field of supply chain management; In 2016, DHL takes e-commerce logistics to the next level with the acquisition of German e-commerce service provider Eshopworld. In 2018, DHL acquired the German logistics company Ingram Micro's Commerce & Fulfillment Solutions business, which cemented its position as a global leader in e-commerce services; In 2020, DHL acquips LifeConEx, a German healthcare logistics company, expanding its logistics services in the healthcare and life sciences sectors.
Through M&A, enterprises can quickly enter new markets or enhance the competitiveness of existing markets, while enriching products and services to better meet customer needs. Consolidating resources and optimizing operations can also help reduce costs and increase corporate value, which can drive stock prices higher. DHL successfully expanded its business scope and introduced new management concepts and technologies through an M&A strategy, especially after the acquisition of LifeConEx in 2020, which resulted in significant profit growth and a rising share price.
However, M&A can also have negative consequences. If the price paid is too high or the integration is poor, it can cause the acquirer's share price to fall after the announcement. For example, when Anta announced the acquisition of Amer Sports in 2018, its share price fell 9.15 percent, reflecting investor concerns about the deal price and future strategy execution. In some cases, if the integration after the merger is not smooth, or there are problems in management, the value of the company after the merger may be lower than the value of independent operation, that is, the merger effect is counterproductive.
Therefore, M&A decision is closely related to stock price performance, and it is essential to accurately predict the change of stock price after M&A for formulating effective M&A strategy, which is conducive to bringing greater value to enterprises.
3.2. Data Preprocessing and Preliminary Analysis
The data used is the monthly historical stock market data of DHL, which is part of Deutsche Post DHL, the world's leading mail and logistics group from September 1, 2014 to August 16, 2024. This data set was obtained by searching Yahoo Finance (https://hk.finance.yahoo.com), and the time series is plotted by R-studio.
4. Stationarity Test
After extracting the DHL stock closing price data from the original data and drawing the line chart of DHL stock closing price from 2002 to 2024, the stationarity test is carried out.
4.1. First Difference
It can be inferred from the line plot in Figure 1 that the sequence data is not stationary. Because the closing price data of a stock is the original data, the data fluctuates greatly in the short term, and does not follow a significant rule in the long-term time series (see Figure 1).
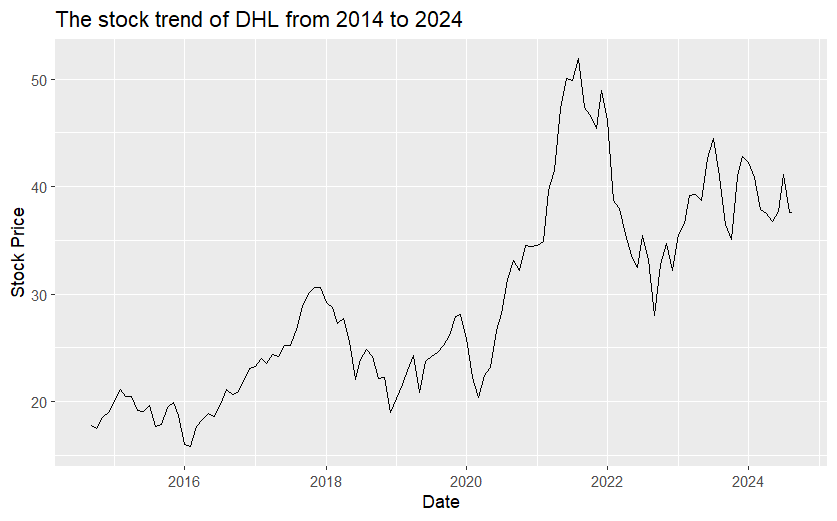
Figure 1: The line chart of DHL stock.
In order to more accurately confirm whether the sequence is stationary, the ADF unit root test is performed on the sequence.
At the significance level, the P-value of this series is 0.3247, and the P-value is much higher than 0.05, so the data of this time series is not stationary.
In this paper, the time series of the original data is processed by first-order difference, it can be seen from Figure 2, the data becomes very stable. besides, this paper tested the ADF again. The P-value of the series was less than the significance level 0.05, so it was inferred that the series belonged to a stationary time series. The results before and after difference are shown in the table 1.
Table 1: Results of ADF stationarity test.
variable |
ADF |
P |
Conclusion |
Index |
-2.6064 |
0.3247 |
instability |
Indexdiff |
-4.1963 |
0.01 |
stability |
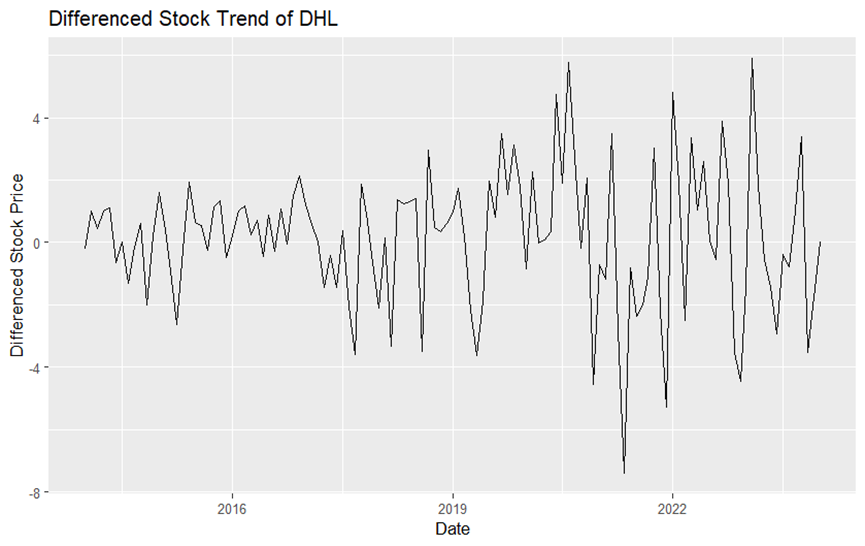
Figure 2: Line graph after first difference.
4.2. Residual white Noise Test
Before the order determination of ARIMA model, it is necessary to determine whether the time series after difference is white noise. There are three commonly used methods, self-phasing Close graph, Box-Pierce test and Ljung-box test [9].
In this paper, autocorrelation graphs and Ljung-box are used for white noise test. Firstly, implemented partial autocorrelation and autocorrelation graphs for first-order difference sequences using R-studio, as shown in figures 3-4.
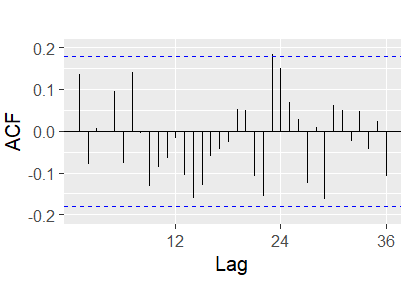
Figure 3: ACF diagram after first difference.
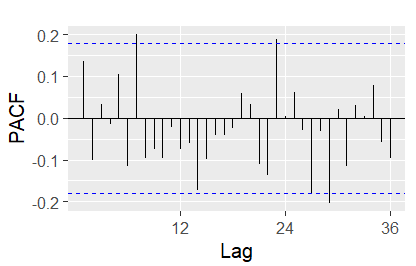
Figure 4: PACF diagram after first difference.
As can be seen from Figures 3-4, there are more autocorrelation coefficients and partial autocorrelation coefficients outside the blue dashed line in the sequence, so the sequence is probably not white noise. The Ljung-box is used to check whether the sequence is white noise, and the Ljung-boxes with lags of 6, 12, 18, 24 and 30 are obtained. The statistics and P-values are shown in Table 2.
Table 2: The results of the Ljung-box.
ORDER OF LAG |
LB_STAT |
LB_PVALUE |
6 |
4.779912 |
0.5723352 |
12 |
10.58313 |
0.5649409 |
18 |
20.12674 |
0.3257295 |
24 |
24.93738 |
0.4091699 |
30 |
35.68107 |
0.2187042 |
4.3. ARIMA Model Order Identification
After differentiating the original sequence into stationary sequence, the ARIMA model is fitted. Firstly, The autocorrelation charts and partial autocorrelation diagrams of the time series after differentiation are used to estimate the values of p and q. The PACF plot (see figure 3) gradually approaches 0 at lag=23, so the order of MA can be determined as 2 or 3. The ACF plot (see figure 2) gradually approaches 0 when lag=23, so the order of MA can be preliminarily determined as 2 or 3. It is speculated that the data have a seasonal period of 23, so the seasonal ARIMA model needs to be considered.
5. Prediction Result Analysis
5.1. ARIMA Model Fitting and Forecasting
This paper uses a total of 122 DHL data from September 1, 2014 to August 16, 2024 as a sample set, and establishes the ARIMA (1,1,1) model according to the above modeling steps to predict the closing price of Shanghai Composite Index in the next October, as shown in the table 3.
Table 3: Ten-month of forecast data.
Forecast |
Lo 80 |
Hi 80 |
Lo 95 |
Hi 95 |
Feb 2024 |
38.812 |
36.082 |
41.547 |
34.637 |
42.986 |
Mar 2024 |
37.905 |
33.639 |
42.171 |
31.381 |
44.429 |
Apr 2024 |
38.567 |
33.421 |
43.713 |
30.697 |
46.437 |
May 2024 |
38.084 |
32.040 |
44.128 |
28.841 |
47.327 |
Jun 2024 |
38.436 |
31.708 |
45.165 |
28.146 |
48.727 |
Jul 2024 |
38.179 |
30.766 |
45.593 |
26.841 |
49.517 |
Aug 2024 |
38.367 |
30.370 |
46.364 |
26.136 |
50.597 |
Sep 2024 |
38.230 |
29.660 |
46.800 |
25.123 |
51.337 |
Oct 2024 |
38.330 |
29.242 |
47.417 |
24.432 |
52.228 |
Nov 2024 |
38.257 |
28.666 |
47.847 |
23.590 |
52.924 |
It is evident that the anticipated value of the stock is somewhat near to the closing price that really occurred, and both are within the confidence interval of 80% and 95%. Moreover, the error of the last four trading days is no more than 4%, which is obviously smaller than the prediction error of the last five days, indicating that the model has a high accuracy in short-term prediction of the stock.
At the same time, it is verified that the ARIMA (1,1,1) model constructed in this paper is accurate and can better reflect the short-term change rule of DHL stock closing price series. Although the short-term prediction error of ARIMA model is not high, the raw data may still have heteroscedasticity. The basic assumption of the ARIMA model is that the variance of the data is constant in time, that is, it has homoscedasticity. When there is heteroscedasticity in the data, ARIMA model may cause model bias and inaccurate parameter estimation.
5.2. ARIMA-GARCH Model Fitting and Forecasting
Since heteroscedasticity was found in the data, the following took into consideration the ARIMA model in conjunction with the GARCH model, and the ARIMA-GARCH model was used for modeling and forecasting. The GARCH(1,1) model was fitted to the residual sequence, and the following results were obtained, as shown in Table 4.
Table 4: Parameter estimation results of GARCH(1,1) model.
Coefficient |
Estimate |
Std.Error |
T value |
Pr(>|t|) |
Ao |
1.900227 |
0.90515 |
2.099360 |
0.035785 |
A1 |
0.998999 |
0.25986 |
3.844425 |
0.000121 |
B1 |
0.000001 |
0.18403 |
0.000006 |
0.999996 |
In conclusion, the ARIMA model may not provide relatively accurate prediction results in some cases, such as heteroscedasticity. However, in the real financial market, time series data such as stock prices usually show heteroscedasticity, that is, volatility changes with time. At the same time, it is obviously not a good choice to use ARIMA model to analyze stock volatility after merger and acquisition. However, the ARMI-GARCH model can model the conditional heteroscedasticity of the data through the GARCH part, which better reflects the actual characteristics of the data, so it has higher accuracy in volatility prediction. Compared with ARIMA model, ARMI-GARCH model is more suitable for modeling and forecasting stock price data in the post-merger market. Of course, it is important to note that the ARMI-GARCH model has its limitations. It assumes that the data has a linear relationship and may not capture the nonlinear relationship in the data. The performance of the model also depends on the choice of parameters, which can be challenging and subjective. In addition, for long-term forecasts, the predictive accuracy of the model may be reduced, which is an inherent limitation of time series forecasting [10].
6. Conclusion
The stock market is influenced by numerous unpredictable elements, the volatility of stock prices is large, and often presents complex nonlinear and uncertain characteristics, which makes the market become a highly unstable dynamic system, so it is very difficult to establish an accurate prediction model. Because of its assumptions and requirements for the data, the ARIMA model may not provide accurate enough predictions for certain scenarios, especially when dealing with heteroscedasticity, which is when volatility changes over time. In the reality of financial markets, time series data such as stock prices generally exhibit this heteroscedasticity, which makes the traditional ARIMA model produce prediction bias in some cases. To overcome this limitation, this paper uses the ARMI-GARCH model. The model models the conditional heteroscedasticity of the data through GARCH components, so as to accurately capture the volatility characteristics of the data and show higher accuracy in volatility prediction. Compared with the traditional ARIMA model, the ARMI-GARCH model has more advantages in the modeling and forecasting of financial data. Nevertheless, the author must also recognize that the ARMI-GARCH model is not a panacea. It is based on the assumption of linear relationships in the data and may not adequately capture nonlinear features in the data. In addition, the performance of the model is greatly dependent on the selection of parameters, which may be challenging and subjective to a certain extent, so it is necessary to combine the specific characteristics of the market and the actual performance of the data, and constantly adjust and optimize the model parameters in order to obtain the best prediction effect.
References
[1]. Clayton, B. C. (2010). Understanding the unpredictable: Beyond traditional research on mergers and acquisitions. Emergence: Complexity and Organization, 12(3), 1-19.
[2]. Jiang Jianping. (2007). Microeconomic effects analysis of cross-border mergers and acquisitions, Dalian Maritime University.
[3]. Motis, J. (2007). Mergers and acquisitions motives. Toulouse School of Economics, University of Crete, 1-31.
[4]. Koutroumanidis, T., Ioannou, K., & Arabatzis, G. (2009). Predicting fuelwood prices in Greece with the use of ARIMA models, artificial neural networks and a hybrid ARIMA–ANN model. Energy Policy, 37(9), 3627-3634.
[5]. Ho, M. K., Darman, H., & Musa, S. (2021). Stock price prediction using ARIMA, neural network and LSTM models. In Journal of Physics: Conference Series. 1988 (1), 012041.
[6]. Babu, C. N., & Reddy, B. E. (2014). Selected Indian stock predictions using a hybrid ARIMA-GARCH model. In 2014 International conference on advances in electronics computers and communications,1-6. IEEE.
[7]. Shumway, R. H., Stoffer, D. S., Shumway, R. H., & Stoffer, D. S. (2017). ARIMA models. Time series analysis and its applications: with R examples, 75-163.
[8]. Bauwens, L., Laurent, S., & Rombouts, J. V. (2006). Multivariate GARCH models: a survey. Journal of applied econometrics, 21(1), 79-109.
[9]. Marmarelis, V. (2012). Analysis of physiological systems: The white-noise approach. Springer Science & Business Media.
[10]. Chen, C., Hu, J., Meng, Q., & Zhang, Y. (2011). Short-time traffic flow prediction with ARIMA-GARCH model. In 2011 IEEE Intelligent Vehicles Symposium (IV), 607-612. IEEE.
Cite this article
Bai,Y. (2024). Study on Stock Price Fluctuation of DHL after Cross-border Merger and Acquisition. Advances in Economics, Management and Political Sciences,124,73-81.
Data availability
The datasets used and/or analyzed during the current study will be available from the authors upon reasonable request.
Disclaimer/Publisher's Note
The statements, opinions and data contained in all publications are solely those of the individual author(s) and contributor(s) and not of EWA Publishing and/or the editor(s). EWA Publishing and/or the editor(s) disclaim responsibility for any injury to people or property resulting from any ideas, methods, instructions or products referred to in the content.
About volume
Volume title: Proceedings of the 8th International Conference on Economic Management and Green Development
© 2024 by the author(s). Licensee EWA Publishing, Oxford, UK. This article is an open access article distributed under the terms and
conditions of the Creative Commons Attribution (CC BY) license. Authors who
publish this series agree to the following terms:
1. Authors retain copyright and grant the series right of first publication with the work simultaneously licensed under a Creative Commons
Attribution License that allows others to share the work with an acknowledgment of the work's authorship and initial publication in this
series.
2. Authors are able to enter into separate, additional contractual arrangements for the non-exclusive distribution of the series's published
version of the work (e.g., post it to an institutional repository or publish it in a book), with an acknowledgment of its initial
publication in this series.
3. Authors are permitted and encouraged to post their work online (e.g., in institutional repositories or on their website) prior to and
during the submission process, as it can lead to productive exchanges, as well as earlier and greater citation of published work (See
Open access policy for details).
References
[1]. Clayton, B. C. (2010). Understanding the unpredictable: Beyond traditional research on mergers and acquisitions. Emergence: Complexity and Organization, 12(3), 1-19.
[2]. Jiang Jianping. (2007). Microeconomic effects analysis of cross-border mergers and acquisitions, Dalian Maritime University.
[3]. Motis, J. (2007). Mergers and acquisitions motives. Toulouse School of Economics, University of Crete, 1-31.
[4]. Koutroumanidis, T., Ioannou, K., & Arabatzis, G. (2009). Predicting fuelwood prices in Greece with the use of ARIMA models, artificial neural networks and a hybrid ARIMA–ANN model. Energy Policy, 37(9), 3627-3634.
[5]. Ho, M. K., Darman, H., & Musa, S. (2021). Stock price prediction using ARIMA, neural network and LSTM models. In Journal of Physics: Conference Series. 1988 (1), 012041.
[6]. Babu, C. N., & Reddy, B. E. (2014). Selected Indian stock predictions using a hybrid ARIMA-GARCH model. In 2014 International conference on advances in electronics computers and communications,1-6. IEEE.
[7]. Shumway, R. H., Stoffer, D. S., Shumway, R. H., & Stoffer, D. S. (2017). ARIMA models. Time series analysis and its applications: with R examples, 75-163.
[8]. Bauwens, L., Laurent, S., & Rombouts, J. V. (2006). Multivariate GARCH models: a survey. Journal of applied econometrics, 21(1), 79-109.
[9]. Marmarelis, V. (2012). Analysis of physiological systems: The white-noise approach. Springer Science & Business Media.
[10]. Chen, C., Hu, J., Meng, Q., & Zhang, Y. (2011). Short-time traffic flow prediction with ARIMA-GARCH model. In 2011 IEEE Intelligent Vehicles Symposium (IV), 607-612. IEEE.