


1. Introduction
With the stable development of the economy in recent years, the civil aviation industry has become one of the important factors in promoting social development. It not only contributes to the improvement of people's living standards but also deepens the connection between the civil aviation industry and economic growth. Therefore, the accurate prediction of airport passenger volume is of great significance for reasonable planning and management of airport resources, optimizing route layout, improving local livelihood index and supporting regional economic development strategy [1]. There are many options for civil aviation passenger volume forecasting models. Although advanced algorithms such as neural networks and support vector machines (SVM) can deal with complex nonlinear problems, they often require a lot of computational resources and entail high computational costs in practical applications. This paper presents a multiple linear regression method to evaluate the performance of linear and nonlinear models in predicting airport passenger throughput. The multiple linear regression model is simple, efficient, and interpretable, and is suitable for short-term forecasting in the field of transportation [2].
2. Influence of Relevant Factors and Model Setting
2.1. Analysis of Influencing Factors
Airport passenger traffic is affected by various socio-economic and operational factors. Shijiazhuang, the capital of Hebei Province, is not only the most populous city in Hebei Province but also serves as an important transportation hub in the country. This study focuses on three key factors that are considered to have a significant impact on the passenger volume of Shijiazhuang ZhengDing Airport, namely, per capita GDP, total population and the number of aircraft takeoffs and landings, as explanatory variables [3].
• Per capita GDP: Per capita GDP is an indicator to measure the level of economic development in a region, and the level of economic development is directly proportional to the level of per capita consumption, which directly affects people's travel choices.
• Total population: With the increase in population, there will also be a corresponding rise in travel demand, thereby driving the growth of civil aviation passenger traffic.
• Aircraft sorties: The number of aircraft movements reflects the flight density of the airport, and also determines the passenger capacity of the airport.
2.2. Model Setting
The multiple linear regression model is a common method to analyze the linear relationship between several independent variables (per capita GDP, population, airport takeoff and landing times) and dependent variables (ZhengDing airport passenger throughput). As shown in Table 1, taking time series data and 2005-2023 data as samples, the following passenger traffic model of ZhengDing Airport is established[4]:
\( Y={β_{0}}+{β_{1}}{X_{1}}+{β_{2}}{X_{2}}+{β_{3}}{X_{3}}+ϵ \) (1)
The meanings of each parameter are as follows: \( Y \) represents the airport passenger throughput; \( {X_{1}} \) represents the per capita GDP of Shijiazhuang (yuan); \( {X_{2}} \) represents the total population (10,000); \( {X_{3}} \) indicates the number of takeoffs and landings (times); \( {β_{0}} \) is a constant term; \( {β_{1}},{β_{2}},{β_{3}} \) are the regression coefficients; \( ϵ \) is the random error term.
Table 1: Statistics of passenger throughput and influencing factors at Zhengding Airport[4].
Year | GDP_per_capita | Population | Fight_movements | Passenger_throughput |
2005 | 18671 | 961 | 36271 | 456209 |
2006 | 21000 | 970 | 50593 | 630239 |
2007 | 24243 | 978.08 | 31870 | 802167 |
2008 | 28923 | 984.6 | 28953 | 1043688 |
2009 | 30428 | 988.11 | 32481 | 1320241 |
2010 | 33915 | 1017.52 | 51929 | 2723596 |
2011 | 39919 | 1027.98 | 54903 | 4021167 |
2012 | 43552 | 1038.6 | 54647 | 4852071 |
2013 | 48491 | 1049.98 | 51980 | 5110536 |
2014 | 48970 | 1061.62 | 56216 | 5601017 |
2015 | 51043 | 1070.16 | 56728 | 5985389 |
2016 | 55177 | 1078.46 | 68687 | 7214590 |
2017 | 57024 | 1087.99 | 89497 | 1.1E+07 |
2018 | 55723 | 1095.16 | 89717 | 1.1E+07 |
2019 | 52859 | 1103.12 | 90971 | 1.2E+07 |
2020 | 52961 | 1124.15 | 70680 | 8203974 |
2021 | 57380 | 1120.47 | 70883 | 6451083 |
2022 | 63813 | 1120.47 | 53334 | 5562763 |
2023 | 66911.4 | 1123.35 | 76666 | 9863183 |
2.3. The Influence of Univariate Factors
2.3.1. Per Capita GDP
The least squares (OLS) regression analysis was performed on \( Y \) and \( {X_{1}} \) , and the results were as follows:
\( Y=-4249000+215.5234{X_{1}} \) (2)
\( {t=6.994 F=48.91^{}} \) (3)
\( R_{1}^{2}=0.742 \bar{R_{1}^{2}}=0.727 \) (4)
According to model (2) data analysis: the T-value is used to test whether each regression coefficient is significant. A value of t greater than 2 indicates a significant impact on the dependent variable Y; the F-value is used to test the significance of the model, with a larger value indicating a stronger overall regression effect of the model ; \( {R^{2}} \) represents the model's ability to explain the variance of the dependent variable, with a value between 0 and 1. The closer \( {R^{2}} \) is to 1, the better the model fits the data; The \( {R^{2}} \) value of 0.742 means that ‘GDP_per_capita’ can explain 74.2% of the variation in ‘Passenger_throughput’. The adjusted \( \bar{{R^{2}}} \) values are slightly lower than the original \( {R^{2}} \) but still very close, indicating that the model as a whole is performing well.
2.3.2. Total Population
The least squares (OLS) regression analysis was performed on \( Y \) and \( {X_{2}} \) , and the results were as follows:
\( Y=54150000+56570{X_{2}} \) \( (5) \)
\( t=7.494 F=56.15 \) (6)
\( R_{2}^{2}=0.768 \bar{R_{2}^{2}}=0.754 \) (7)
According to regression analysis, it is proved that model (3) has high regression significance and a good fitting effect.
2.3.3. Aircraft Sorties
The least squares (OLS) regression analysis was performed on \( Y \) and \( {X_{3}} \) , and the results were as follows:
\( Y=5459000+189.2303{X_{2}} \) (8)
\( t=12.34 F= 152.3 \) (9)
\( R_{3}^{2}= 0.9 \bar{R_{3}^{2}}=0.894 \) (10)
According to regression analysis, it is proved that the model (4) has high regression significance and a good fitting effect.
The results of the above analysis of the degree of influence of single-factor variables indicate that there is a significant relationship between the airport passenger throughput Y and the per capita GDP of Shijiazhuang City \( {X_{1}} \) , the total population \( {X_{2}} \) , and the number of aircraft landings and takeoffs \( {X_{3}} \) . According to the value of \( R: R_{1}^{2} \lt R_{2}^{2} \lt R_{3}^{2} \) , it shows that the passenger throughput of an airport is mainly affected by the frequency of take-off and landing of flights, followed by the size of the population. Additionally, per capita GDP also exerts a significant impact, although its impact is relatively small.
3. Construction of Multiple Linear Regression Model
3.1. Analysis of Multiple Regression Model
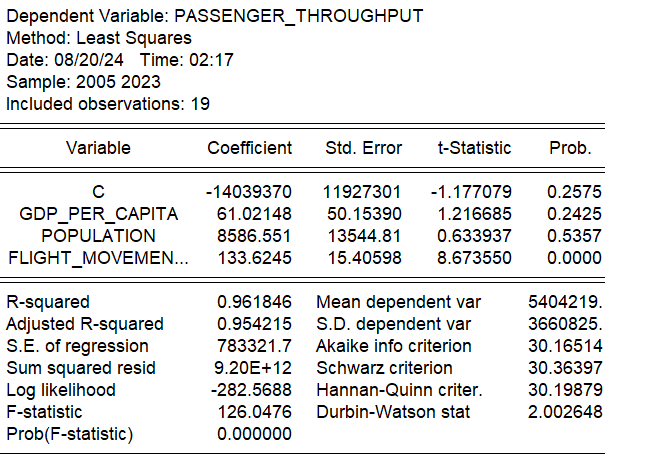
Figure 1: The calculated data based on Eviews[5].
Multiple regression model:
\( Y= -14039370+61.02148{X_{1}}+8586.551{X_{2}}+133.6245{X_{3}} \) (11)
Based on the regression results above shown in Figure 1, it can be seen that X1 and X2 have no significant influence on the dependent variable, because their T-values are 1.216685 and 0.633937 respectively, and there may be multicollinearity problems. The t value of X3 is 8.67355, indicating that it has a significant impact on the dependent variable. For the P-value, the value of X3 is 0.0000, which is far less than 0.05, indicating that X3 has a significant impact. The value of Durbin-Watson is close to 2, indicating that the residuals in the model are not significantly autocorrelated. Therefore, considering the reliability of the model, further analysis of multicollinearity and heteroscedasticity is needed.
3.2. The Test of Multicollinearity
The correlation coefficient matrix of model (5) is shown in Figure 2.
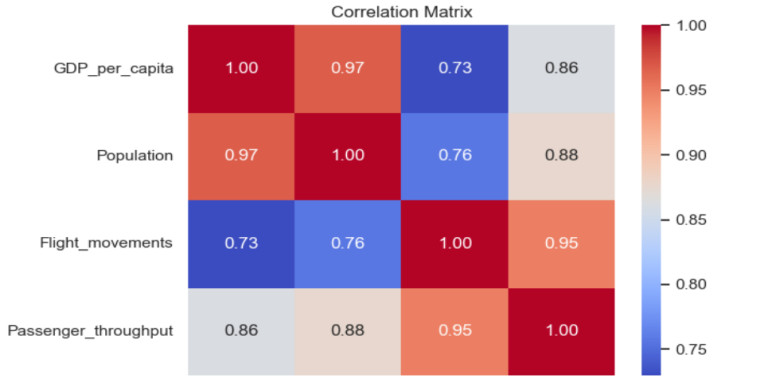
Figure 2: Correlation Matrix Heatmap.
Based on these correlation coefficients, especially the high correlation between X1 and X2, multicollinearity is very possible. High collinearity can cause instability in coefficient estimates in the model, increasing standard errors. To address the issue of multicollinearity, one potential solution is to eliminate a highly correlated variable.
Run two independent regression models: Model 1 containing X1 but not X2. Another model 2 contains X2 but not X1. Compare the performance of the two models and then choose the more appropriate variable based on \( {R^{2}} \) , adjusted and AIC/BIC metrics.
Table 2: Model Comparison.
\( {R^{2}} \) | AIC | BIC | |
Model 1 (GDP_per_capita) | 0.9608 | 571.64 | 574.47 |
Model 2 (Population) | 0.9581 | 572.93 | 575.76 |
According to the regression results of the two models (data as shown in Table 2), model 1 has a slightly higher R value and lower AIC and BIC [6] values, indicating that its model fit is better, and it is more concise and effective. Therefore, between the two, it is recommended to keep X1 as the explanatory variable for Y and remove X2 [7].
Calculation with Eviews is shown in Figure 3:
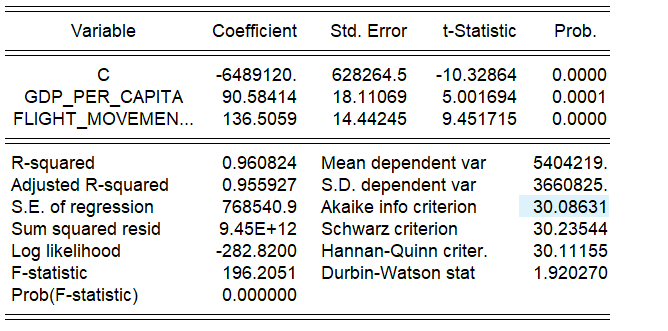
Figure 3: Regression Results.
A new regression model is obtained:
\( Y=-6489120.3797+90.5841{X_{1}}+136.5059{X_{3}} \) (12)
3.3. The Test of Heteroscedasticity
In order to prevent the interference of the constructed model from heteroscedasticity, a White test was conducted on the data, and a judgment was made. The test results are shown in Figure 4.
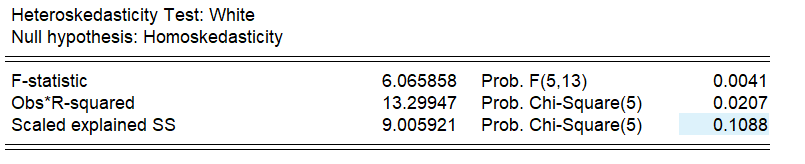
Figure 4: White test data.
The P-value of the F-test is 0.0041, which is much smaller than the common significance level (such as 0.05), implying heteroscedasticity in the model.
Use the weighted least square method to deal with heteroscedasticity [8]: WLS can weight the data to make the variance of the residual more uniform and solve the problem of heteroscedasticity.
The regression results obtained using the weighted least square method (WLS) show an improvement in the model, as shown in Figure 5.

Figure 5: WLS.
The data show that both \( {X_{1}} \) and \( {X_{3}} \) have significant positive effects on Y. The value of \( {R^{2}} \) is close to 1, and the fitting degree is good. Residual analysis reveals no apparent issues with autocorrelation or heteroscedasticity, demonstrating high overall model quality.
Further, a new regression model is obtained:
\( Y=-6290382.6414+89.3893{X_{1}}+133.7647{X_{3}} \) (13)
4. Airport Passenger throughput Results Testing
Based on the statistical data of Shijiazhuang City from 2014 to 2015, the error test of the predicted value of passenger throughput of the model (7) Zhengding Airport was carried out, as shown in Table 3.
Table 3: Prediction Error Analysis for Years 2014 and 2015.
Year | Actual | Predicted | Residual | Relative Error % |
2014 | 5601017 | 5606728 | 5710.702532 | -0.10958 |
2015 | 5985389 | 5860519 | 124869.719613 | 2.086242 |
According to the airport passenger throughput forecast model we constructed, the predicted value in 2014 is almost the same as the actual value, with an error of only 0.10%. However, in 2015, the prediction error of the model increased slightly, but it was still controlled within 2.09%, indicating that the performance of the model in the short-term forecast was more accurate.
5. Conclusion
In this study, the weighted least squares regression model is used to forecast the passenger throughput of Zhengding Airport by analyzing key factors such as GDP per capita and total population flight takeoff and landing. Through multicollinearity and heteroscedasticity, the best passenger throughput prediction model of Shijiazhuang Zhengding Airport was obtained, which was able to explain 99.5% of the railway passenger volume. When predicting the airport passenger throughput in 2014 and 2015, the prediction error of the model was very low, the relative error in 2014 was -0.10%, and the relative error in 2015 was 2.09%, which indicates a high level of accuracy in short-term prediction. In this study, the WLS method was used to deal with heteroscedasticity. The AIC and BIC indexes of the model were 541.2 and 544.0, respectively, which further verified the robustness and stability of the model. The shortcoming of this study is that the data set is small, and future studies can expand the data set to include the data set within the range of nearly 30 years, and explore nonlinear models or machine learning algorithms to further improve the prediction accuracy and model applicability. The inclusion of other variables also helps to improve the accuracy of the model, such as international policies, popular trends of online tourism and other factors. In conclusion, the model developed in this study offers a dependable forecasting tool for airport management, aiding in improved planning and optimization of airport resource allocation.
References
[1]. Tsui, W. H. K., Ozer Balli, H., Gilbey, A., & Gow, H. (2014). Forecasting of Hong Kong airport’s passenger throughput. Tourism Management (1982), 42, 62–76. https://doi.org/10.1016/j.tourman.2013.10.008
[2]. Yi, S., & Guo, J. (2023). Using Machine Learning to Predict Airport Passenger Throughput. EPiC Series in Computing, 91, 146–154. https://doi.org/10.29007/tkhf
[3]. Peng, D., Zhang, M., Xiao, Y., & Wang, Y. (2022). Research on Passenger Throughput Forecast of Civil Aviation Airport Based on Multi-source Data. In Journal of Physics: Conference Series (Vol. 2179, No. 1, p. 012027). IOP Publishing.
[4]. WANG Jiajun.(2024). Prediction and Empirical Analysis of Railway Passenger Volume Based on Linear Regression Model. Intelligent Rail Transit (03), 102-105+114
[5]. Ma, L., Hu, C., Lin, R., & Han, Y. (2018). ARIMA model forecast based on EViews software. IOP Conference Series. Earth and Environmental Science, 208(1), 12017-. https://doi.org/10.1088/1755-1315/208/1/012017
[6]. Kuha, J. (2004). AIC and BIC: Comparisons of Assumptions and Performance. Sociological Methods & Research, 33(2), 188–229. https://doi.org/10.1177/0049124103262065
[7]. Gunst, R. F., & Mason, R. L. (Robert L. (1980). Regression analysis and its application: a data-oriented approach [by] Richard F. Gunst, Robert L. Mason. Dekker.
[8]. MAZIYYA, P. A., SUKARSA, I. K. G., & ASIH, N. M. (2015). MENGATASI HETEROSKEDASTISITAS PADA REGRESI DENGAN MENGGUNAKAN WEIGHTED LEAST SQUARE. E-Jurnal Matematika, 4(1), 20–25. https://doi.org/10.24843/MTK.2015.v04.i01.p083
Cite this article
Fa,S. (2024). Airport Passenger Throughput Prediction Based on Linear Regression. Advances in Economics, Management and Political Sciences,131,150-156.
Data availability
The datasets used and/or analyzed during the current study will be available from the authors upon reasonable request.
Disclaimer/Publisher's Note
The statements, opinions and data contained in all publications are solely those of the individual author(s) and contributor(s) and not of EWA Publishing and/or the editor(s). EWA Publishing and/or the editor(s) disclaim responsibility for any injury to people or property resulting from any ideas, methods, instructions or products referred to in the content.
About volume
Volume title: Proceedings of the 8th International Conference on Economic Management and Green Development
© 2024 by the author(s). Licensee EWA Publishing, Oxford, UK. This article is an open access article distributed under the terms and
conditions of the Creative Commons Attribution (CC BY) license. Authors who
publish this series agree to the following terms:
1. Authors retain copyright and grant the series right of first publication with the work simultaneously licensed under a Creative Commons
Attribution License that allows others to share the work with an acknowledgment of the work's authorship and initial publication in this
series.
2. Authors are able to enter into separate, additional contractual arrangements for the non-exclusive distribution of the series's published
version of the work (e.g., post it to an institutional repository or publish it in a book), with an acknowledgment of its initial
publication in this series.
3. Authors are permitted and encouraged to post their work online (e.g., in institutional repositories or on their website) prior to and
during the submission process, as it can lead to productive exchanges, as well as earlier and greater citation of published work (See
Open access policy for details).
References
[1]. Tsui, W. H. K., Ozer Balli, H., Gilbey, A., & Gow, H. (2014). Forecasting of Hong Kong airport’s passenger throughput. Tourism Management (1982), 42, 62–76. https://doi.org/10.1016/j.tourman.2013.10.008
[2]. Yi, S., & Guo, J. (2023). Using Machine Learning to Predict Airport Passenger Throughput. EPiC Series in Computing, 91, 146–154. https://doi.org/10.29007/tkhf
[3]. Peng, D., Zhang, M., Xiao, Y., & Wang, Y. (2022). Research on Passenger Throughput Forecast of Civil Aviation Airport Based on Multi-source Data. In Journal of Physics: Conference Series (Vol. 2179, No. 1, p. 012027). IOP Publishing.
[4]. WANG Jiajun.(2024). Prediction and Empirical Analysis of Railway Passenger Volume Based on Linear Regression Model. Intelligent Rail Transit (03), 102-105+114
[5]. Ma, L., Hu, C., Lin, R., & Han, Y. (2018). ARIMA model forecast based on EViews software. IOP Conference Series. Earth and Environmental Science, 208(1), 12017-. https://doi.org/10.1088/1755-1315/208/1/012017
[6]. Kuha, J. (2004). AIC and BIC: Comparisons of Assumptions and Performance. Sociological Methods & Research, 33(2), 188–229. https://doi.org/10.1177/0049124103262065
[7]. Gunst, R. F., & Mason, R. L. (Robert L. (1980). Regression analysis and its application: a data-oriented approach [by] Richard F. Gunst, Robert L. Mason. Dekker.
[8]. MAZIYYA, P. A., SUKARSA, I. K. G., & ASIH, N. M. (2015). MENGATASI HETEROSKEDASTISITAS PADA REGRESI DENGAN MENGGUNAKAN WEIGHTED LEAST SQUARE. E-Jurnal Matematika, 4(1), 20–25. https://doi.org/10.24843/MTK.2015.v04.i01.p083