


1.Introduction
In the highly competitive Graphics Processing Unit (GPU) industry, dominated by major companies such as NVIDIA and AMD, it is critical to understand the relationship between financial metrics and stock performance. Existing research suggests that EPS and financial leverage (D/E ratio) are important factors affecting stock prices. EPS directly reflects the profit a company generates per common share in a given time period, and a high EPS typically indicates a high level of profitability, which may lead to an increase in stock price [1]. In contrast, the D/E ratio is a measure of financial leverage, showing the relative proportions of shareholders' equity and debt to a company's assets. Higher D/E ratios indicate a firm's reliance on debt financing, which may increase financial risk, but also offer the possibility of higher returns through leveraged growth [2].
There is a large body of literature on the relationship between EPS and stock prices. The seminal work demonstrated the informational content of earnings announcements on stock prices. Follow up studies by Allen and Jacob et al. further confirmed these findings by pointing to a strong positive correlation between earnings and stock returns [3]. On the other hand, the findings on the effect of financial leverage on stock prices are more mixed. Modigliani and Miller's capital structure irrelevance theory suggested that leverage does not affect firm value in a perfect market[4]. However, imperfections, such as taxes, bankruptcy costs and information asymmetry, lead to different results. The agency cost theory proposed by Jensen and Meckling suggested that higher levels of debt can align management interests with those of shareholders, which may increase firm value [5].
In terms of volatility modelling, the Exponential Generalized Autoregressive Conditional Heteroskedasticity (EGARCH) model proposed by Nelson plays an important role in capturing asymmetry and leverage in financial time series [6]. The effectiveness of EGARCH in modelling stock price volatility and leverage has been demonstrated in studies by Glosten et al. and Bollerslev et al [7,8]. Ridge Regression, Random Forest, Gradient Boosting and Support Vector Regression (SVR) is used to study the stock market in exploring the relationship between stock price and EPS and DE Ratio. The paper’s base classifier is the boosting regression tree (BRT). As a kind of tree-based machine learning algorithm, BRT is a nonparametric method that does not require assumptions to be constructed and tested before use, which can avoid the problem of wrong design of regression models; some of its technical features, including shrinkage and bagging, make it more robust[9].
Especially in the technology industry, where rapid innovation and market dynamics play a key role, understanding the impact of financial metrics on stock performance is critical. For example, Aggarwal and Samwick’s study highlighted the unique challenges and opportunities of the technology industry, emphasizing the importance of profitability and financial stability[10].
This study examines the impact of EPS and the D/E ratio on NVIDIA and AMD stock prices from 2020 to 2024, using Key indicators include EPS for profitability and D/E ratio for financial leverage. Then study selects GARCH (2,2) for NVIDIA and GARCH (2,1) for AMD. EGARCH models reveal significant leverage effects. Regression analysis using multiple models, with Gradient Boosting showing the best fit, is employed. The study aims to provide a comprehensive understanding of the volatility and financial performance of these stocks, offering insights into the influence of financial metrics on stock prices in the GPU industry.
2.Method
2.1.Data Sources and Description
The data used in this study comes from the Kaggle and sec.gov websites, where the daily stock market information for two companies, NVIDIA and AMD, comes from the Kaggle website, and the dataset contains key metrics such as stock price metrics (opening, high, low, closing, and adjusted closing) and trading volume; the quarterly and annual reports for the companies NVIDIA and AMD for the period of 2020-2024 come from the sec.gov website. 2024 quarterly and annual reports from the sec.gov website. These data will help to analyze the impact of D/E ratio and EPS on share price.
2.2.Indicator Selection and Explanation
Earnings per share (EPS): EPS is a measure of a company's profitability, calculated as net income divided by the number of shares outstanding. It is an important indicator to reflect the financial performance of a company. This study aims to investigate the effect of EPS on stock price volatility.
Debt-to-Equity Ratio (D/E Ratio): the D/E ratio indicates the ratio of debt to equity in a company's capital. It is an important financial indicator that reflects the capital structure of a company. The study will examine the impact of D/E ratio on share price.
Return on Equity (ROE): an important financial indicator of a company's profitability. Usually writing the formula:
\( ROE=\frac{Revenue}{Ave equity}\ \ \ (1) \)
It indicates a company's ability to generate net profit through shareholders’ equity (i.e. net assets) and reflects the level of return on shareholders’ equity.
Through the above three indicators, this paper takes NVIDIA and AMD as the benchmark to measure the two stock companies. The following is a summary of the data used in this paper:
Table 1: Comparative Financial Metrics of NVIDIA and AMD.
|
Name |
Metric |
Min |
Max |
Median |
Mean |
Variance |
Sample Size |
|
NVIDIA |
EPS |
-1.11 |
4.97 |
1.01 |
1.55 |
2.13 |
1027 |
|
D/E Ratio |
0.53 |
0.90 |
0.78 |
0.74 |
0.01 |
1027 |
|
|
ROE |
-1.91 |
8.09 |
1.83 |
2.65 |
5.77 |
1027 |
|
|
AMD |
EPS |
-0.09 |
2.61 |
0.28 |
0.37 |
0.16 |
1027 |
|
D/E Ratio |
0.21 |
0.99 |
0.24 |
0.44 |
0.06 |
1027 |
|
|
ROE |
-0.11 |
4.32 |
0.34 |
0.57 |
0.40 |
1027 |
Note: All decimal values are rounded to two decimal place
2.3.Introduction of Method
This study analyzes the volatility and financial performance of NVIDIA and AMD stocks using a comprehensive methodology:
Preliminary Tests: An ARMA model was constructed to account for assumed autocorrelation in stock returns, confirmed by the Augmented Dickey-Fuller (ADF) test. The Ljung-Box test on the residuals indicated an ARCH effect.
GARCH Model Selection: Various GARCH models (GARCH(1,1), GARCH(2,1), GARCH(1,2), and GARCH(2,2)) were compared using the Akaike Information Criterion (AIC) and Bayesian Information Criterion (BIC). GARCH(2,2) was best for NVIDIA, while GARCH(2,1) was optimal for AMD. The Ljung-Box test validated these models.
EGARCH Model for Leverage Effects: The EGARCH (1,1) model revealed significant leverage effects, showing that negative shocks had a larger impact on future volatility than positive shocks.
DuPont Analysis: The ROE was decomposed into EPS and D/E Ratio using reports from 2020 to 2024. This provided insights into financial performance and leverage impact on ROE.
Regression Analysis: Multiple regression models, including Ridge Regression, Random Forest, Gradient Boosting, Support Vector Regression (SVR), and Multilayer Perceptron (MLP), were used to analyze the relationship between stock prices, EPS, and D/E Ratio. Gradient Boosting had the highest R-squared values for both NVIDIA and AMD, indicating excellent model fits. Consequently, the Gradient Boosting algorithm is detailed further:
Furthermore, to gain a deeper understanding of the model’s drivers, a sensitivity analysis was performed on EPS and D/E ratio. Partial Dependence Plots (PDP) were used to visualize the non-linear relationships between these financial indicators and the predicted stock prices, highlighting the impact of leverage and profitability on stock price forecasts.
The study generated risk heatmaps to illustrate the distribution of prediction uncertainties across a range of potential stock prices for NVIDIA and AMD. These heatmaps provide a visual summary of the prediction uncertainties and help investors and analysts gauge the risk associated with different price points.
This comprehensive methodological approach provides a detailed analysis of the factors influencing the volatility and financial performance of NVIDIA and AMD stocks, offering valuable insights for investors, financial analysts, and company executives.
3.Results and Discussion
3.1.Volatility Analysis
Firstly, it should be assumed that there is an existence of autocorrelation in stock returns, then paper builds an ARMA model and perform an ADF test, which is significant at the 95% interval, and performs a Ljung-box test on the residuals of the mean equation, which proves that there is an ARCH effect.
Table 2: Results of Ljung-Box Test.
|
Name |
Chi-squared |
p-value |
|
NVIDIA |
12.612 |
0.000383 |
|
AMD |
6.6471 |
0.009932 |
As shown in Table 2, the p-values of the ARCH effect test results of the autocorrelation functions of the stock returns of the two companies are both small, proving the existence of the ARCH effect, which can be fitted to its heteroskedasticity using GARCH. Therefore, the paper uses the GARCH to model the conditional heteroskedasticity. volatility up to moment t-s and the level of long-term volatility as control variables to fit the current level of volatility at moment t. And the white noise should be assumed:\( {a_{t}}={σ_{t}}{ε_{t}} \),in which\( {ε_{t}}~N(0,1) \). The formula is as follows:
\( σ_{t}^{2}={α_{0}}+\sum _{m=1}^{p}{α_{m}}u_{t-m}^{2}+\sum _{s=1}^{q}{β_{s}}σ_{t-s}^{2}\ \ \ (2) \)
In order to accurately model the volatility of NVIDIA and AMD stocks and due to the complexity of studying the fixed order, this paper chooses a low-order GARCH model and compares GARCH models of different orders, including GARCH(1,1), GARCH(2,1), GARCH(1,2) and GARCH(2,2). historical data are obtained from Kaggle for NVIDIA and AMD from 2 January 2020 to 5 April 2024 to calculate daily returns. Using the above data, the paper fits different GARCH models and compares their Akaike Information Criterion (AIC) and Bayesian Information Criterion (BIC).
Table 3: AIC and BIC of Different GARCH Models.
|
Name |
p |
q |
AIC |
BIC |
|
NVIDIA |
1 |
1 |
-4290.481475 |
-4270.576083 |
|
1 |
2 |
-4288.481476 |
-4263.599736 |
|
|
2 |
1 |
-4291.452994 |
-4266.571254 |
|
|
2 |
2 |
-4294.159666 |
-4264.301578 |
|
|
AMD |
1 |
1 |
-4278.773449 |
-4258.868057 |
|
1 |
2 |
-4276.773418 |
-4251.891678 |
|
|
2 |
1 |
-4279.914770 |
-4255.033029 |
|
|
2 |
2 |
-4276.843976 |
-4246.985887 |
Table 3 shows the numerical results for all AICs and BICs. This paper aims to fit the GARCH model without involving future forecasting, so the AIC is chosen as the main basis of judgement. The results show that for NVIDIA stock, the GARCH(2,2) model has the smallest value of AIC, which turned out to be -4294.159666, indicating that it performs best in fitting the data. Similarly, for AMD stock, the GARCH(2,1) model has the smallest AIC value as compared to the other models, which is -4279.914770 showing the best fit. Therefore, in this paper, by modelling the volatility of NVIDIA and AMD stocks, it was finally determined that the GARCH(2,2) model is best suited for the NVIDIA stock while the GARCH(2,1) model is best suited for the AMD stock. Further analyses of these models allow the paper to gain a deeper understanding of the stock volatility of these two companies and the factors that influence it. As showing in Figure 1, The conditional variance plots for NVIDIA and AMD demonstrate periods of high and low volatility, indicating the presence of volatility clustering.
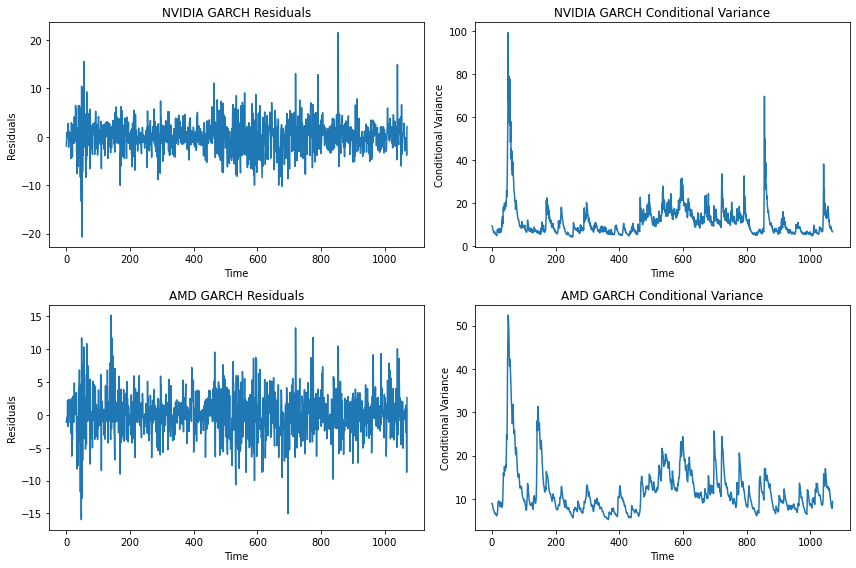
Figure 1: Daily Variance and Residuals of Two Companies by GARCH.
As shown in Figure 1, the daily variance and residuals of NVIDIA and AMD are well presented in this paper, which also lays a good foundation for our subsequent analysis. Using the above analysis information of the GARCH model, combined with the stock prices of NVIDIA and AMD in 2020-2024, the paper conducts regression analysis on all the data on python, and the following results are obtained.
Table 4: Results of GARCH Model for NVIDIA and AMD.
|
Name |
Parameter |
Coef |
Std.Err |
t |
P>\( |t| \) |
95.0% Conf.Int. |
|
NVIDIA |
omega |
0.7839 |
0.277 |
2.827 |
4.702e-03 |
[0.240,1.327] |
|
alpha [1] |
0.0410 |
3.897e-02 |
1.052 |
0.293 |
[-3.539e-02,0.117] |
|
|
alpha [2] |
0.1313 |
4.165e-02 |
3.152 |
1.622e-03 |
[4,964e-02,0.213] |
|
|
beta [1] |
0.1601 |
9.845e-02 |
1.626 |
0.104 |
[-3.284e-02,0.353] |
|
|
beta [2] |
0.6033 |
9.144e-02 |
6.598 |
4.179e-11 |
[0.424,0.782] |
|
|
nu |
6.7279 |
1.552 |
4.336 |
1.450e-05 |
[3.687,9.769] |
|
|
AMD |
omega |
0.4131 |
0.235 |
1.760 |
7.845e-02 |
[-4.699e-02,0.130] |
|
alpha [1] |
0.0257 |
3.057e-02 |
0.840 |
0.401 |
[-3.422e-02,0.130] |
|
|
alpha [2] |
0.0472 |
4.204e-02 |
1.122 |
0.262 |
[-3.524e-02,0.130] |
|
|
beta [1] |
0.8955 |
3.823e-02 |
23.427 |
2.285e-121 |
[0.821,0.970] |
|
|
nu |
5.4744 |
0.853 |
6.419 |
1.373e-10 |
[3.803,7.146] |
[1] Coefficients for the first lag term in the GARCH model.
[2] Coefficients for the second lag term in the GARCH model.
The Table 4 presents the GARCH model estimates for the daily returns of NVIDIA and AMD, revealing distinct volatility dynamics for these semiconductor giants. NVIDIA exhibits a higher long-term average volatility (ω\( = \)0.7839) compared to AMD (ω\( = \)0.4131). The α coefficients for both companies indicate a significant impact of past volatility on current levels, with NVIDIA showing a slightly greater sensitivity (α [1]\( = \)0.0410, α [2]\( = \)0.1313) than AMD (α [1]\( = \)0.0257, α [2]\( = \)0.0472). NVIDIA's beta coefficients (beta [1]\( = \)0.1601, beta [2]\( = \)0.6033) suggest weak volatility persistence, in contrast to AMD's strong persistence (beta [1]\( = \)0.8955), implying self-sustaining volatility for AMD.Both companies display thick tail characteristics in their stock return distributions, with ν coefficients significantly above zero (NVIDIA: 6.7279, AMD: 5.4744), indicating a higher probability of extreme volatility events than normal distribution assumptions would predict—a common trait in financial time series.
However, the paper finds that the plain old GARCH model was not enough, after observing that whether it is the observation that stock returns did not vary similarly across positive and negative scenarios, or the t-test for some parameters of the two stocks is not significant, which leads to the introduction of the EGARCH model with the following equation:
\( ln{(σ_{t}^{2})}={α_{0}}+\sum _{i=1}^{s}{α_{i}}\frac{|{α_{t-i}}|+{γ_{i}}{a_{t-i}}}{{σ_{t-i}}}+\sum _{j=1}^{m}{β_{j}}ln{σ_{t-j}^{2}}\ \ \ (3) \)
The EGARCH model is used to test for leverage effects. The paper uses the same AIC test to select the appropriate EGARCH model and finds that EGARCH (1, 1) is optimal for both NVIDIA and AMD with AIC values of-4393.439289 and -4338.464238. The paper fits the EGARCH model and obtains the following results.
Table 5: Results of EGARCH Model for NVIDIA and AMD.
|
Name |
Parameter |
Coef |
Std.Err |
t |
P>\( |t| \) |
95.0% Conf.Int. |
|
NVIDIA |
omega |
0.0871 |
2.913e-02 |
2.989 |
2.799e-03 |
[2.998e-02,0.144] |
|
alpha[1] |
0.1847 |
3.215e-02 |
5.744 |
9.221e-09 |
[0.122,0.248] |
|
|
beta[1] |
0.9652 |
1.176e-02 |
82.071 |
<e-09 |
[-5.248e-02,0.363] |
|
|
nu |
6.8894 |
1.613 |
4.272 |
1.934e-05 |
[3.729,10.050] |
|
|
AMD |
omega |
0.0835 |
3.489e-02 |
2.393 |
1.671e-02 |
[1.511e-02,0.152] |
|
alpha[1] |
0.1401 |
3.498e-02 |
4.004 |
6.237e-05 |
[7.150e-02,0.209] |
|
|
beta[1] |
0.9689 |
1.382e-02 |
70.093 |
<e-09 |
[0.942,0.996] |
|
|
nu |
5.3827 |
0.825 |
6.527 |
6.703e-11 |
[3.766,6.999] |
[1] Coefficients for the first lag term in the EGARCH model.
As shown in the Table 5, the p-value of each parameter is less than 0.05, proving that they are all significant and the model is well fitted The EGARCH model results for NVIDIA and AMD both shows significant asymmetry terms, indicating the presence of leverage effects. This suggests that negative shocks have a larger impact on future volatility than positive shocks of the same magnitude, confirming the presence of leverage effects in both stocks.
The following Figure 2 presents the results of an EGARCH analysis on the daily stock returns of two technology companies, NVIDIA and AMD. The top two panels display the EGARCH residuals and conditional variance for NVIDIA, while the bottom two panels show the same for AMD. These plots illustrate the time-varying volatility patterns in the stock returns, with the EGARCH model capturing the asymmetric impact of positive and negative shocks on the conditional variance, a key feature of financial time series data.
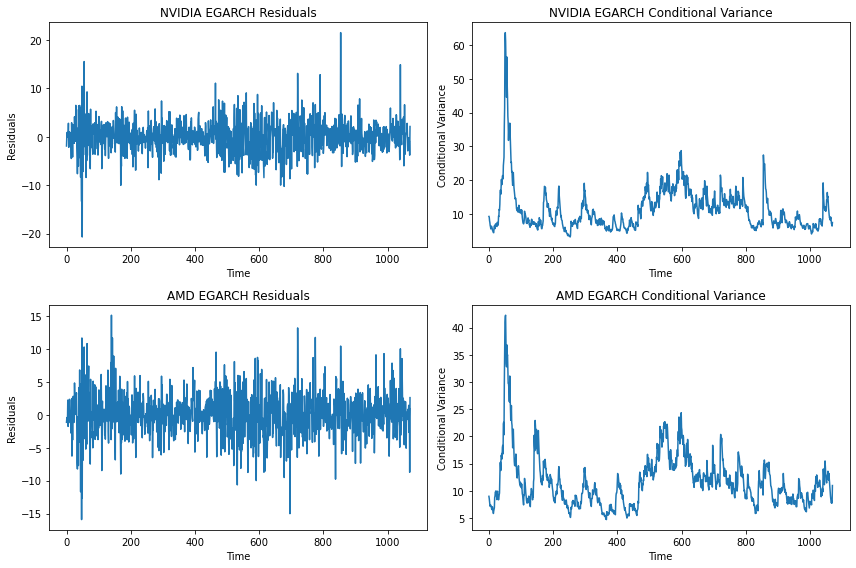
Figure 2: Daily Variance and Residuals of Two Companies by EGARCH.
The Figure 2 and Figure 1 above both draw Daily Variance and Residuals of Two Companies. Take the subgraph in the upper right corner of Figure 2, for example, it provides a visual analysis of the predicted volatility levels of NVIDIA's stock returns over time, as modeled by the EGARCH framework. It illustrates how conditional variance, depicted on the Y-axis, fluctuates in response to market dynamics, with each point representing the estimated volatility for a specific time period along the X-axis. The chart may reveal patterns such as volatility clustering, where periods of high or low volatility are observed to group together, and the leverage effect, where the stock's volatility reacts differently to negative versus positive shocks. This visualization is instrumental for financial analysts in assessing risk and making informed investment decisions related to NVIDIA's stock performance.
This paper tests the correctness of the distributional hypothesis using a quantile-to-quantile plot of\( \lbrace {\widetilde{a}_{t}}\rbrace \). This analysis is crucial for diagnosing potential model misspecifications and ensuring that the volatility dynamics are accurately captured without engaging incorrect distributional premises.
3.2.DuPont Analysis and Leverage Ratio Decomposition
To understand the impact of different financial variables on stock volatility, a DuPont analysis is conducted by decomposing the Return on Equity (ROE) into its constituent parts: Earnings Per Share (EPS) and Debt-to-Equity Ratio (D/E Ratio).
This study applies the DuPont V decomposition formula:
\( ROE=\frac{NI}{EBT}×\frac{EBT}{EBIT}×\frac{EBIT}{revenue}×\frac{revenue}{Ave asset}×\frac{Ave asset}{Ave equity}\ \ \ (4) \)
using the quarterly and annual reports of AMD and NVIDIA for the years 2020-2024, to derive each value for each year, summaries them on EXCEL and makes images. The image results are shown in Figure 3.
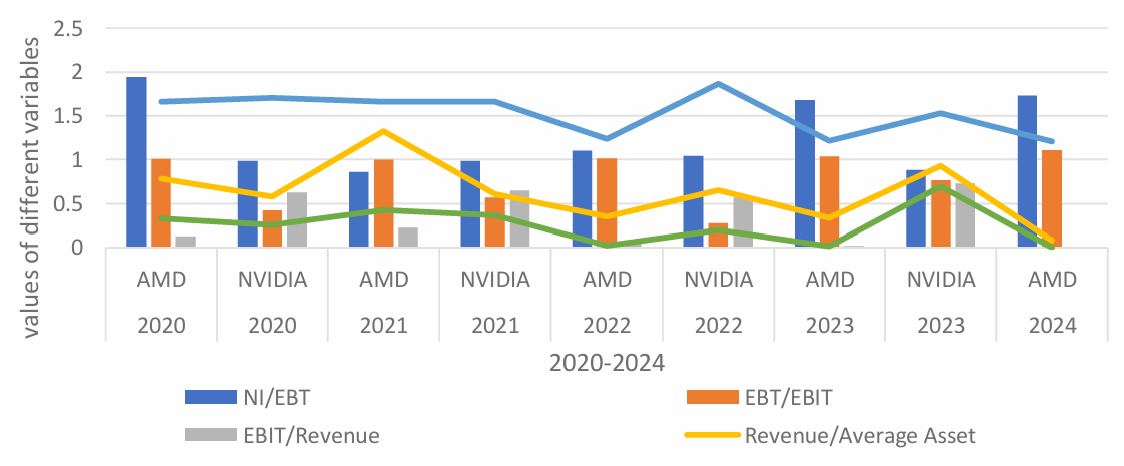
Figure 3: Financial Metrics Comparison for AMD and NVIDIA (2020-2024)
So some preliminary results are got in the paper, ROE and AOE are closely related, and D/E ratio is equal to (AOE-1). Based on the observation that D/E ratio and ROE are related, and ROE also affects EPS, correlation matrix is carried out:
Table 6: Results of DuPont Analysis.
|
Name |
Parameter |
EPS |
DERatio |
ROE |
|
NVIDIA |
EPS |
1 |
-0.461715 |
0.998438 |
|
DERatio |
-0.461715 |
1 |
-0.427695 |
|
|
ROE |
0.998438 |
-0.427695 |
1 |
|
|
AMD |
EPS |
1 |
0.303870 |
0.993090 |
|
DERatio |
0.303870 |
1 |
0.376308 |
|
|
ROE |
0.993090 |
0.376308 |
1 |
As Table 6 shows, For NVIDIA, the correlation matrix showed a strong positive correlation (0.998438) between EPS and ROE, indicating that EPS is a major driver of ROE. There is a moderate negative correlation (-0.461715) between EPS and D/E Ratio, suggesting that as EPS increases, D/E Ratio tends to decrease, which might indicate better profitability leading to lower leverage. The correlation between D/E Ratio and ROE is also moderately negative (-0.427695), implying that higher leverage might adversely affects the ROE, possibly due to increased financial risk.
Also, For AMD, the correlation between EPS and ROE is also very strong (0.99309), underscoring the significant influence of EPS on ROE. The correlation between EPS and D/E Ratio is weaker (0.303870), indicating a less pronounced relationship comparing to NVIDIA. Interestingly, the correlation between D/E Ratio and ROE is positive (0.376308), suggesting that for AMD, higher leverage might contribute to higher ROE, potentially due to the firm's effective use of debt to generate returns.
These findings highlight the different impacts of financial leverage on NVIDIA and AMD. While NVIDIA's ROE is adversely affected by higher leverage, AMD's ROE benefits from it, suggesting different risk management and capital structure strategies between the two companies.
3.3.Stock Price Prediction and Risk Analysis
From the above two premises, it is obvious that both D/E ratio and EPS are related to stock price, which the paper takes stock price as constraint variable and stock price as dependent variable to carry out the following regression analysis.
The paper performs multiple regression analyses to quantify the relationships between Based on the principle of machine learning, this paper first selects five regression models, ridge regression, random forest, gradient enhancement, support vector regression (SVR) and multi-layer perceptron (MLP), to select the best regression model. The selection is based on using the selected model to predict the test set after cross-validation scores are performed on the training set. The R-squared value between the predicted value and the actual value is calculated, and a suitable model is selected by observing the R-squared value for the following predictive analysis.
Table 7: Results of Five Different Regression Analyses.
|
Name |
Index |
Ridge |
Random Forest |
Gradient Boosting |
SVR |
MLP |
|
|
NVIDIA |
R-squared |
0.777379 |
0.953024 |
0.957923 |
0.148879 |
0.687070 |
|
|
AMD |
R-squared |
0.713148 |
0.906121 |
0.919407 |
0.124232 |
0.559489 |
|
Table 7 shows that the Gradient Boosting model yielded the highest R-squared values for NVIDIA (0.957923) and AMD (0.919407), indicating excellent model fits. The high R-squared values suggest that the selected variables (EPS and D/E Ratio) explain a substantial portion of the variance in stock prices. According to the R-squared in the Table 6, The paper chooses Gradient Boosting model as the best models of NVIDIA and AMD.
Using the best models to predict future stock prices is the next important task. The steps are as follows: Utilizing the available stock data, perform the same feature engineering that the model predicts. The trained model is used to predict the new data, and then compared with the actual data to verify the generalization ability of the model to the data.
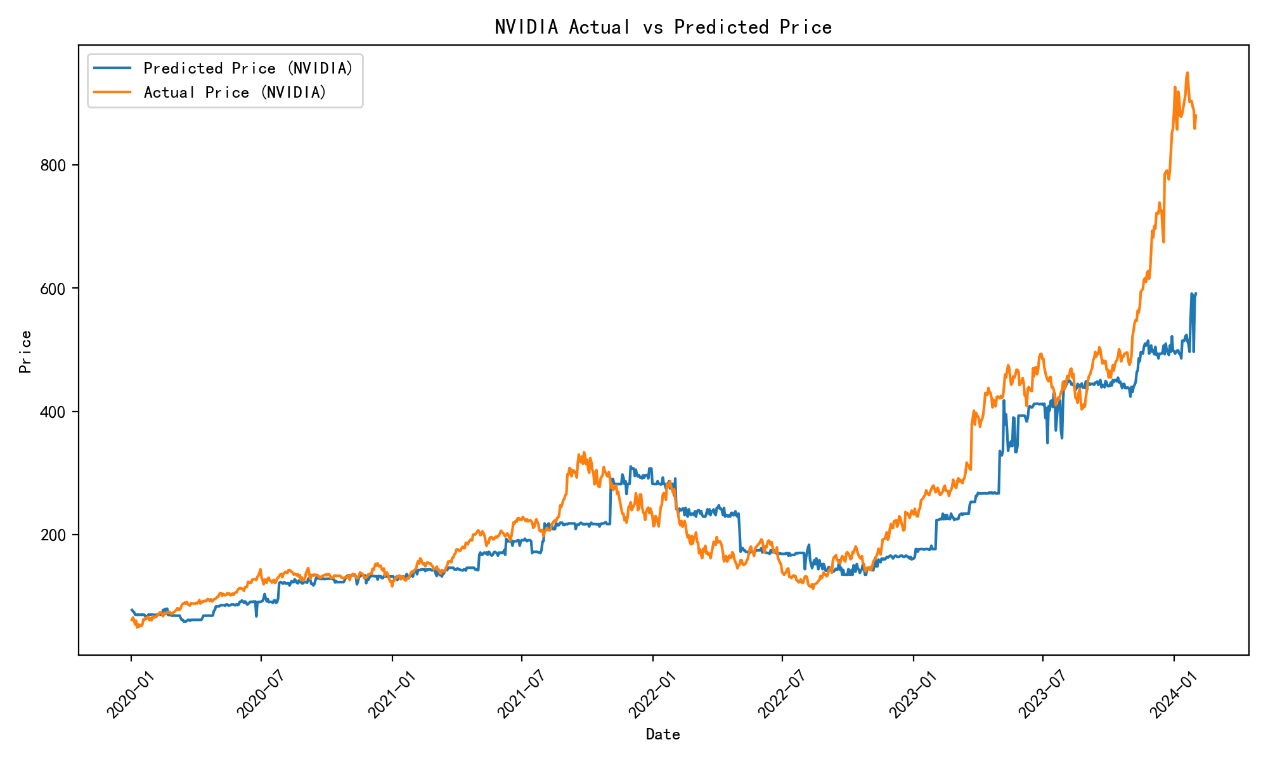
Figure 4: The Comparison Between Predicted and Actual Price of NVIDIA.
The Figure 4 shows a line graph comparing the actual price of NVIDIA stock with a predicted price for the period from 2020 to 2024. The graph shows that the predicted price has tracked the actual price reasonably well over this time period, but the predicted price is slightly lower than the actual price. The difference between the two lines is largest in the first half of 2023.
Analysis of the stock prices in 2023 indicates that unexpected market fluctuations or company-specific events may have contributed to the discrepancies between predicted and actual prices. This highlights the need for the model to account for sudden market shocks or changes in investor sentiment which were not fully captured during this period.
The observed discrepancies between predicted and actual stock prices from July 2023 to January 2024 can be attributed to several factors. One significant factor is the impact of market volatility and unexpected external shocks, which are not always fully captured by the predictive model. For instance, during this period, NVIDIA might have experienced unexpected market events such as supply chain disruptions, regulatory changes, or technological advancements that influenced investor sentiment and stock prices more than anticipated.
Moreover, existing literature suggests that rapid technological advancements and market dynamics in the technology sector can lead to substantial deviations in stock price predictions. According to Aggarwal and Samwick (2003), the technology industry faces unique challenges and opportunities, which can cause significant volatility in stock prices due to innovation cycles and market competition[9]. Additionally, the study by Braun et al. (1995) highlights that bad news and negative market shocks tend to have a larger impact on stock volatility compared to positive news, further explaining the larger discrepancies during market downturns[11].
These findings emphasize the need for predictive models to incorporate more dynamic factors and real-time data to improve accuracy. Incorporating sentiment analysis, real-time market data, and adjusting for unexpected shocks could enhance the model’s predictive capability, reducing discrepancies between predicted and actual stock prices.
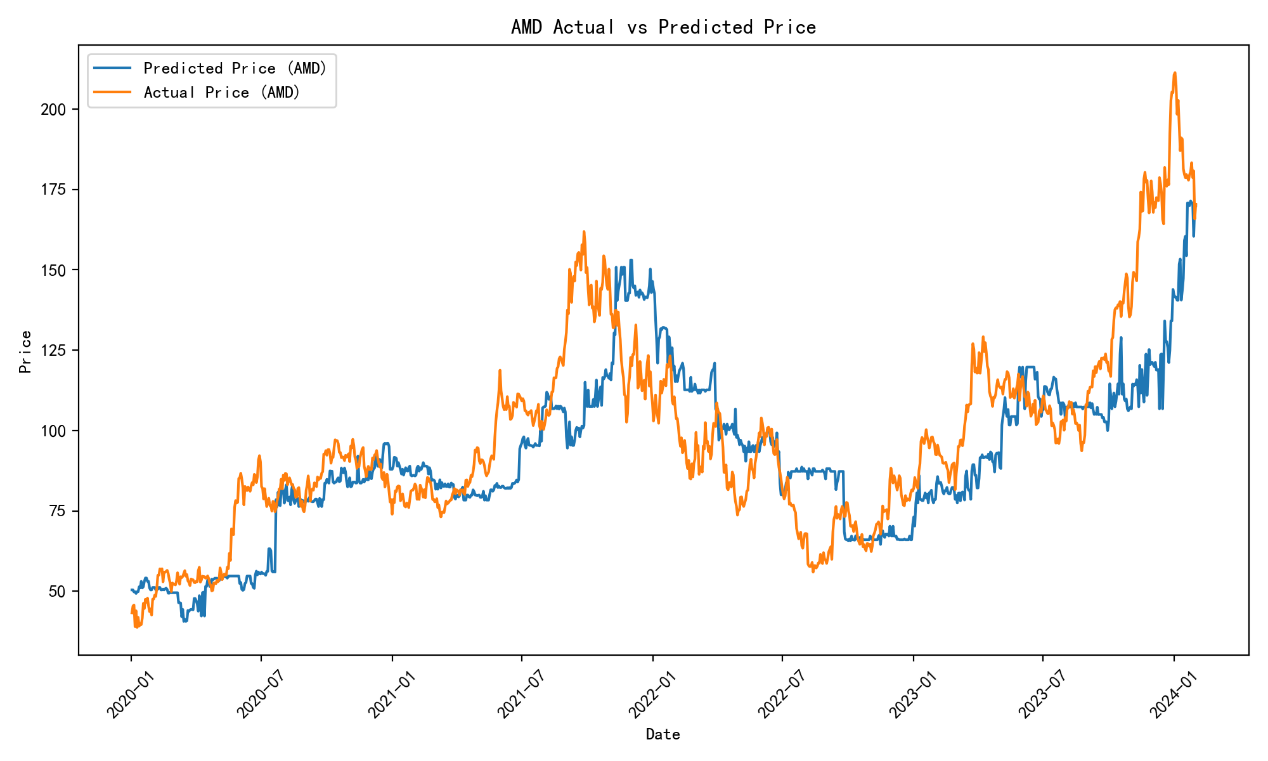
Figure 5: The Comparison Between Predicted and Actual Price of AMD.
The Figure 5 shows the actual and predicted stock price of AMD from 2020 to 2024. The blue line represents the predicted price, while the orange line represents the actual price. Generally, the predicted price tracks the actual price fairly well, though it consistently underestimates the actual price. The largest difference between the two lines occurs during the first half of 2023. The consistent underestimation of AMD's stock price suggests that the model may not fully incorporate the rapid technological advancements or strategic decisions that positively influenced AMD's market performance in this period. This calls for a review and potential adjustment of the model inputs to better reflect real-time advancements and strategic milestones.
To gain a deeper understanding of the drivers of the model, we will perform a sensitivity analysis of EP and D/E Ratio. The specific steps are as follows:
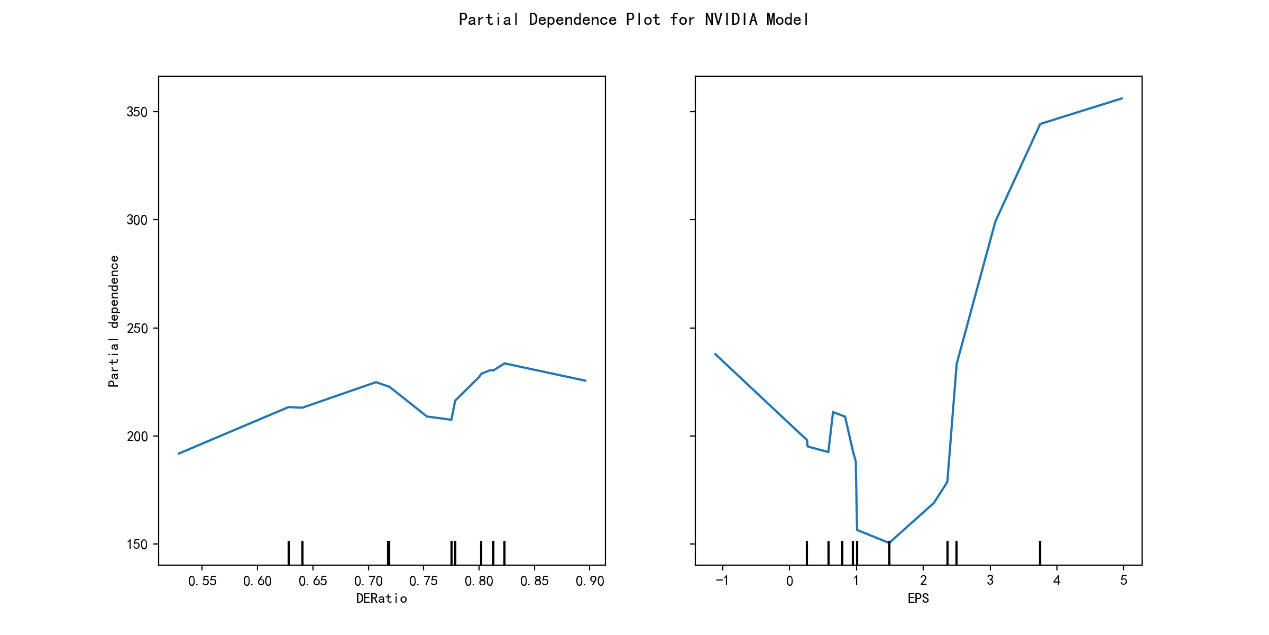
Figure 6: The Partial Dependence Plot (PDP) for NVIDIA Model
The Figure 6 shows the Partial Dependence Plot (PDP) for the NVIDIA model, which succinctly captures the non-linear relationship between the company's D/E Ratio and the predicted stock price. As D/E Ratio increases from 0.55 to approximately 0.75, there is a positive trend, suggesting that higher leverage, within a certain range, is associated with higher stock price predictions by the model. However, beyond this point, the trend reverses, indicating that excessive leverage may lead to a decrease in predicted stock prices, reflecting the model's recognition of the risk associated with high debt levels. The PDP for EPS is incomplete, but it is implied that similar non-linear dynamics are at play. This visualization underscores the model's sensitivity to financial indicators and the potential for leverage and profitability to significantly influence stock price predictions, albeit with complex interactions that are not fully captured in this truncated representation.
The analysis aligns with existing literature which suggests that moderate leverage can enhance a company's market value by leveraging debt for growth, but excessive leverage increases financial risk, potentially leading to investor caution and lower stock prices. This relationship underscores the importance of optimizing capital structure to balance growth opportunities and financial stability.
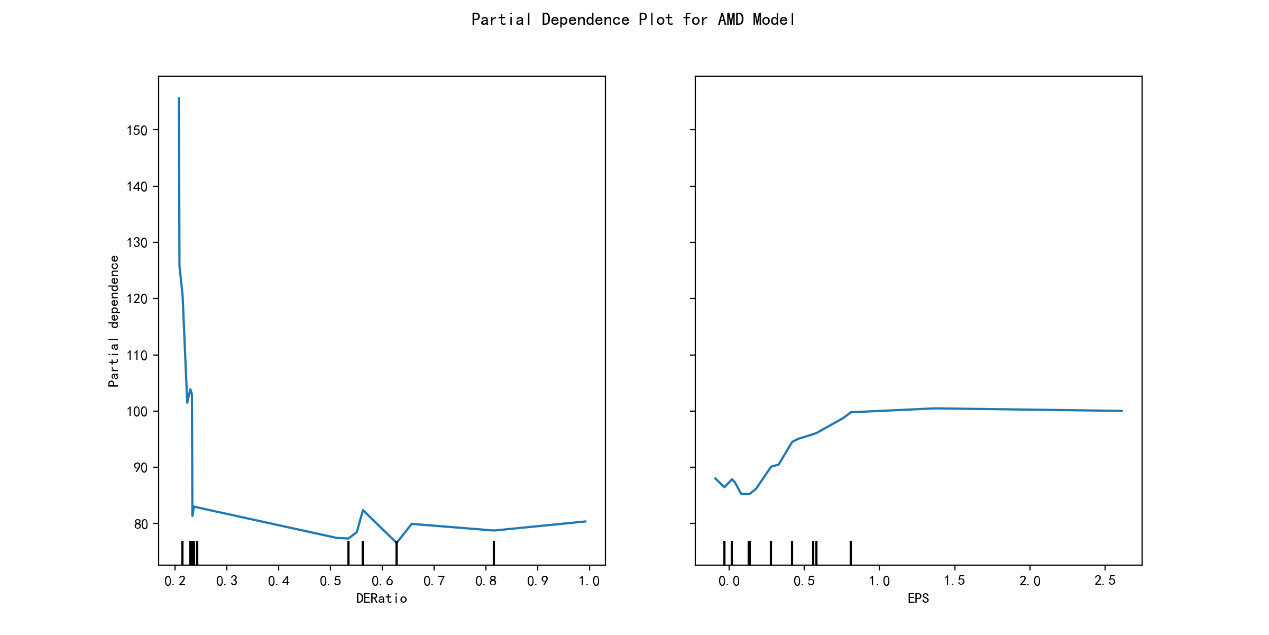
Figure 7: The Partial Dependence Plot (PDP) for AMD Model.
The Figure 7 shows the PDP for the AMD model, which delineates the intricate relationship between the D/E Ratio and EPS with the predicted stock price. The PDP reveals a nuanced trend for D/E Ratio, where moderate levels of leverage (between 0.3 and 0.7) are linked to an increase in predicted stock prices, potentially indicating a 'sweet spot' for investor confidence and company health. Beyond this range, the effect plateaus, suggesting that extreme leverage does not significantly alter the model's predictions. For EPS, the plot suggests a positive correlation with stock price predictions, with higher EPS values consistently associated with higher predicted prices, reflecting the direct impact of profitability on investor outlook. This analysis highlights the model's ability to discern the financial health and market potential of AMD, emphasizing the importance of a balanced capital structure and robust earnings for favorable stock price forecasts.
These findings are corroborated by financial studies indicating that investor sentiment is strongly influenced by EPS and moderate leverage. The plateauing effect at high leverage levels suggests that while debt can be used to fuel growth, its benefits diminish beyond a certain threshold, highlighting the need for prudent financial management. The stock price fluctuations predicted by the model can help enterprises and investors to manage risk. This paper draws a heat map of risk, showing the fluctuations of stock prices under different market conditions.
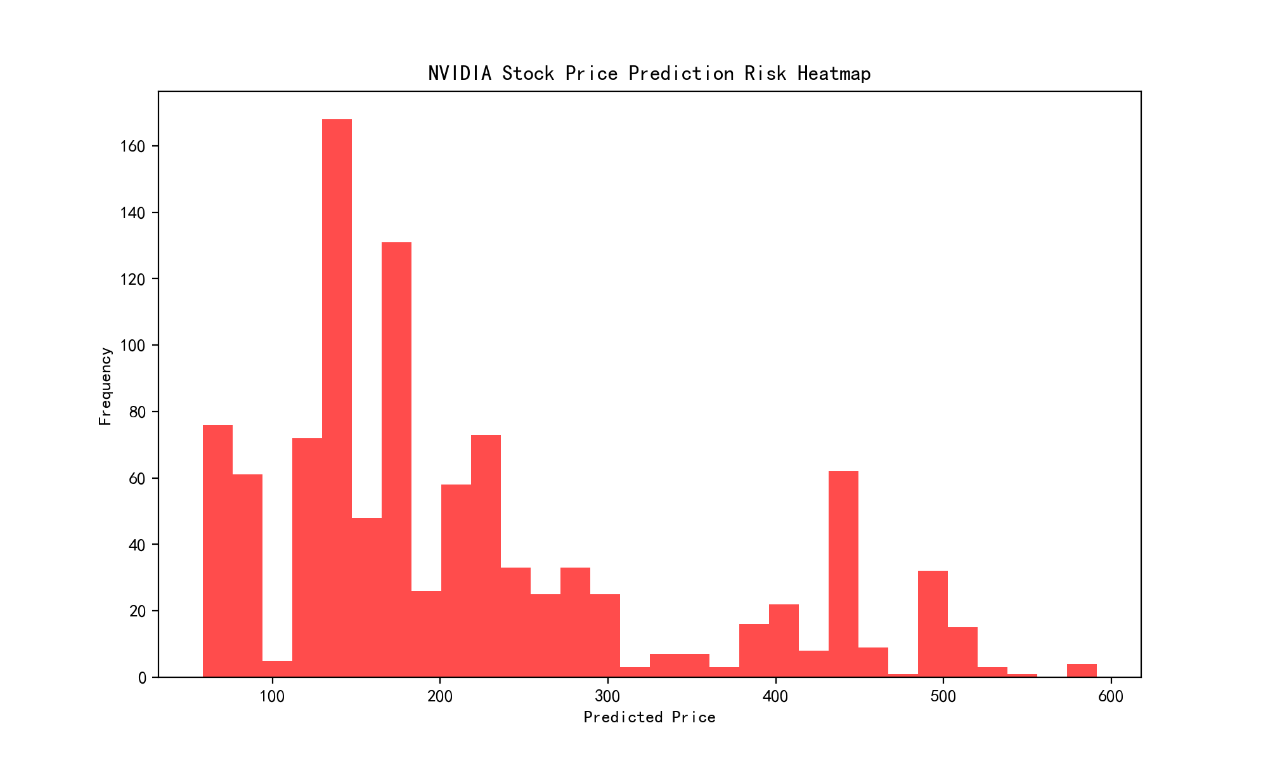
Figure 8: The NVIDIA Stock Price Prediction Risk Heatmap.
The Figure 8 shows that the NVIDIA Stock Price Prediction Risk Heatmap vividly illustrates the distribution of prediction uncertainties across a range of potential stock prices. With a concentration of predictions between $100 and $600, the heatmap underscores a broad spectrum of possible outcomes, reflecting the inherent volatility and unpredictability of the stock market. The density of the coloration within this range indicates areas of higher confidence in the model's predictions, while sparser regions suggest greater variability and caution. This visual representation serves as a critical tool for investors and analysts to gauge the risk associated with different price points, highlighting the necessity for a nuanced approach when interpreting stock price forecasts.
The risk heatmap reveals that most price predictions cluster around $250-$350, suggesting a higher degree of confidence in this price range. This insight is valuable for risk management, as it directs investor attention to the most probable price outcomes, aiding in strategic decision-making and portfolio management.
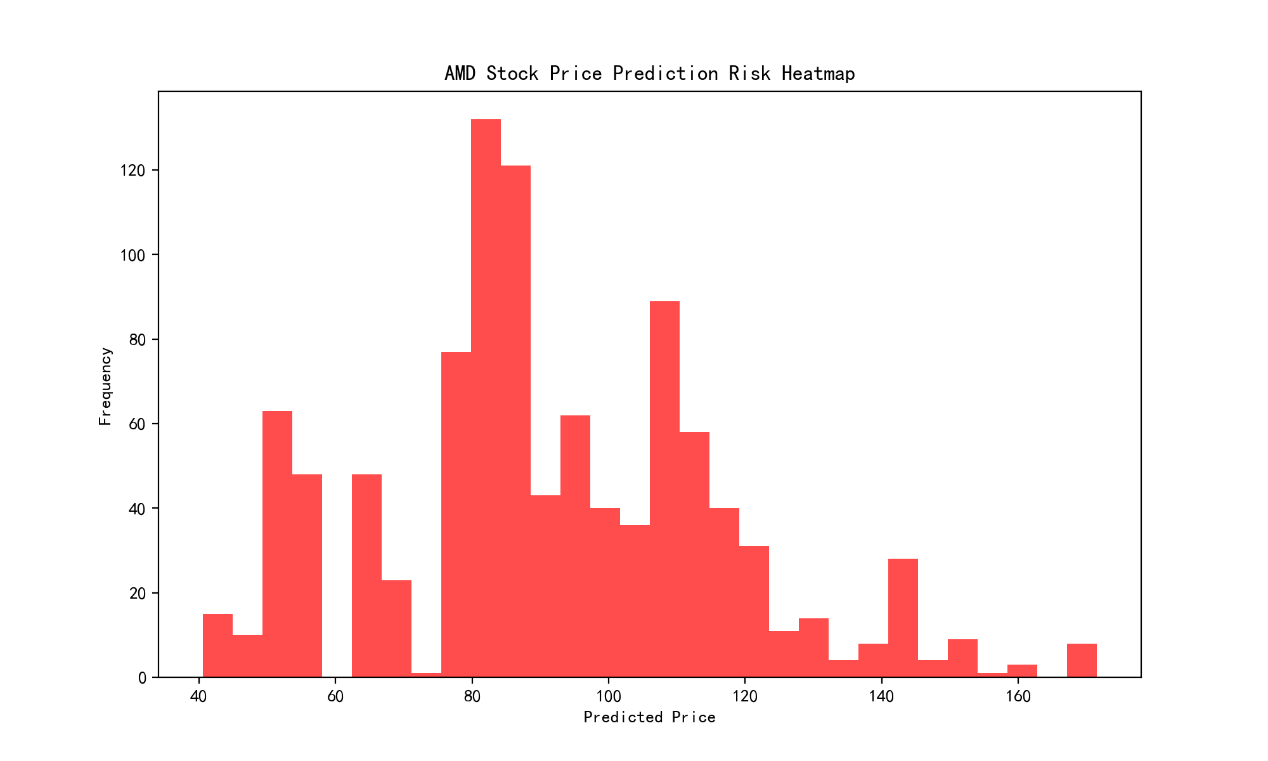
Figure 11: The AMD Stock Price Prediction Risk Heatmap.
The Figure 11 shows that the AMD Stock Price Prediction Risk Heatmap provides a compelling visual summary of the prediction uncertainties for AMD's stock prices, indicating a focused range of potential values between $40 and $160. The heatmap's intensity suggests a higher concentration of predictions within the mid-range, with diminishing probabilities towards the extremes, which may imply a more confident forecast within this central zone. This pattern could reflect a market perception of AMD's stock as relatively stable with limited volatility, offering a clearer risk profile for investors to assess. The heatmap serves as a valuable guide for decision-making, emphasizing the areas of greater consensus in the predictive model's outlook for AMD's stock price.
The concentration of predictions around $80-$120 suggests that investors and analysts see this range as the most probable and stable for AMD, indicating confidence in the company's consistent performance and market position. This information can help investors tailor their strategies to focus on the most likely price outcomes, optimizing their risk-return profile.
In summary, this study’s methodology and results have several novel aspects when compared to existing literature:
1.Integration of Dynamic Factors: This research not only utilizes traditional GARCH models but also introduces EGARCH models to capture leverage effects and asymmetry in volatility. This approach significantly enhances the understanding of the volatility of NVIDIA and AMD stock prices. In contrast, existing literature such as Aggarwal and Samwick (2003) focuses more on the impact of rapid innovation and market competition on stock price volatility in the technology sector [9].
2.Application of Multiple Regression Analyses: This study employs various regression models, including Ridge Regression, Random Forest, Gradient Boosting, and others, to analyze the impact of EPS and D/E ratio on stock prices, ultimately selecting the Gradient Boosting model as the optimal one. This multi-model comparison approach is less commonly seen in existing literature, where studies like Braun et al. (1995) tend to focus on single model applications [11].
3.Sensitivity Analysis and Risk Heatmaps: This research further analyzes the nonlinear relationships between financial indicators and stock price predictions using Partial Dependence Plots (PDP) and risk heatmaps. This visualization approach provides investors with intuitive risk assessment tools, helping to better understand the drivers and uncertainties of predictive models. This is relatively novel in existing literature and offers more practical investment guidance.
Overall, by comprehensively using advanced volatility models, multiple regression analyses, and sensitivity analysis, this study not only enhances the understanding of stock price volatility in the GPU industry but also provides investors with new tools and methods for risk assessment. These novel aspects complement the existing literature and contribute significantly to the advancement of the research field.
4.Conclusion
This research offers an in-depth analysis of the linkage between EPS, D/E ratio, and stock performance within the GPU industry, with a spotlight on NVIDIA and AMD. The study's application of advanced volatility models, particularly the EGARCH model, in conjunction with sophisticated machine learning techniques, has led to the identification of several pivotal findings.
The EPS is found to have a robust positive correlation with stock prices for both companies, highlighting the central role of profitability in stock market valuation. The influence of financial leverage, as indicated by the D/E ratio, is more nuanced, revealing different risk management strategies between NVIDIA and AMD. NVIDIA's data suggests a negative correlation between EPS and D/E ratio, implying a tendency toward lower financial risk with increased profitability. Conversely, AMD displays a positive correlation between the D/E ratio and ROE, indicating that higher leverage may enhance returns and contribute to shareholder value.
Further, The Gradient Boosting model, selected based on its superior R-squared values, has proven adept at capturing the variance in stock prices, underscoring the predictive validity of EPS and D/E ratio as financial indicators. Sensitivity analysis and the generation of risk heatmaps further elucidate the impact of financial indicators on stock price predictions, providing strategic tools for risk assessment and decision-making in financial planning and investment.
The study's findings contribute to the existing body of knowledge by shedding light on the unique financial strategies and risk profiles of NVIDIA and AMD. The insights provided are valuable for investors and executives in making informed investment choices and formulating financial strategies within the dynamic landscape of the GPU industry.
Ultimately, the research underscores the significance of understanding the interplay between EPS, D/E ratio, and stock performance, offering a nuanced perspective on financial dynamics within the technology sector and highlighting the importance of tailored approaches to capital structure and risk management.
Authors Contribution
Each author made an equal contribution, and their names were listed alphabetically.
References
[1]. WANG Xia, MA Rui. Research on the Influence of Leverage Ratio on Stock Market Stabiliy in China. China Securities Futures, 2024(01): 53-65. DOI: 10.19766/j.cnki.zgzqqh.2024.2.007.
[2]. ZHANG Guangsheng, SUN Xuetao. Relationship between Corporate Leverage Ratio and Economic Efficiency Improvement against the Background of Digital Transformation. Jinan Journal (Philosophy and Social Sciences Edition), 2023, 45(05): 115-132.
[3]. Oded, Jacob, & Allen, Michel. (2008). “Stock Repurchases and the EPS Enhancement Fallacy.” Financial Analysts Journal, 64(4): 62–75. doi:10.2469/faj.v64.n4.6.
[4]. Miller, Merton H., & Modigliani, Franco. (1967). “Some Estimates of the Cost of Capital to the Electric Utility Industry: 1954-57: Reply.” American Economic Review, 57(5): 1288. https://search.ebscohost.com/login.aspx?direct=true&db=buh&AN=4497741&lang=zh-cn&site=ehost-live.
[5]. Jensen, Michael C., & Meckling, William H. (1978). “Can the Corporation Survive?” Financial Analysts Journal, 34(1): 31–37. doi:10.2469/faj.v34.n1.31.
[6]. Braun, Phillip A., Nelson, Daniel B., & Sunier, Alain M. (1995). “Good News, Bad News, Volatility, and Betas.” Journal of Finance (Wiley-Blackwell), 50(5): 1575–1603. doi:10.1111/j.1540-6261.1995.tb05189.x.
[7]. Glosten, Lawrence R., & Harris, Lawrence E. (1988). “Estimating the Components of the Bid/Ask Spread.” Journal of Financial Economics, 21(1): 123–42. doi:10.1016/0304-405X(88)90034-7.
[8]. Bollerslev, Tim. (2023). “The Story of GARCH: A Personal Odyssey.” Journal of Econometrics, 234(March): 96–100. doi:10.1016/j.jeconom.2023.01.015.
[9]. Hastie T, Tibshirani R, Friedman J. The Elements of Statistical Learning: Data Mining, Inference, and Prediction[M]. Berlin: Springer, 2009.
[10]. Aggarwal, Rajesh K., & Samwick, Andrew A. (2003). “Performance Incentives within Firms: The Effect of Managerial Responsibility.” Journal of Finance (Wiley-Blackwell), 58(4): 1613–50. doi:10.1111/1540-6261.00579.
[11]. Braun, P. A., Nelson, D. B., & Sunier, A. M. (1995). “Good News, Bad News, Volatility, and Betas.” Journal of Finance, 50(5), 1575–1603. doi:10.1111/j.1540-6261. 1995.tb05189.x.
Cite this article
Song,R.;Xing,S.;Yang,Y. (2024). Impact of Net Earnings per Share and Leverage on Stock Prices. Advances in Economics, Management and Political Sciences,127,58-72.
Data availability
The datasets used and/or analyzed during the current study will be available from the authors upon reasonable request.
Disclaimer/Publisher's Note
The statements, opinions and data contained in all publications are solely those of the individual author(s) and contributor(s) and not of EWA Publishing and/or the editor(s). EWA Publishing and/or the editor(s) disclaim responsibility for any injury to people or property resulting from any ideas, methods, instructions or products referred to in the content.
About volume
Volume title: Proceedings of ICFTBA 2024 Workshop: Finance in the Age of Environmental Risks and Sustainability
© 2024 by the author(s). Licensee EWA Publishing, Oxford, UK. This article is an open access article distributed under the terms and
conditions of the Creative Commons Attribution (CC BY) license. Authors who
publish this series agree to the following terms:
1. Authors retain copyright and grant the series right of first publication with the work simultaneously licensed under a Creative Commons
Attribution License that allows others to share the work with an acknowledgment of the work's authorship and initial publication in this
series.
2. Authors are able to enter into separate, additional contractual arrangements for the non-exclusive distribution of the series's published
version of the work (e.g., post it to an institutional repository or publish it in a book), with an acknowledgment of its initial
publication in this series.
3. Authors are permitted and encouraged to post their work online (e.g., in institutional repositories or on their website) prior to and
during the submission process, as it can lead to productive exchanges, as well as earlier and greater citation of published work (See
Open access policy for details).
References
[1]. WANG Xia, MA Rui. Research on the Influence of Leverage Ratio on Stock Market Stabiliy in China. China Securities Futures, 2024(01): 53-65. DOI: 10.19766/j.cnki.zgzqqh.2024.2.007.
[2]. ZHANG Guangsheng, SUN Xuetao. Relationship between Corporate Leverage Ratio and Economic Efficiency Improvement against the Background of Digital Transformation. Jinan Journal (Philosophy and Social Sciences Edition), 2023, 45(05): 115-132.
[3]. Oded, Jacob, & Allen, Michel. (2008). “Stock Repurchases and the EPS Enhancement Fallacy.” Financial Analysts Journal, 64(4): 62–75. doi:10.2469/faj.v64.n4.6.
[4]. Miller, Merton H., & Modigliani, Franco. (1967). “Some Estimates of the Cost of Capital to the Electric Utility Industry: 1954-57: Reply.” American Economic Review, 57(5): 1288. https://search.ebscohost.com/login.aspx?direct=true&db=buh&AN=4497741&lang=zh-cn&site=ehost-live.
[5]. Jensen, Michael C., & Meckling, William H. (1978). “Can the Corporation Survive?” Financial Analysts Journal, 34(1): 31–37. doi:10.2469/faj.v34.n1.31.
[6]. Braun, Phillip A., Nelson, Daniel B., & Sunier, Alain M. (1995). “Good News, Bad News, Volatility, and Betas.” Journal of Finance (Wiley-Blackwell), 50(5): 1575–1603. doi:10.1111/j.1540-6261.1995.tb05189.x.
[7]. Glosten, Lawrence R., & Harris, Lawrence E. (1988). “Estimating the Components of the Bid/Ask Spread.” Journal of Financial Economics, 21(1): 123–42. doi:10.1016/0304-405X(88)90034-7.
[8]. Bollerslev, Tim. (2023). “The Story of GARCH: A Personal Odyssey.” Journal of Econometrics, 234(March): 96–100. doi:10.1016/j.jeconom.2023.01.015.
[9]. Hastie T, Tibshirani R, Friedman J. The Elements of Statistical Learning: Data Mining, Inference, and Prediction[M]. Berlin: Springer, 2009.
[10]. Aggarwal, Rajesh K., & Samwick, Andrew A. (2003). “Performance Incentives within Firms: The Effect of Managerial Responsibility.” Journal of Finance (Wiley-Blackwell), 58(4): 1613–50. doi:10.1111/1540-6261.00579.
[11]. Braun, P. A., Nelson, D. B., & Sunier, A. M. (1995). “Good News, Bad News, Volatility, and Betas.” Journal of Finance, 50(5), 1575–1603. doi:10.1111/j.1540-6261. 1995.tb05189.x.