


1. Introduction
Environmental indices play a crucial role in determining a company's financial performance. With increasing awareness of environmental issues and growing concerns about sustainability, investors and consumers are paying closer attention to how companies manage their environmental impact. Companies that effectively measure and manage their environmental performance not only contribute to a healthier planet but also tend to exhibit stronger financial performance. Studies by Plumlee et al [1] and Lancee [2] have shown that companies with strong environmental performance often outperform their peers in terms of profitability and long-term financial sustainability. This is because efficient resource management, reduced waste, and lower energy consumption not only reduce costs but also enhance brand reputation, attract environmentally conscious customers, and mitigate regulatory risks. Therefore, integrating environmental metrics into corporate strategies and decision-making processes is essential for achieving long-term financial success and maintaining competitive advantage in today's business environment.
Derived from the concept of sustainable development and the associated United Nations’ sustainable development goals, corporate sustainability measures the ethical, environmental, social, economic, and cultural aspects of performance of business, especially the non-financial areas of a company. As sustainability is increasingly being emphasized globally, companies must make efforts on these aspects in order to increase reputation, mitigate risks, sustain profits, attract investments, retain clients and acquaintances or else. One important indicator to assess a company’s corporate sustainability is the Environmental, Social and Governance (ESG) score which is comprised of three aspects of Environment, Social and Governance, and is primarily evaluated by third-parties. ESG scores are calculated by adding weights to various smaller indicators such as energy use, waste management (environmental), human rights, employee benefits (social), business ethics, partnership (governance) etc, and is therefore sometimes a subjective measure.
Nevertheless, it is believed to have significant impacts on a company’s financial performances and sustainability amid previous studies. Friede and colleagues [3] stated that investigations into the correlation between ESG criteria and corporate financial prosperity started in the 1970s. Following an examination of 2200 papers, they asserted that the findings support the justification for ESG investment, with approximately 90% of the studies indicating a positive association between ESG factors and company financial performance. Of two other papers which included more than 1000 firms, Mahmut et al. [4] concluded that the combined ESG score, the social aspect and the governance aspect have a strong positive relationship with companies’ value, but the Environmental aspect has no apparent relationship; Whelan et al. [5] examined over 1000 papers released from 2015 to 2020, concentrating on the connection between ESG and financial performance. It is revealed that 58% of the papers identified a favorable correlation between ESG and financial performance, while 8% observed a negative correlation, 13% found no discernible relationship, and 21% reported mixed outcomes, concluding that despite the prevalence of positive findings, the results highlight continued disagreement, supported by Buallay’s study [6] that ESG may overall affect financial and operational performance negatively.
As ESG score is overall suggested to be connected with a company’s profitability, this paper first validates this agreement by choosing the top 10 US companies for analysis whether this conclusion still applies for grand business. Then, the paper mainly focuses on the environmental aspects influencing the ESG score, which is a little-known and controversial aspect, as most previous studies like the one by Sunarti et al. [7] focus on relationships between ROA, ROE and other return measures. The sub-factors under this category are examined and the ones that influence the ESG score the most are chosen. Specifically, the two hypotheses below would be tried to be proved valid or wrong.
Hypothesis 1: ESG scores are positively related to a company’s financial performances.
Hypothesis 2: Different environmental impact indicators of a company have different weights on ESG scores.
Suggestions are provided after the results section to firms according to the results for effectively improving their ESG scores.
2. Methodology
For simplicity and representational purposes of large companies, this research focuses on the top 10 US companies’ (ranked by market capitalization by CompaniesMarketCap [8]) ESG score and pertinent environmental aspect indices and relates them to their financial performances in 2021. After literature reviews in the previous section, data required are collected in each company’s annual sustainability report with unrevealed indices further searched in other official sources. Data analysis software such as R and Matlab are then used to find relationships between data sets to provide evidence for or against the hypothesis.
The indices selected are the ones that frequently appear on companies’ sustainability reports, and they are also likely to be taken into account for the environmental aspect of ESG score calculation. For simplicity, common environmental and sustainability indicators like equivalent carbon emission, total energy consumption, ESG score etc. and common financial performance indicators such as total revenue, net income, return on assets etc. are considered in this study (see Table 1). ESG scores were collected from Sustainalytics [9] while all other data were retrieved from companies’ sustainability reports or their official websites, refer to Table 2. The variables are listed and explained as follows. Data are rounded to their nearest integer in tables, but precise values are used in analysis.
Table 1: Variables studied, their code name, unit and respective explanation
Variable | Variable code name | Unit | Variable explanation |
Equivalent Carbon Emission | CE | million metric tons | The quantity of CO2 emissions produced by a company annually, equivalent to the global warming potential of one metric ton of other greenhouse gasses. |
Total Energy Consumption | TEC | megawatt hours | The total amount of energy used by a company in one fiscal year, measured in megawatt hours. |
Proportion of Renewable Energy | PRE | % | the percentage of renewable energy of total energy used. A higher PRE indicates that the company is more sustainable in the aspect of energy sources. |
Waste Diversion Rate | WDR | % | The proportion of waste that is not incinerated or deposited in landfills, indicating sustainability. Consequently, it plays a significant role in assessing a company's sustainability, particularly when waste can be recycled or managed using environmentally friendly methods. |
Energy Intensity | EI | MWh / billion $ revenue | The ratio of total energy consumption (TEC) to the total revenue of a company. |
Carbon Intensity | CI | ton CO2e / $ revenue | The ratio of equivalent carbon emission (ECE) to the total revenue of a company. |
Environmental, Social and Governance score | ESG | Score | On the scale of 0-40, a higher value of ESG score indicates that the company is exposed to more risk regarding the three aspects. It is post-calculated by third-party organizations, in this paper the scores from sustainalytics are used. https://www.sustainalytics.com/esg-ratings |
Total Revenue | TR | billion USD | The amount of money from selling goods and services produced in a given period of time. |
Net Income | NI | billion USD | The amount of money that a company earns after deducting the value of operating expenses, economic costs, taxes and other expenses. |
Net Profit Margin | NPM | % | The measure of net income as a percentage of total revenue. |
Return on Assets | ROA | % | The measure of profitability of a company relative to its total assets. |
Return on Equity | ROE | % | The measure of profitability of a company relative to its shareholders’ equity. |
Table 2: Top 10 US companies’ common environmental indices in 2021
Company | Equivalent carbon emission (million tons CO2e) | Total Energy consumption (MWh) | Clean energy ratio (%) | Waste diversion rate (%) | Fiscal Year | Link to Sustainability Report |
Apple | 22,530,000 | 23,667,280 | 90 | 68 | 2021 | Apple, 2022 |
11,371,205 | 18,571,659 | 100 | 77 | 2021 | Google, 2022 | |
Amazon | 71,540,000 | 30,880,000 | 85 | NA | 2021 | Amazon, 2021 |
MIcrosoft | 14,073,000 | 13,481,863 | 100 | 68 | 2021 | Microsoft, 2021 |
Berkshire Hathaway Inc | 62,082,697 | 150,371,415 | 41 | 40 | 2021 | brkenergy, 2021 |
Nvidia | 2,166,190 | 325,899 | 25 | 68 | 2021 | Nvidia, 2023 |
Tesla | 2,542,000 | NA | 50 | 88 | 2021 | Tesla, 2021 |
Meta | 9,994,000 | 9,421,000 | 100 | NA | 2021 | Meta, 2021 |
Visa | 384,412 | 179,444 | 100 | 43 | 2021 | Visa, 2021 |
United Health | 508,474 | 1,151,438 | 7 | 40 | 2021 | UnitedHealth, 2022 |
Table 3: Top 10 US companies’ common financial indicators in 2021
Company | Total Revenue ($ Billion) | Net income ($ Billion) | Net profit margin (%) | Carbon Intensity (ton CO2e / $ revenue) | Energy intensity (MWh / billion $ revenue) | ESG (out of 40) | ROA (%) | ROE (%) |
Apple | 366 | 95 | 26 | 62 | 64,700 | 17 | 29 | 150 |
257 | 76 | 30 | 44 | 72,336 | 25 | 22 | 32 | |
Amazon | 470 | 33 | 7 | 152 | 65,727 | 30 | 9 | 28 |
MIcrosoft | 168 | 61 | 36 | 84 | 80,206 | 15 | 19 | 38 |
Berkshire Hathaway Inc | 276 | 90 | 33 | 224 | 544,424 | 21 | 12 | 19 |
Nvidia | 17 | 4 | 26 | 130 | 19,538 | 14 | 19 | 26 |
Tesla | 54 | 6 | 10 | 47 | NA | 27 | 4 | 20 |
Meta | 118 | 39 | 33 | 85 | 79,887 | 35 | 22 | 30 |
Visa | 24 | 12 | 51 | 16 | 7,444 | 18 | 13 | 29 |
United Health | 288 | 17 | 6 | 2 | 4,004 | 15 | 9 | 25 |
Note that as a high ESG score indicates a company’s poor performance in the assessment, the negative value of ESG score is taken during post-analysis for convenience, which has a code name ESGreci.
Linear regression and multivariable linear regression are used to examine the correlation of ESG factors and indices with firm profitability measures. Specifically, each index that is highly related to ESG score evaluation is one-to-one analyzed with the ESG score given. Linear regression is used as it is the most simple, common and effective method to analyze if direct correlation exists between two factors. Moreover, the data collected are not likely to follow patterns of other models, such as u-shape or quadratic relationship. As a higher ESG score indicates poorer risk management and sustainability performance, their opposite values are taken in analysis. Other raw data collected are typed into Matlab for one-to-one variable analysis with one another respectively, and results with strong correlation or high statistical significance are chosen for display.
Hypothesis 1 (Better ESG performance helps companies in financial aspects) is measured and tested directly by linear regression models between ESG scores and financial indicators of the chosen ten companies. If the result is statistically significant and shows a strong relationship between the two variables, the hypothesis would be proven correct for large and influential companies. For hypothesis 2 (Different environmental indices are weighted differently in ESG score calculations), the environmental indicators that are considered in the ESG score are respectively analyzed for their correlation with a company’s ESG score and financial performance indices. Variability in the correlation analysis results would validate this hypothesis, and the extent of weight of each environmental index in ESG score can be deduced from the order of the most related to the least related index to the ESG score.
3. Results
The results of analysis are selected according to their significance and are listed and explained below. The value of r-squared is a measure of wellness of fit of the linear regression model, the closer the value is to 1, the stronger the correlation between the two factors. The p-value measures the probability of observed results due to chance, with a smaller p-value, the result is more statistically significant and meaningful.
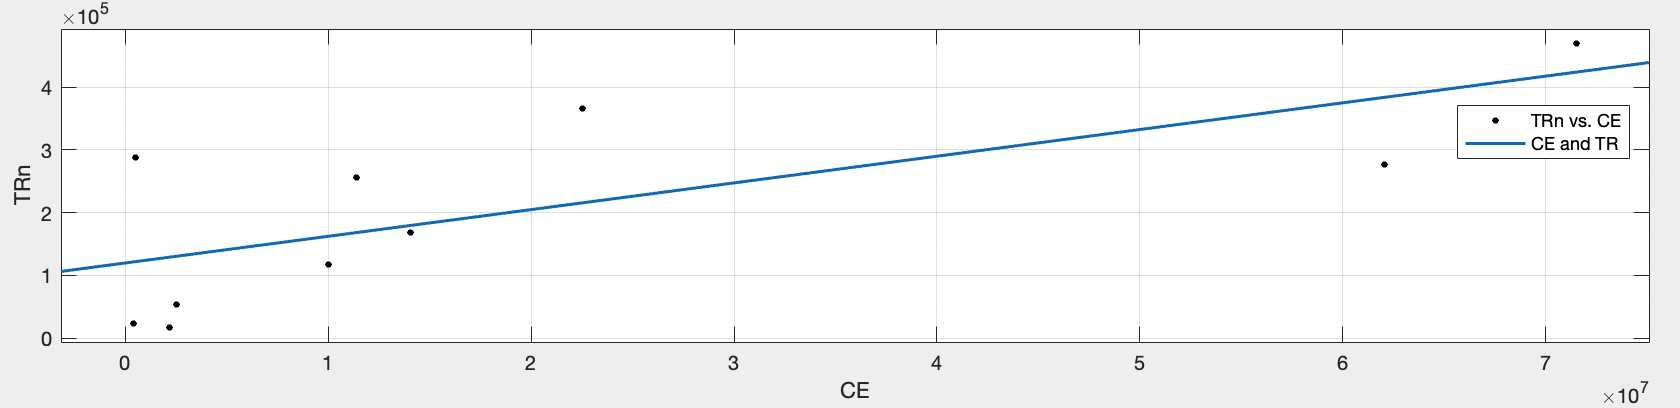
Figure 1: Regression of TR to CE (R-squared: 0.517, Adjusted R-Squared: 0.457, F-statistic vs. constant model: 8.58, p-value = 0.019)
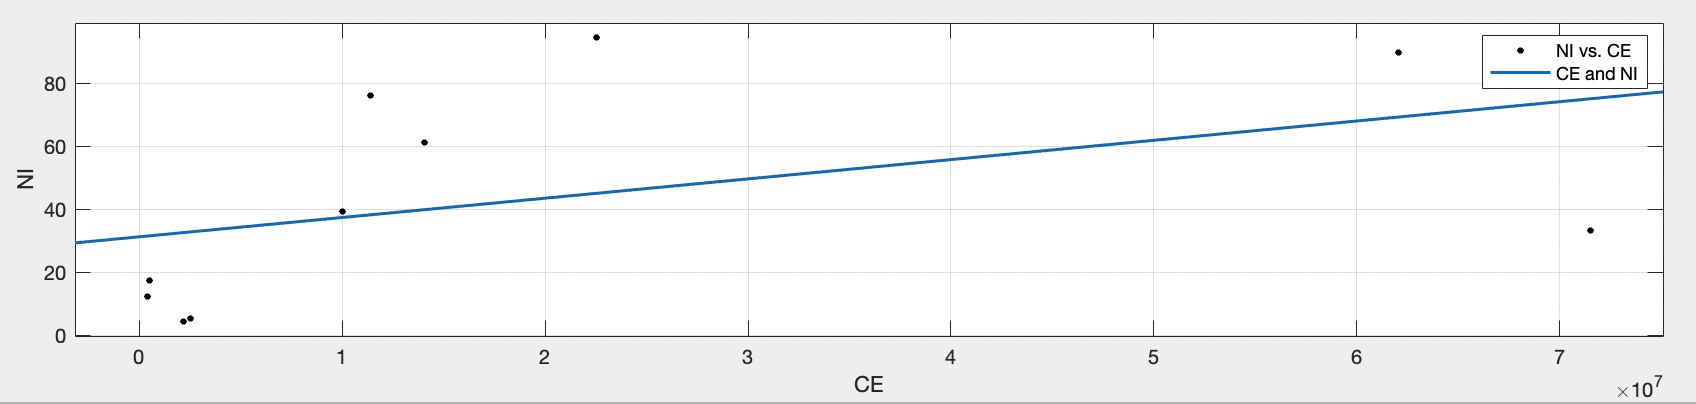
Figure 2: Regression of NI to CE (R-squared: 0.208, Adjusted R-Squared: 0.109, F-statistic vs. constant model: 2.1, p-value = 0.185)
In Figure 1, the p-value of 0.019 suggests that the positive relationship between CO2-eq emission and total revenue is statistically significant, showing a strong correlation. The result is reasonable and easy to comprehend, as most production that brings revenue is accompanied by carbon emissions. However, the correlation between CO2-eq emission and net income of a company is less convincing yet still being positive as shown in Figure 2, with a p-value of 0.185. This indicates that the rate of increase of net income is slower than that of total revenue as a company’s emission increases, or that the difference in their profitability and the nature of production led to the moderate correlation. Under the same amount of carbon emission, companies with high profitability and less use of energy or carbon-intensive inputs gain a higher net income but not necessarily a higher revenue than others.
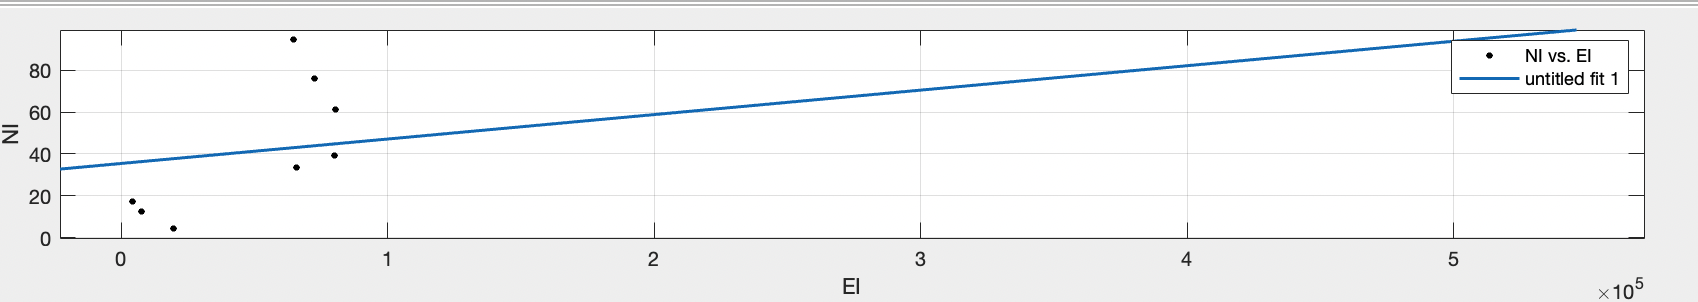
Figure 3: Regression of NI to EI (R-squared: 0.331, Adjusted R-Squared: 0.235, F-statistic vs. constant model: 3.46, p-value = 0.105)
The analysis between energy intensity and net income of companies with a relatively small p-value of 0.105 shows a moderate correlation between the two factors, which is credible as the cost decreases with low energy usage per unit production, and likely leads to a higher profit.
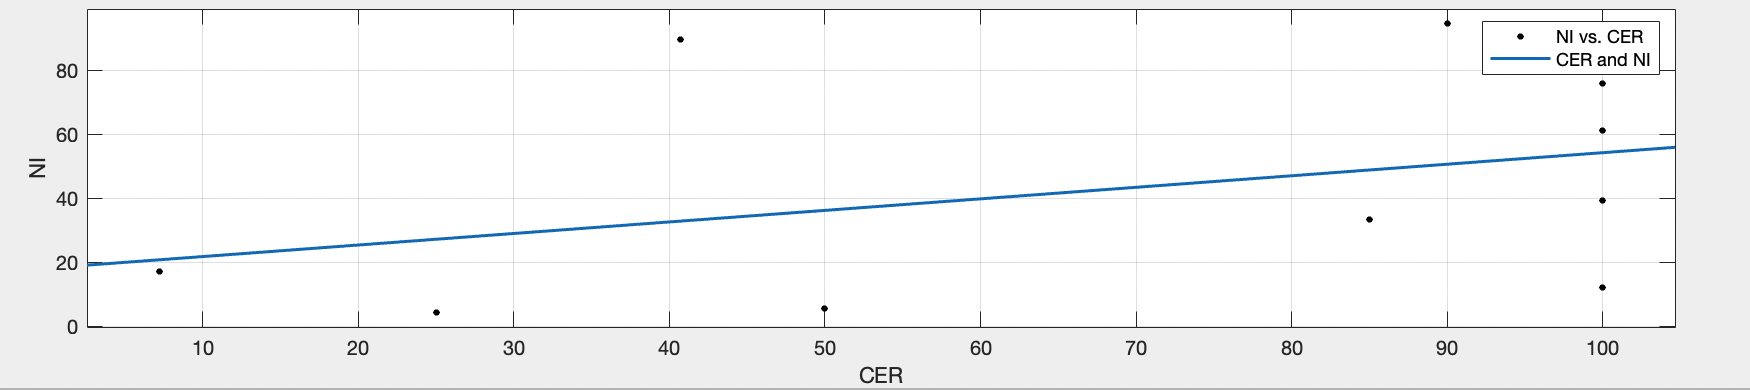
Figure 4: Regression of NI to CER (R-squared: 0.137, Adjusted R-Squared: 0.029, F-statistic vs. constant model: 1.27, p-value = 0.293)
The modeling result in Figure 4 implies an overall positive relationship between using clean energy sources and the profit of a company, with an acceptable p-value of 0.293. However, in recent years clean energy still leads to a higher cost generally than traditional energy sources such as coal and fossil fuels. Therefore, it is deduced that this is again likely caused by different nature of companies: with a high profitability and low usage of energy in production, certain companies can burden the cost of switching to clean energy sources while maintaining a high profit.
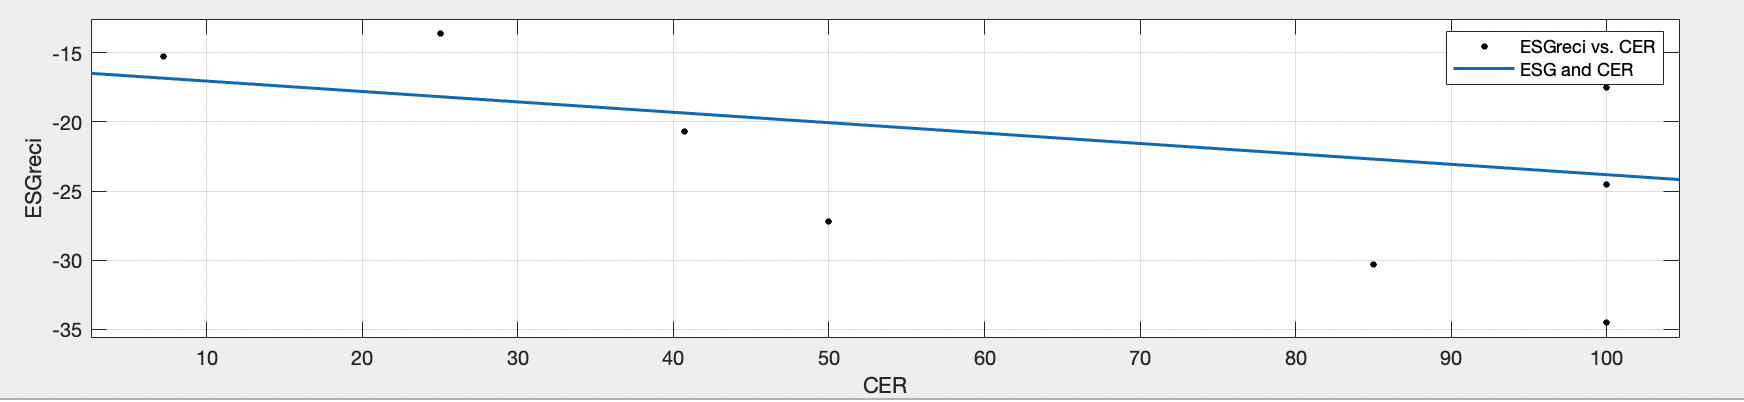
Figure 5: Regression of CER to ESG (R-squared: 0.138, Adjusted R-Squared: 0.0305, F-statistic vs. constant model: 1.28, p-value = 0.29)
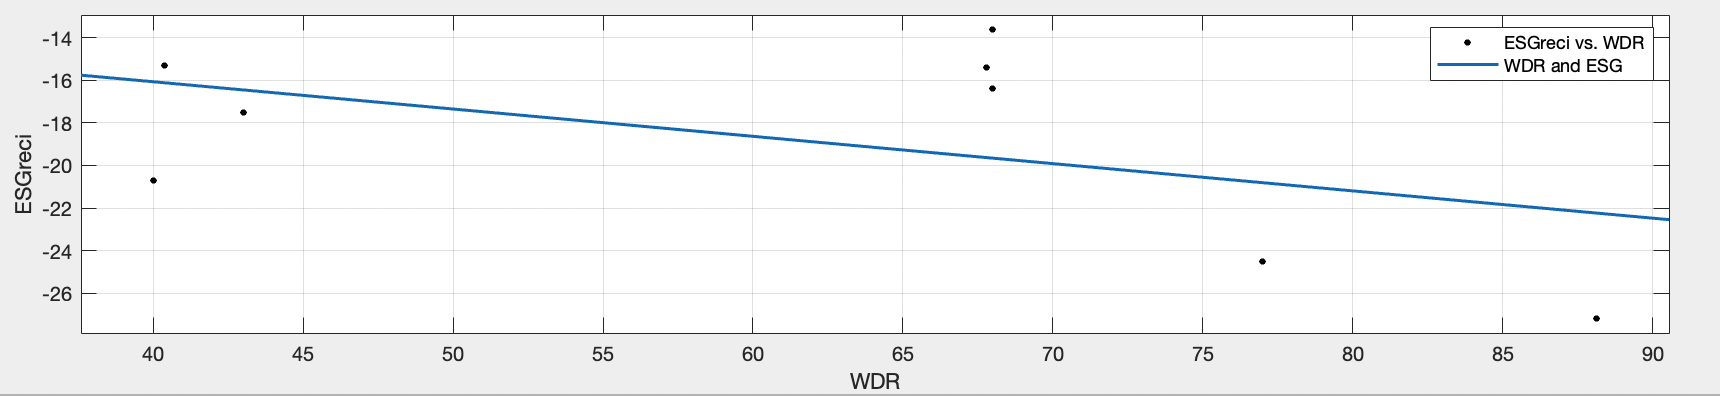
Figure 6: Regression of WDR to ESG (R-squared: 0.232, Adjusted R-Squared: 0.104, F-statistic vs. constant model: 1.81, p-value = 0.227)
Although moderate correlation is shown by analysis between clean energy ratio (Figure 5) and waste diversion rate (Figure 6) with ESG score respectively, the presence of a negative gradient indicates that the trend is opposite to what expected: companies with poor ESG scores tend to have a larger proportion of clean energy in total energy used and a lower waste diversion rate. For the factor of energy intensity, the correlation is too weak. These results exempt the three factors in consideration of ESG scores.
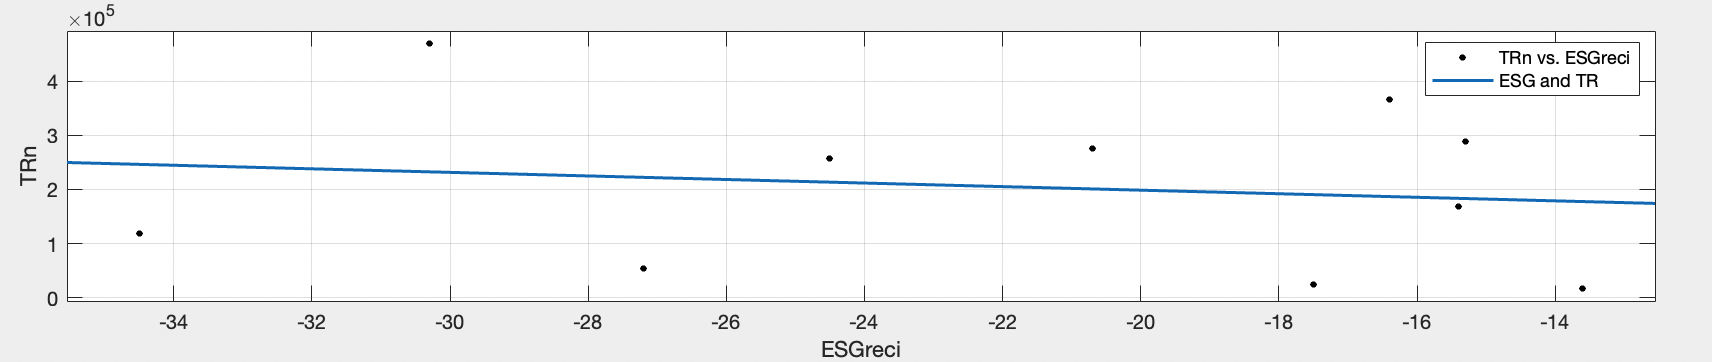
Figure 7: Regression of TR to ESG. (R-squared: 0.024, Adjusted R-Squared: -0.098, F-statistic vs. constant model: 0.197, p-value = 0.669)
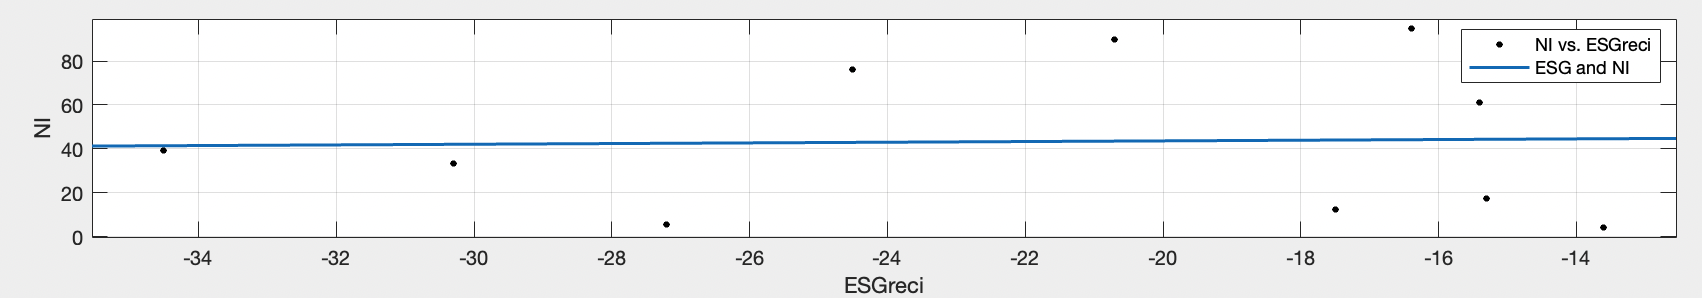
Figure 8: Regression of NI to ESG (R-squared: 0.001, Adjusted R-Squared: -0.124, F-statistic vs. constant model: 0.00801, p-value = 0.931)
The relationships between TR and NI to ESG are respectively analyzed. The results in Figures 7 and 8 show a weak relationship between these pairs. The p-values are close to 1 and R-squared have values around 0.1 indicate that ESG score and total revenue or net income of the top-10 US companies have nearly no relationship in fiscal year 2021. From the perspective of ESG grading, this shows that third-party organizations do not consider total revenue or net income as criteria for ESG. From the perspective of companies’ financial performance, achieving a good ESG score does not require sacrificing the production, revenue, or the profit gained. However, noticeably Apple and Berkshire have outperformed other companies, achieving both a high profit and an above-average ESG score. It is therefore applicable for a company to maintain good income while pursuing a favorable ESG score.
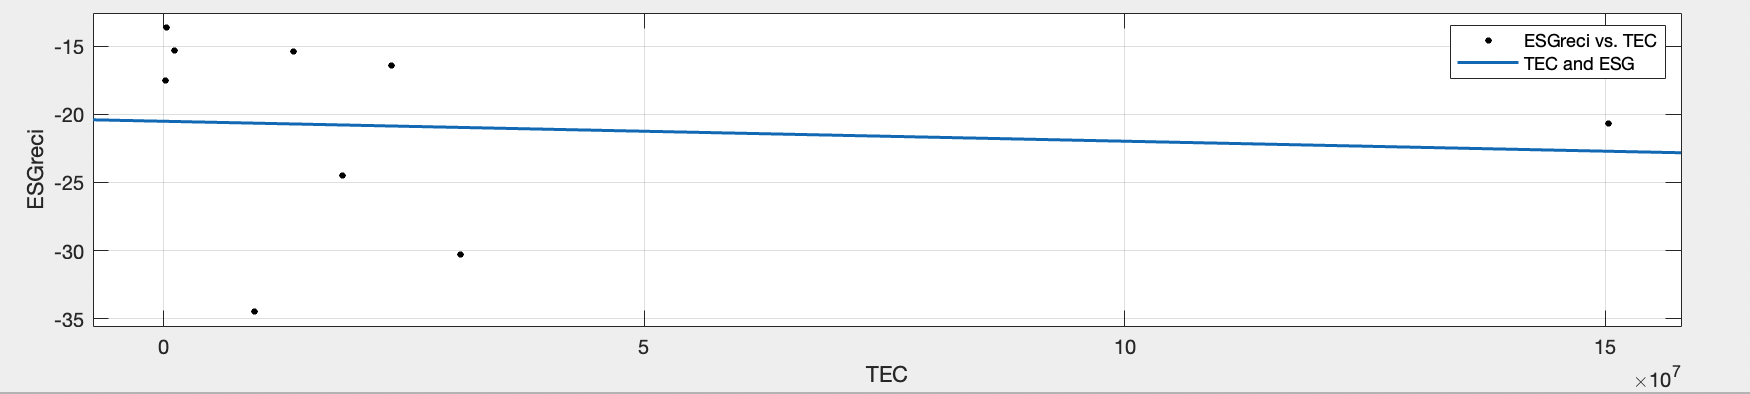
Figure 9: Regression of TEC to ESG (R-squared: 0.00888, Adjusted R-Squared: 0.133, F-statistic vs. constant model: 0.0627, p-value = 0.809)
In Figure 9, the analysis of TEC and ESG has a large p-value of 0.8 and a small r-squared of 0.13. Though the model shows a weak correlation, the negative gradient indicates a plausible trend between the two indices: The more energy a company consumes, the lower its ESG score as it is likely to become less sustainable or environmentally friendly for its proper operation. Companies may pursue a better ESG rating by improving energy efficiency.
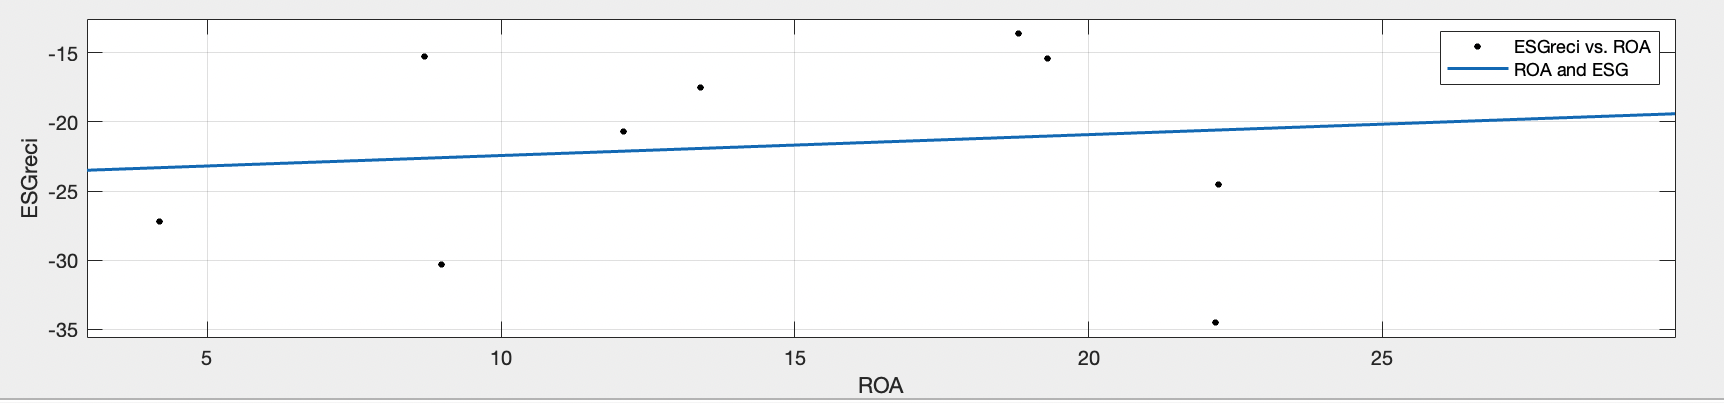
Figure 10: Regression of ESG to ROA (R-squared: 0.0254, Adjusted R-Squared: -0.0964, F-statistic vs. constant model: 0.209, p-value = 0.66)
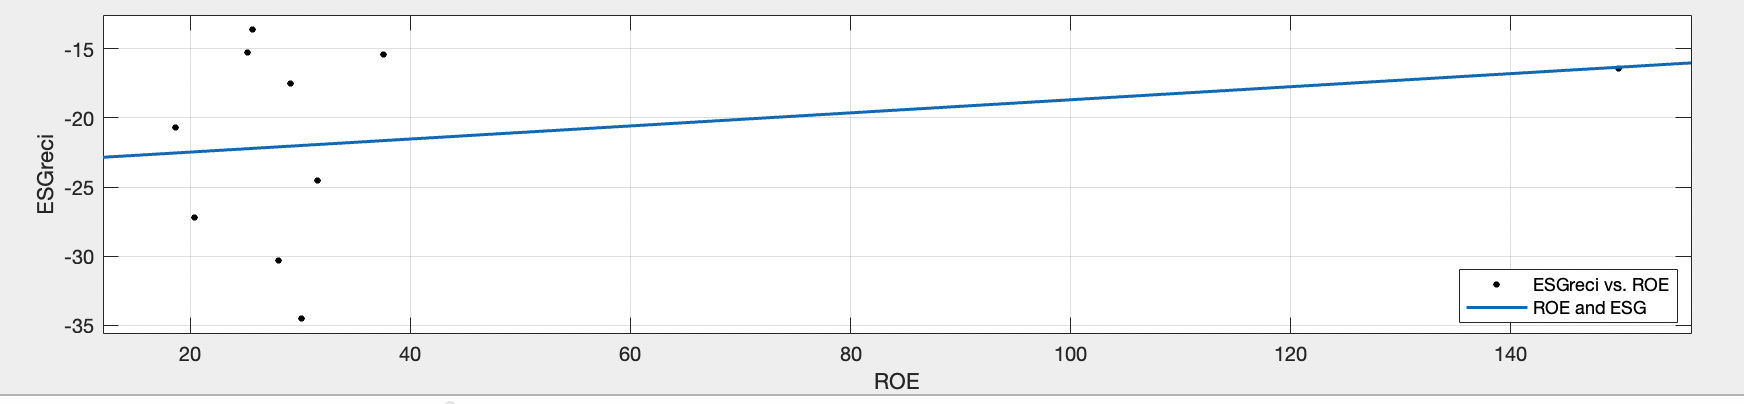
Figure 11: Regression of ESG to ROE (R-squared: 0.0656, Adjusted R-Squared: -0.0511, F-statistic vs. constant model: 0.562, p-value = 0.475)
These figures show a generally positive relationship between ROA and ROE with ESG performance. However, most data points are scattered around the linear best-fit line and p-values are too large, so the correlation is not necessarily valid, but companies may still attempt to improve ESG score by promoting equity of shareholders.
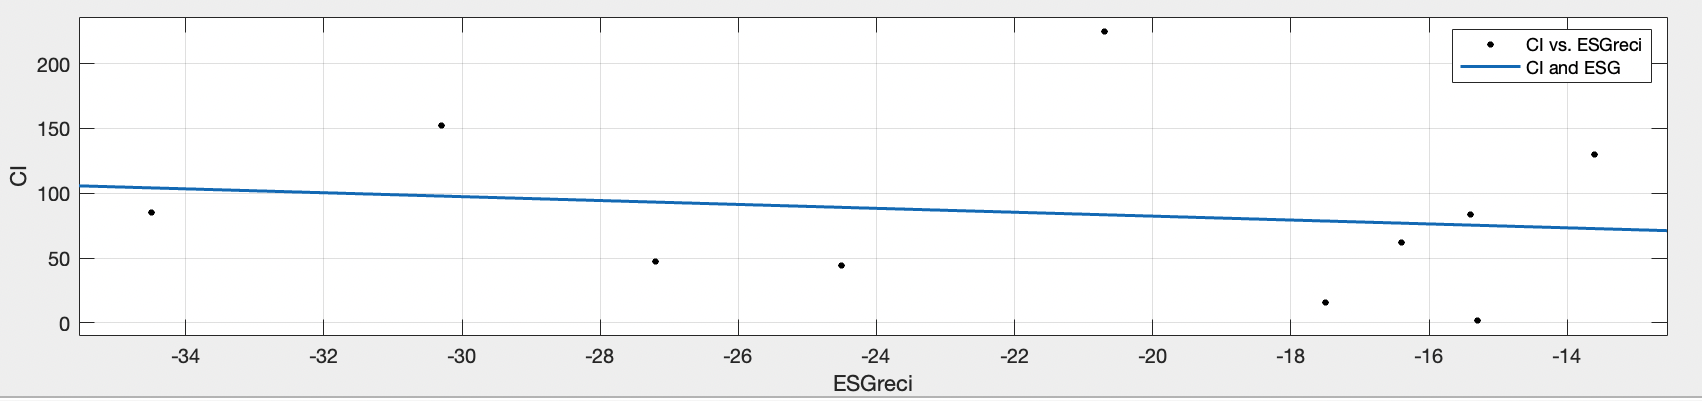
Figure 12: Regression of CI to ESG (R-squared: 0.0256, Adjusted R-Squared: -0.0962, F-statistic vs. constant model: 0.21, p-value = 0.659)
In the analysis between carbon intensity and ESG score, a plausible negative gradient is present which indicates that companies with better ESG performance emit less carbon dioxide or other pollutants per unit production, so carbon emission must have been included in the evaluation of ESG. However, the result is still not convincing enough for the large p-value and small R-squared value, so the two factors are not considered to have direct relationships.
4. Discussion
Notably strongly correlated data are CO2e emission and total revenue, which is highly reasonable since more production results in more emission, yet it does not provide direct evidence for the aim of this paper. Most common environmental indices have no strong impact on the evaluation of ESG scores, such as clean energy ratio, waste diversion rate and energy intensity. It is still difficult to determine a key environmental factor that is particularly influential to ESG ratings. However, we may conclude that all the indices studied had a certain weight in ESG ratings since most environmental data show a logical and reasonable trend with ESG score. The weak correlations attribute to the insignificance of the independent index relative to hundreds of environmental indices that are considered in the whole ESG evaluation: a company that failed in one index could do better in other aspects, so comparing small and specific indices to the comprehensive measure ESG could bring about many uncertainties in terms of results.
Despite the reasons explained above, none of the environmental indices analyzed were found to have a strong correlation with ESG performance. It is therefore deduced that the environmental responsibility of a company is not a decisive part concerning the ESG evaluation process (which is composed of three aspects environmental, social and governance), and it is advised that environmental aspects should be taken more seriously in determining the ESG score.
The methodology employed in this paper, including online data collection and the use of a linear regression model, is both straightforward and effective, allowing for easy replication and validation in future studies. All data were cross-verified by at least two independent sources, and significant time and effort were dedicated to analyzing each data pair. Only the most meaningful data are presented and discussed in detail, resulting in highly precise outcomes that offer strong reference points for companies making future decisions related to the studied topic. The method was meticulously designed to examine the relationships between specific independent variables and ESG ratings. This paper also provides valuable insights into the potential calculation methods used by third-party organizations to determine ESG scores, highlighting how different factors may be weighted in the evaluation process.
A few limitations were encountered in this study. First, most of the data were not standardized, and only relevant data from the top 10 U.S. companies in 2021, ranked by market capitalization, were analyzed. The small dataset led to generally high p-values, which weakens the statistical significance of some results. Additionally, some data were either unavailable or not published by companies. For example, Tesla’s annual energy consumption and water consumption statistics from multiple companies were absent, hindering the comprehensive analysis that this paper aimed to achieve. The difficulties in locating certain data, coupled with the unavailability of others, may have introduced inaccuracies in the statistics collected. For instance, Berkshire Hathaway does not provide a consolidated environmental impact report, necessitating manual efforts to aggregate data from each branch office and department. This process is prone to errors and may have resulted in minor inaccuracies. Moreover, the study only considered the financial performance of companies in relation to their ESG ratings and relevant environmental indices. The analysis relied solely on ESG ratings from one source, Sustainalytics, which may not provide a complete picture. Important ESG evaluation aspects that cannot be quantified, such as companies' descriptions of climate-related risks, sustainable strategies, and environmental risk management in their sustainability reports, were not considered in this study.
5. Conclusion
This paper aims to find different weights of environmental indices for the evaluation of companies’ ESG scores, as well as the impact of ESG score or other environmental data on the financial performance. Most data pairs were not strongly correlated. This study shows that neither ESG performance nor environmental data revealed in sustainability reports significantly impact top US companies’ financial performance. However, it is feasible for a company to pursue a high ESG score when maintaining considerable net income. Large variations of r-squared and p-value are shown among regressions of different environmental indices and ESG score respectively, so environmental factors weigh differently during the third-party ESG assessment. Indices that have relatively strong correlation with ESG are Total Energy Consumption, Return on Assets, Return on Equity and Carbon Intensity, and companies may want to first invest in these sustainability aspects for the hope of improving ESG scores.
Future research could focus on comparing and modeling the analyzed indices, along with other relevant factors, against ESG ratings provided by organizations other than Sustainalytics. Additionally, developing more advanced models or employing alternative analytical methods beyond linear regression could offer a more comprehensive understanding of the relationships involved. Expanding the data collection to include more variables related to environmental responsibility and sustainability, beyond those examined in this paper, would also be beneficial. Finally, efforts to standardize ESG data and incorporate additional factors in future studies could enhance the robustness and generalizability of the findings.
References
[1]. Plumlee, M., Brown, D., Hayes, R. M., & Marshall, R. S. (2015). Voluntary environmental disclosure quality and firm value: Further evidence. Journal of Accounting and Public Policy, 34(4), 336–361. https://doi.org/10.1016/j.jaccpubpol.2015.04.004
[2]. Whetman, Lancee L. “The Impact of Sustainability Reporting on Firm Profitability.” Undergraduate Economic Review 14, no. 1 (January 1, 2018): 4. https://digitalcommons.iwu.edu/cgi/viewcontent.cgi?article=1416&context=uer.
[3]. Friede, G., Busch, T., & Bassen, A. (2015). ESG and financial performance: aggregated evidence from more than 2000 empirical studies. Journal of Sustainable Finance & Investment, 5(4), 210–233. https://doi.org/10.1080/20430795.2015.1118917
[4]. Aydoğmuş, Mahmut, Güzhan Gülay, and Korkmaz Ergun. “Impact of ESG Performance on Firm Value and Profitability.” Borsa Istanbul Review 22 (December 1, 2022): S119–27. https://doi.org/10.1016/j.bir.2022.11.006.
[5]. Whelan, T., Atz, U., & Clark, C. (2021). ESG AND FINANCIAL PERFORMANCE: Uncovering the Relationship by Aggregating Evidence from 1, 000 Plus Studies Published between 2015 – 2020. NYU Stern. https://www.stern.nyu.edu/sites/default/files/assets/documents/NYU-RAM_ESG-Paper_2021.pdf
[6]. Buallay, Amina. “Between Cost and Value.” Journal of Applied Accounting Research 20, no. 4 (December 9, 2019): 481–96. https://doi.org/10.1108/jaar-12-2017-0137.
[7]. Halid, Sunarti, Rahayu Abdul Rahman, Radziah Mahmud, Nooriha Mansor, and Roslan Abdul Wahab. “A Literature Review on ESG Score and Its Impact on Firm Performance.” International Journal of Academic Research in Accounting, Finance and Management Sciences 13, no. 1 (January 19, 2023). https://doi.org/10.6007/ijarafms/v13-i1/15101.
[8]. Sustainalytics. “ESG Risk Ratings, ” 2024. https://www.sustainalytics.com/esg-data.
[9]. “Companies Ranked by Market Cap - CompaniesMarketCap.com, ” 2024. https://companiesmarketcap.com/.
Cite this article
Guo,G. (2024). Evaluating the Impacts of Sustainability Reporting on Financial Performance of Corporations. Advances in Economics, Management and Political Sciences,137,106-116.
Data availability
The datasets used and/or analyzed during the current study will be available from the authors upon reasonable request.
Disclaimer/Publisher's Note
The statements, opinions and data contained in all publications are solely those of the individual author(s) and contributor(s) and not of EWA Publishing and/or the editor(s). EWA Publishing and/or the editor(s) disclaim responsibility for any injury to people or property resulting from any ideas, methods, instructions or products referred to in the content.
About volume
Volume title: Proceedings of the 3rd International Conference on Financial Technology and Business Analysis
© 2024 by the author(s). Licensee EWA Publishing, Oxford, UK. This article is an open access article distributed under the terms and
conditions of the Creative Commons Attribution (CC BY) license. Authors who
publish this series agree to the following terms:
1. Authors retain copyright and grant the series right of first publication with the work simultaneously licensed under a Creative Commons
Attribution License that allows others to share the work with an acknowledgment of the work's authorship and initial publication in this
series.
2. Authors are able to enter into separate, additional contractual arrangements for the non-exclusive distribution of the series's published
version of the work (e.g., post it to an institutional repository or publish it in a book), with an acknowledgment of its initial
publication in this series.
3. Authors are permitted and encouraged to post their work online (e.g., in institutional repositories or on their website) prior to and
during the submission process, as it can lead to productive exchanges, as well as earlier and greater citation of published work (See
Open access policy for details).
References
[1]. Plumlee, M., Brown, D., Hayes, R. M., & Marshall, R. S. (2015). Voluntary environmental disclosure quality and firm value: Further evidence. Journal of Accounting and Public Policy, 34(4), 336–361. https://doi.org/10.1016/j.jaccpubpol.2015.04.004
[2]. Whetman, Lancee L. “The Impact of Sustainability Reporting on Firm Profitability.” Undergraduate Economic Review 14, no. 1 (January 1, 2018): 4. https://digitalcommons.iwu.edu/cgi/viewcontent.cgi?article=1416&context=uer.
[3]. Friede, G., Busch, T., & Bassen, A. (2015). ESG and financial performance: aggregated evidence from more than 2000 empirical studies. Journal of Sustainable Finance & Investment, 5(4), 210–233. https://doi.org/10.1080/20430795.2015.1118917
[4]. Aydoğmuş, Mahmut, Güzhan Gülay, and Korkmaz Ergun. “Impact of ESG Performance on Firm Value and Profitability.” Borsa Istanbul Review 22 (December 1, 2022): S119–27. https://doi.org/10.1016/j.bir.2022.11.006.
[5]. Whelan, T., Atz, U., & Clark, C. (2021). ESG AND FINANCIAL PERFORMANCE: Uncovering the Relationship by Aggregating Evidence from 1, 000 Plus Studies Published between 2015 – 2020. NYU Stern. https://www.stern.nyu.edu/sites/default/files/assets/documents/NYU-RAM_ESG-Paper_2021.pdf
[6]. Buallay, Amina. “Between Cost and Value.” Journal of Applied Accounting Research 20, no. 4 (December 9, 2019): 481–96. https://doi.org/10.1108/jaar-12-2017-0137.
[7]. Halid, Sunarti, Rahayu Abdul Rahman, Radziah Mahmud, Nooriha Mansor, and Roslan Abdul Wahab. “A Literature Review on ESG Score and Its Impact on Firm Performance.” International Journal of Academic Research in Accounting, Finance and Management Sciences 13, no. 1 (January 19, 2023). https://doi.org/10.6007/ijarafms/v13-i1/15101.
[8]. Sustainalytics. “ESG Risk Ratings, ” 2024. https://www.sustainalytics.com/esg-data.
[9]. “Companies Ranked by Market Cap - CompaniesMarketCap.com, ” 2024. https://companiesmarketcap.com/.