


1. Introduction
The stock market serves as a barometer of economic activity, reflecting investor expectations about the economy, corporate performance, and global events. Stock volatility mirrors market sentiment, policy changes, and global dynamics. Understanding stock market movements is crucial for assessing economic health, policy impacts, and the global situation. A stable stock market supports companies by providing capital for growth, which boosts economic vitality. However, stock performance can diverge from the real economy due to speculation or external factors. The stock market also influences investor behavior and corporate financing. Strong markets inspire confidence and investment, while downturns can cause panic and restrict capital. Additionally, the stock market's performance guides government policy, with strong markets encouraging caution and weak markets prompting stimulus measures. Global economic conditions and events significantly impact the stock market, making it essential for investors to monitor global trends when analyzing markets.
In recent years, the application of machine learning (ML) and deep learning (DL) techniques in stock market prediction has seen significant growth. DL models, such as Long Short-Term Memory (LSTM) networks and Gated Recurrent Units (GRU), have shown considerable success in handling time series data, particularly when working with large datasets. These models excel in capturing intricate patterns and dependencies that traditional models often overlook. On the other hand, traditional ML algorithms, including Support Vector Machines (SVM) and Random Forests (RF), continue to be widely used, especially when dealing with simpler or lower-dimensional datasets. Their popularity stems from their efficiency, ease of interpretation, and relatively low computational demands. While DL models offer enhanced predictive power in complex scenarios, ML methods remain valuable for their balance of accuracy, speed, and interpretability. This distinction highlights the importance of selecting the appropriate model based on the complexity of the data, as more advanced models are not always necessary for achieving optimal results in financial forecasting. The ongoing development of both ML and DL approaches reflects their evolving roles in enhancing stock market prediction accuracy and investment decision-making.
Research shows that while DL models often outperform traditional ML methods on complex datasets, the latter can still be effective under certain conditions. For instance, Kumar et al. [1] demonstrated that LSTM outperformed SVM and RF in stock prediction, suggesting further optimization. Similarly, Malladi and Ganapathy [2] developed a big data framework combining LSTM and RF, achieving efficient large-scale data processing. Manda et al. [3] compared LSTM and GRU, highlighting DL's potential in financial markets, while Shaikh and Malhotra [4] reviewed various methods, from K-Nearest Neighbors (KNN) to LSTM, discussing their strengths and limitations.
Hybrid models that combine different algorithms are increasingly popular. For example, Anju and Ananthi [5] found that a hybrid KNN-SVM model outperformed single models in prediction accuracy. Sharma and Verma [6] and Yu et al. [7] focused on KNN's application in stock prediction, comparing it with traditional methods and analyzing its performance. Additionally, Bilal et al. [8] and Kanth et al. [9] compared techniques like KNN, RF, and LSTM, concluding that DL generally performs better on complex datasets, though traditional methods remain competitive in some cases. Hemanth et al. [10] demonstrated KNN’s high accuracy when combined with RF under specific conditions.
Future research in stock market prediction is expected to emphasize the integration of multiple machine learning methods to improve both accuracy and stability. This study primarily aims to predict stock market trends by employing the KNN algorithm and comparing its effectiveness with Recurrent Neural Networks (RNN) and LSTM models. KNN is specifically used for analyzing simpler, low-dimensional data patterns in stock market records, and its performance is assessed alongside RNN and LSTM to identify the strengths and limitations of each approach. Experimental findings reveal that KNN performs better than RNN and LSTM in particular contexts, especially when the data involves low complexity and clear trends. This research underscores the continued relevance of traditional algorithms like KNN in specific applications, providing investors with a broader array of predictive tools. Moreover, it highlights that more complex models are not always superior, as simpler algorithms can still deliver competitive results under the right conditions, making them viable options for certain market analysis tasks.
2. Methodology
2.1. Dataset Description and Preprocessing
This study utilizes historical stock price data from the United States of America (US) Apple Inc., which includes key financial indicators such as opening price, closing price, daily highs and lows, and trading volume. Sourced from a reputable financial database that monitors the market activity of various stocks [10], this dataset serves as a critical foundation for training and testing KNN and neural network models aimed at forecasting future stock prices. In the preprocessing phase, the data undergoes several key transformations, including normalization, scaling, and whitening. These preprocessing techniques ensure that the data is standardized, making it suitable for distance-based calculations used in KNN, and help reduce noise that can interfere with model accuracy. Normalization helps maintain uniform data ranges, while whitening removes potential correlations within the data. These steps collectively enhance the model's performance, improving its predictive accuracy. By refining the dataset through rigorous preprocessing, this study ensures that the models operate on high-quality inputs, leading to more reliable stock price forecasts. Additionally, preprocessing plays a vital role in mitigating issues related to outliers and skewed distributions, further refining the model’s performance in real-world stock market scenarios.
2.2. Proposed Approach
This research develops a stock price prediction model for Apple Inc. using KNN, LSTM, and RNN. The aim is to accurately forecast future stock prices through a systematic process, starting with data collection and preprocessing, which includes standardization and normalization.
The structure of the model consists of several layers, each playing a specific role in the prediction process. Initially, the input layer receives the preprocessed stock data, preparing it for further analysis. Subsequent hidden layers are designed to extract and recognize patterns within the data, employing techniques. These hidden layers work to uncover intricate relationships and trends that may not be immediately apparent in raw data. Finally, the dense output layer produces the stock price predictions based on the patterns detected in the previous layers. Figure 1 visualizes the complete pipeline, from data ingestion to the implementation of machine learning models, and ultimately the generation of stock price forecasts. By integrating different machine learning methods within this architecture, the model aims to improve the overall predictive accuracy, offering a more robust solution for stock price forecasting.
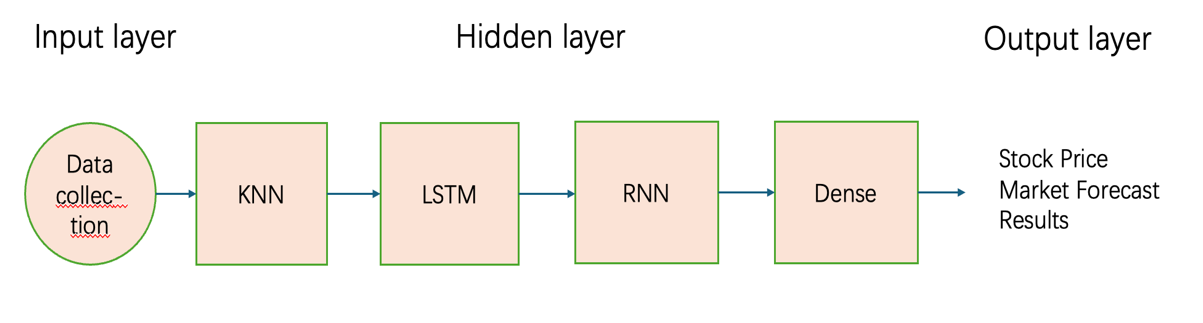
Figure 1: Stock price neural network model diagram.
2.2.1. Unet
The KNN algorithm is a versatile instance-based learning technique commonly employed for both classification and regression purposes. Its fundamental concept relies on the assumption that data points exhibiting similar characteristics are positioned close to one another within the feature space. To make predictions, KNN evaluates the proximity of a new data point to its nearest neighbors within the training dataset and assigns a class or value based on this proximity. This method is valued for its straightforwardness and ease of interpretation, as it does not involve complex training processes. Instead, it generates predictions through a direct comparison of distances between data points. Despite its advantages, KNN has notable drawbacks, including its sensitivity to noisy data and its potential inefficiency in handling large-scale datasets, which can lead to high computational costs. The basic structure of a KNN model involves three main steps: distance measurement, selection of the K value, and output prediction. In this study, KNN is applied to forecast the future stock prices of Apple Inc. The implementation process begins with collecting historical stock data, followed by data preprocessing, which includes standardization and normalization to ensure compatibility with KNN’s distance calculations. The model then computes the nearest neighbors based on the selected K value and predicts the stock price accordingly. Finally, the results are analyzed, and the K value and preprocessing methods are adjusted to optimize model performance. In this research, KNN serves as a benchmark model, providing a comparison point for more complex neural network models. The experiment aims to refine the KNN setup to enhance prediction accuracy and effectively capture patterns in the stock data.
2.2.2. Diffusion Model
KNN is a popular instance-based learning algorithm used for both classification and regression tasks. This algorithm operates on the principle that data points with similar attributes are likely to be close to each other in the feature space. To predict the outcome for a new data point, KNN calculates its distance from other points in the training dataset, identifies the K nearest neighbors, and determines the prediction based on these neighbors' labels or values. The method is known for its simplicity and effectiveness, especially when interpretability and minimal computational overhead are crucial. However, KNN's performance can be adversely affected by noisy data and its efficiency depends significantly on the choice of the parameter K. In contrast, RNNs are specialized neural networks designed for handling sequential data. Unlike traditional feedforward networks, RNNs incorporate feedback loops, allowing them to use information from previous time steps in the sequence. This feature makes RNNs particularly useful for tasks such as time series forecasting, where understanding temporal dependencies is essential. Nevertheless, RNNs face challenges with long-term dependencies due to the vanishing gradient problem, which can hinder their performance over extended sequences.
2.2.3. Loss Function
KNN is simple and intuitive, and does not require complex training processes. For large datasets, their computational cost is high and they are sensitive to noisy data. The commonly used distance metric is Euclidean distance:
\( d(x,y)=\sqrt[]{\sum _{i=1}^{n} {({x_{i}}-{y_{i}})^{2}}}\ \ \ (1) \)
where \( {x_{i}} \) and \( {y_{i}} \) are the feature values of two data points in the i-th dimension.
RNN captures dependencies in time series data to make it suitable for predicting continuous data. However, they may encounter issues such as vanishing or exploding gradients that limit their ability to capture long-term dependencies:
\( {h_{t}}=σ({W_{h}}{x_{t}}+{U_{h}}{h_{t-1}}+{b_{h}})\ \ \ (2) \)
\( {y_{t}}=σ({W_{y}}{h_{t}}-{b_{y}})\ \ \ (3) \)
where \( {h_{t}} \) is the hidden state at time t, \( {x_{t}} \) is the input, \( {W_{h}} \) , \( {U_{h}} \) , and \( {W_{y}} \) are weight matrices, \( {b_{h}} \) and \( {b_{y}} \) are biases, and σ is the activation function (commonly tanh or Rectified Linear Unit (ReLU)). LSTM is particularly suitable for time series data such as stock price prediction. Although the structure of LSTM is complex, it can capture both short-term and long-term information very well. In this study, these models are implemented following data preprocessing steps, where the data is standardized, normalized, and whitened before being fed into these models for training. This ensures improved accuracy in stock price prediction.
2.3. Implementation Details
The system utilizes machine learning models such as KNN, RNN, and LSTM to utilize historical stock price data from authoritative financial databases, including key indicators such as opening prices. In order to improve model performance, data augmentation techniques such as noise addition and time series shifting are used to create different training samples. Key hyperparameters, including the number of neighbors in KNN, hidden layers in RNN, and learning rate in LSTM, are carefully tuned to optimize the models. These adjustments ensure robust predictions, enabling more informed investment decisions.
3. Result and Discussion
This chapter primarily analyzes the background of the stock price prediction system, data augmentation techniques, and hyperparameter settings. It begins by introducing the system's background, explaining the purpose and necessity of using machine learning models like KNN, RNN, and LSTM for stock price prediction. The chapter then discusses the application of data augmentation techniques, including adding noise and time-series shifting, to create diverse training samples and enhance the model's generalization ability. In conclusion, the process of hyperparameter tuning is crucial for enhancing the performance of predictive models. This process involves carefully adjusting key parameters to improve model accuracy and efficiency. For LSTM networks, fine-tuning the learning rate is critical for effective convergence and performance.
This chapter underscores the significance of these adjustments and offers both theoretical insights and practical advice for the development and refinement of stock price prediction systems. By exploring these hyperparameter tuning techniques, the chapter aims to equip practitioners with the knowledge to optimize their models effectively. This enhanced understanding is vital for building robust prediction systems that can handle the complexities of financial data and improve forecasting accuracy.
3.1. Experiment Data
This dataset shows Apple's stock prices on various dates, including the opening, highest, lowest, and closing prices, along with trading volume. From 1995 to 2015, Apple’s stock price experienced significant growth. For instance, on May 15, 1995, Apple's opening price was $0.3273, closing at $0.3311, with a trading volume of 393,355,200 shares. By January 11, 2001, although the opening price had decreased to $0.2488, the closing price rose to $0.2756, with trading volume increasing to 803,734,400 shares. Over time, particularly on May 23, 2005, and January 22, 2009, Apple’s stock price surged significantly, reaching $1.2175 and $2.7056, respectively. By December 7, 2012, and July 31, 2015, Apple's stock price skyrocketed to $16.4732 and $27.6788, respectively. This price increase reflects Apple’s rapid growth and improved market performance during this period, likely driven by product innovation, increased market demand, and the company's dominance in the tech industry [11], as shown in the Table 1.
Table 1: Stock data apple.
1995/5/15 | Apple | 0.327295342 | 0.332038451 | 0.322551396 | 0.331089824 | 393355200 |
2001/1/11 | Apple | 0.248789356 | 0.283236546 | 0.248789356 | 0.275582016 | 803734400 |
2003/4/16 | Apple | 0.198877845 | 0.209288818 | 0.197806127 | 0.202705979 | 1016176000 |
2005/5/23 | Apple | 1.158974345 | 1.221745428 | 1.158974345 | 1.217458606 | 1042574400 |
2009/1/22 | Apple | 2.695801475 | 2.75581719 | 2.627824534 | 2.705599546 | 1409528400 |
2012/12/7 | Apple | 17.0956928 | 17.15129821 | 16.37281742 | 16.47321701 | 787040800 |
2014/5/13 | Apple | 18.96510776 | 19.04647763 | 18.92346302 | 19.0214901 | 159737200 |
2015/7/31 | Apple | 27.97544346 | 27.98457106 | 27.58981251 | 27.6788044 | 171540000 |
3.2. Experiment Result
The performance of the predictive models was evaluated using Root Mean Square Error (RMSE) as the primary metric, as shown in Table 2. Among the models assessed, KNN demonstrated the highest accuracy, with RMSE values of 2.0345, 1.9787, and 2.0457 in three separate trials. This indicates that KNN consistently provided more precise predictions compared to LSTM and RNN models. In contrast, LSTM models had higher RMSE scores of 2.2876, 2.3123, and 2.2998, suggesting they were slightly less effective in forecasting stock prices. RNN models showed intermediate performance with RMSE values of 2.1984, 2.3123, and 2.1943, reflecting a moderate level of accuracy. These findings reveal that simpler models like KNN can outperform more complex algorithms in certain contexts, particularly when dealing with datasets that benefit from instance-based methods. The consistent results across trials emphasize the need to match model complexity with the specific characteristics of the data and task. KNN's superior performance may be attributed to its effectiveness in capturing local data patterns or working with lower-dimensional datasets, whereas the more complex LSTM and RNN models, designed for handling long-term dependencies, may not always provide better generalization. This underscores the importance of selecting the appropriate model based on data characteristics and prediction requirements.
Table 2: The experimental result of the comparison model.
KNN | LSTM | RNN | |
RMSE | 2.0345 | 2.2876 | 2.1984 |
1.9787 | 2.3123 | 2.3123 | |
2.0457 | 2.2998 | 2.1943 |
In summary, the experiments conducted in this chapter demonstrate that the KNN model consistently outperforms both LSTM and RNN in terms of prediction accuracy, as evidenced by lower RMSE values. This indicates that KNN may be more effective for certain types of stock market data, particularly when the data's characteristics align with KNN's strengths. The results validate the importance of model selection and suggest that simpler models like KNN can sometimes yield better performance than more complex models, depending on the dataset and prediction task.
4. Conclusion
This study combines KNN, LSTM, and RNN methods to analyze the stock trend of Apple Inc. and introduces a new method for predicting stock prices. This method involves a comprehensive workflow starting from collecting and preparing historical inventory data. Then deploy these machine learning techniques to discover complex patterns. Strict testing of the integrated model shows a significant improvement in prediction accuracy. Future investigations will focus on integrating other financial indicators and optimizing the model structure to improve its predictive reliability. The purpose of these advancements is to improve the performance of the model and evaluate its effectiveness under different market conditions.
References
[1]. Usmani, M., Adil, S.H., Raza, K., et al. (2016) Stock market prediction using machine learning techniques. International conference on computer and information sciences, 322-327.
[2]. Attigeri, G.V., MM, M.P., Pai, R.M., et al. (2015) Stock market prediction: A big data approach. TENCON Region Conference, 1-5.
[3]. Liu, J., Chao, F., Lin, Y.C., et al. (2019) Stock prices prediction using deep learning models. arXiv preprint:1909.12227.
[4]. Kumari, J., Sharma, V., Chauhan, S. (2021) Prediction of stock price using machine learning techniques: A survey. International conference on advances in computing, communication control and networking, 281-284.
[5]. Roy, R.P., Thiruthuvanathan, M.M. (2022) Enhanced stock market prediction using hybrid LSTM ensemble. Congress on Intelligent Systems: Proceedings of CIS, 1, 49-61.
[6]. Alkhatib, K., Najadat, H., Hmeidi, I., et al. (2013) Stock price prediction using k-nearest neighbor (kNN) algorithm. International Journal of Business, Humanities and Technology, 3(3), 32-44.
[7]. Siddartha, Reddy, A., Praneeth, M., Reddy, K.P., et al. (2024) Stock Market Trend Prediction Using K-Nearest Neighbor (KNN) Algorithm.
[8]. Chong, E., Han, C., Park, F.C. (2017) Deep learning networks for stock market analysis and prediction: Methodology, data representations, and case studies. Expert Systems with Applications, 83, 187-205.
[9]. Sreemalli, M., Chaitanya, P., Srinivas, K. (2016) Comparative analysis of machine learning techniques on stock market prediction. International Journal of Computer Science and Information Security, 14, 152-156.
[10]. Khaidem, L., Saha, S., Dey, S.R. (2016) Predicting the direction of stock market prices using random forest. arXiv preprint:1605.00003.
[11]. Horák, J., Kaisler, D. (2022) Evaluation of development of Apple Inc. stock price time series. SHS Web of Conferences. EDP Sciences, 132, 01012.
Cite this article
Zhou,H. (2024). Enhancing Stock Price Prediction: A Comparative Study of KNN, LSTM Models for Apple Inc. Advances in Economics, Management and Political Sciences,135,132-138.
Data availability
The datasets used and/or analyzed during the current study will be available from the authors upon reasonable request.
Disclaimer/Publisher's Note
The statements, opinions and data contained in all publications are solely those of the individual author(s) and contributor(s) and not of EWA Publishing and/or the editor(s). EWA Publishing and/or the editor(s) disclaim responsibility for any injury to people or property resulting from any ideas, methods, instructions or products referred to in the content.
About volume
Volume title: Proceedings of the 3rd International Conference on Financial Technology and Business Analysis
© 2024 by the author(s). Licensee EWA Publishing, Oxford, UK. This article is an open access article distributed under the terms and
conditions of the Creative Commons Attribution (CC BY) license. Authors who
publish this series agree to the following terms:
1. Authors retain copyright and grant the series right of first publication with the work simultaneously licensed under a Creative Commons
Attribution License that allows others to share the work with an acknowledgment of the work's authorship and initial publication in this
series.
2. Authors are able to enter into separate, additional contractual arrangements for the non-exclusive distribution of the series's published
version of the work (e.g., post it to an institutional repository or publish it in a book), with an acknowledgment of its initial
publication in this series.
3. Authors are permitted and encouraged to post their work online (e.g., in institutional repositories or on their website) prior to and
during the submission process, as it can lead to productive exchanges, as well as earlier and greater citation of published work (See
Open access policy for details).
References
[1]. Usmani, M., Adil, S.H., Raza, K., et al. (2016) Stock market prediction using machine learning techniques. International conference on computer and information sciences, 322-327.
[2]. Attigeri, G.V., MM, M.P., Pai, R.M., et al. (2015) Stock market prediction: A big data approach. TENCON Region Conference, 1-5.
[3]. Liu, J., Chao, F., Lin, Y.C., et al. (2019) Stock prices prediction using deep learning models. arXiv preprint:1909.12227.
[4]. Kumari, J., Sharma, V., Chauhan, S. (2021) Prediction of stock price using machine learning techniques: A survey. International conference on advances in computing, communication control and networking, 281-284.
[5]. Roy, R.P., Thiruthuvanathan, M.M. (2022) Enhanced stock market prediction using hybrid LSTM ensemble. Congress on Intelligent Systems: Proceedings of CIS, 1, 49-61.
[6]. Alkhatib, K., Najadat, H., Hmeidi, I., et al. (2013) Stock price prediction using k-nearest neighbor (kNN) algorithm. International Journal of Business, Humanities and Technology, 3(3), 32-44.
[7]. Siddartha, Reddy, A., Praneeth, M., Reddy, K.P., et al. (2024) Stock Market Trend Prediction Using K-Nearest Neighbor (KNN) Algorithm.
[8]. Chong, E., Han, C., Park, F.C. (2017) Deep learning networks for stock market analysis and prediction: Methodology, data representations, and case studies. Expert Systems with Applications, 83, 187-205.
[9]. Sreemalli, M., Chaitanya, P., Srinivas, K. (2016) Comparative analysis of machine learning techniques on stock market prediction. International Journal of Computer Science and Information Security, 14, 152-156.
[10]. Khaidem, L., Saha, S., Dey, S.R. (2016) Predicting the direction of stock market prices using random forest. arXiv preprint:1605.00003.
[11]. Horák, J., Kaisler, D. (2022) Evaluation of development of Apple Inc. stock price time series. SHS Web of Conferences. EDP Sciences, 132, 01012.