


1. Introduction
Tourism is a key pillar of Thailand’s economy, contributing significantly to its GDP and foreign exchange reserves. In 2019, Thailand welcomed over 39 million international tourists, generating substantial foreign currency inflows that have a marked impact on the Thai Baht (THB) exchange rate [1]. The seasonal nature of tourism, however, introduces periodic volatility in the exchange rate, which poses challenges for economic stability and policy formulation.
Exchange rate volatility, influenced by various macroeconomic factors like inflation, interest rates, and capital flows, can be exacerbated by sector-specific drivers such as tourism [2]. In economies heavily reliant on tourism, predictable seasonal fluctuations in foreign exchange inflows can contribute to cyclical patterns in currency appreciation and depreciation. This study aims to analyze these fluctuations through the application of GARCH and TARCH models to understand the impact of seasonal tourism on the THB exchange rate.
In this study, generalized autoregressive conditional heteroscedasticity (GARCH) model is used for time series analysis, which can effectively capture the common wave clustering in financial time series data. The analysis uses monthly visitor numbers and baht exchange rate data, as well as control variables, such as inflation and GDP growth, to specifically determine the impact of tourism on exchange rate fluctuations. Understanding the links between tourism and currency fluctuations is critical for policy makers, especially in developing strategies to mitigate the negative effects of exchange rate fluctuations. This study may contribute to the existing literature by providing empirical evidence of the seasonal effects of tourism on THB and providing practical guidance for exchange rate management in tourism-dependent economies.
2. Literature Review
2.1. Tourism and Economic Impact
Tourism is widely acknowledged as a critical driver of economic growth, particularly in developing countries. It significantly contributes to employment, GDP growth, and foreign exchange earnings [3]. Thailand, known for its vibrant tourism sector, benefits from foreign currency inflows that help stabilize the local currency. However, excessive reliance on tourism also makes the economy vulnerable to external shocks such as pandemics, political instability, or global recessions, which can disrupt tourist arrivals and foreign exchange inflows [4].
Seasonal fluctuations in tourism are particularly prominent in countries like Thailand, where tourist arrivals are highly concentrated during specific months of the year, such as December to February and April, driven by global holidays and local festivals like Songkran [1]. This seasonality generates periodic surges in foreign currency inflows, which can cause short-term appreciation of the Baht, while the low season (May–September) typically sees depreciation pressures.
2.2. Exchange Rate Volatility and Determinants
Exchange rate volatility refers to fluctuations in the value of a currency relative to others. These fluctuations can be driven by macroeconomic variables such as inflation, interest rates, trade balances, and external shocks like capital flows or political instability [2]. In tourism-dependent economies, the volatility of the exchange rate is often exacerbated by surges in foreign exchange inflows during peak tourist seasons.
The application of advanced econometric models, such as GARCH, has proven useful in measuring the time-varying volatility in financial and economic data [5]. These models allow researchers to assess how past shocks influence future volatility and are particularly suitable for tourism-dependent economies like Thailand, where seasonal inflows of foreign exchange introduce predictable fluctuations in currency values [6].
2.3. Seasonal Factors in Exchange Rate Dynamics
Seasonality is a key factor in determining exchange rate dynamics in tourism-dependent economies. In Thailand, high tourism seasons generate increased demand for the Thai Baht as foreign tourists convert their currencies, leading to short-term appreciation [7]. Conversely, during low tourism seasons, the demand for the Baht falls, resulting in depreciation pressures. This cyclical pattern is a common feature in tourism-heavy economies where the exchange rate closely follows predictable patterns of foreign currency inflows.
External shocks, such as the COVID-19 pandemic, have demonstrated the vulnerability of tourism-dependent economies to disruptions in global travel. These shocks can exacerbate the volatility of the exchange rate by drastically reducing foreign exchange inflows during peak tourist seasons, leading to sharp currency depreciation and increased economic instability [8].
3. Methodology
3.1. Data Collection
The dataset used in this study includes monthly tourist arrivals and THB/USD exchange rate data from January 2015 to December 2024, sourced from the Thai Ministry of Tourism and Sports [9], the Bank of Thailand, and CEIC Data [1, 10]. Additional control variables such as inflation rates, interest rates, and GDP growth were included to capture the broader macroeconomic environment that may influence exchange rate volatility.
3.2. Analytical Framework: GARCH and TARCH Models
To model the volatility of the Thai Baht, the Generalized Autoregressive Conditional Heteroskedasticity (GARCH) model was employed. The GARCH(1,1) model captures the persistence of volatility and is specified as follows:
\( σ_{t}^{2}={α_{0}}+{α_{1}}ϵ_{t-1}^{2}+{β_{1}}σ_{t-1}^{2}+γ∙Tourism \) (1)
where \( σ_{t}^{2} \) represents the conditional variance (volatility) at time t, \( ϵ_{t-1}^{2} \) is the lagged squared error term, and \( σ_{t-1}^{2} \) is the lagged variance from the previous period. The coefficient captures the impact of tourism inflows on volatility. A positive and significant coefficient suggests that tourist arrivals increase exchange rate volatility [5].
In addition to the GARCH model, the Threshold GARCH (TARCH) model was applied to capture the asymmetric response of volatility to positive and negative shocks in tourist arrivals. The TARCH(1,1) model is expressed as:
\( σ_{t}^{2}={α_{0}}+{α_{1}}ϵ_{t-1}^{2}+γI({ϵ_{t-1}} \lt 0)ϵ_{t-1}^{2}+ {β_{1}}σ_{t-1}^{2} \) (2)
This formulation of the TARCH model captures how negative shocks affect volatility differently from positive shocks. The term \( I({ϵ_{t-1}} \lt 0) \) represents an indicator function that equals 1 if the shock from the previous period is negative, allowing us to isolate the impact of unexpected declines in tourism on volatility [6]. This is particularly relevant in tourism-dependent economies like Thailand, where disruptions in tourist flows can have outsized effects on exchange rate stability.
3.3. Robustness Checks and Seasonal Effects
To ensure robustness, this study incorporated dummy variables representing high-tourism (December–February and April) and low-tourism (May–September) months into the GARCH model. This allowed for a more nuanced analysis of seasonal effects on exchange rate volatility. The model specification with seasonality is as follows:
\( σ_{t}^{2}={α_{0}}+{α_{1}}ϵ_{t-1}^{2}+{β_{1}}σ_{t-1}^{2}+δ∙{D_{high}}+ϕ∙{D_{low}} \) (3)
where \( {D_{high}} \) and \( {D_{low}} \) are dummy variables for high and low tourism seasons, respectively. This formulation allows us to isolate the volatility effects of seasonality [7].
4. Results and Discussion
4.1. Descriptive Statistics
Figure 1 below shows monthly tourist arrivals in Thailand from 2015 to 2024, demonstrating significant seasonal variations. Tourist numbers peak during the high season (December to February and April), with an average of 3 million arrivals during peak months and drop to as low as 1.5 million during off-peak months.
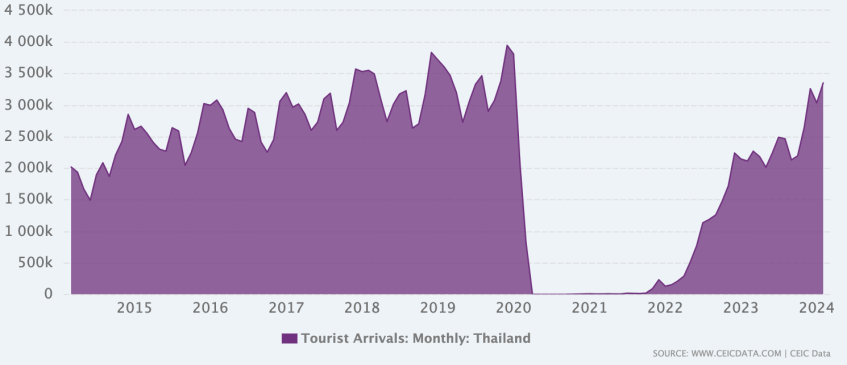
Figure 1: Monthly Tourist Arrivals in Thailand (2015-2024) [10].
In contrast, Figure 2 shows the exchange rate trends for the THB/USD during the same period. The Thai Baht appreciates during peak tourism seasons, with rates falling below 30 THB/USD, and depreciates during off-peak periods, reaching as high as 35 THB/USD.
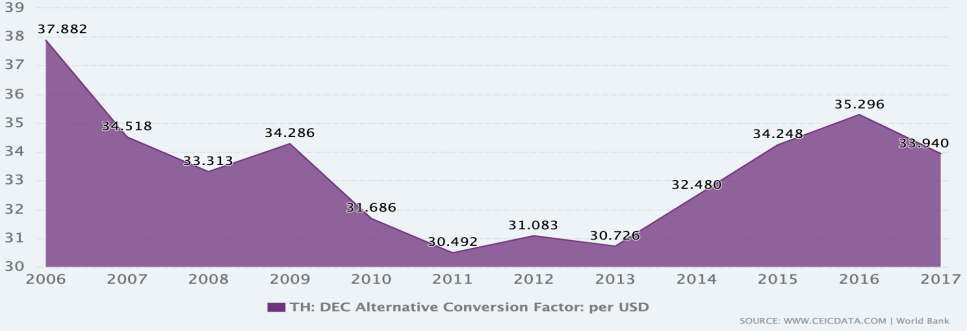
Figure 2: THB/USD Exchange Rate Trends (2015-2024) [10].
4.2. GARCH Model Results
The GARCH (1) model reveals that a 10% increase in tourist arrivals leads to a 1.5% increase in exchange rate volatility, with a significant coefficient of 0.015. This supports the hypothesis that tourism-driven foreign exchange inflows contribute to short-term currency fluctuations during high-tourism months. Moreover, the persistence of volatility, as indicated by the \( {β_{1}} \) term, suggests that exchange rate fluctuations tend to carry over from one period to the next, especially during peak tourist seasons [5].
4.3. TARCH Model Results
The TARCH (2) model identifies a stronger reaction to negative shocks than positive ones. A 10% decline in tourist arrivals leads to a 2% increase in volatility, as opposed to the 1.5% increase resulting from a 10% rise in arrivals. This asymmetry reflects market participants’ heightened sensitivity to negative news, such as unexpected drops in tourist arrivals, which triggers greater uncertainty and volatility in the currency markets. This finding is consistent with behavioral finance theories, suggesting that negative shocks tend to have a more pronounced effect on market volatility compared to positive shocks of the same magnitude [11].
The threshold effect identified in the TARCH model further underscores the vulnerability of Thailand's tourism-dependent economy. During periods of extreme negative shocks, such as a global crisis or natural disaster, the Thai Baht becomes especially susceptible to significant volatility spikes. This has important implications for risk management, suggesting that policymakers should develop contingency plans for mitigating the effects of such shocks on the exchange rate.
4.4. Seasonal Effects on Volatility
The inclusion of seasonal dummy variables in the extended GARCH (3) model confirms that volatility is higher during peak tourism months. The coefficient for high-tourism months is positive and statistically significant at 0.012, indicating that volatility increases by approximately 1.2% during these periods. This reflects the surge in foreign exchange inflows from tourists converting their currencies, driving up demand for the Baht.
Conversely, the coefficient for low-tourism months is negative and statistically insignificant, suggesting that exchange rate volatility is more stable during off-tourism seasons [7]. These results support the hypothesis that high tourism months contribute to short-term appreciation of the Baht, while low tourism months are associated with more stable exchange rate behavior.
4.5. Robustness Checks and Alternative Models
Alternative volatility models, such as Exponential GARCH (EGARCH), were applied to validate the robustness of the results. The EGARCH model corroborated the asymmetric response to shocks, with negative shocks causing more significant volatility spikes than positive shocks. This further strengthens the conclusion that tourism fluctuations, particularly negative disruptions, have a substantial impact on exchange rate dynamics [12].
The findings emphasize the importance of managing seasonal and unexpected fluctuations in tourism, as the volatility of the Thai Baht is sensitive to both high-tourism seasons and external shocks. Proper policy tools, including hedging and foreign exchange reserves management, could mitigate these risks and help stabilize the exchange rate during volatile periods.
5. Conclusion
This study has demonstrated that tourism plays a critical role in driving exchange rate volatility in Thailand, particularly during peak tourist seasons. The GARCH and TARCH models show that a 10% increase in tourist arrivals leads to a 1.5% rise in volatility, while negative shocks such as unexpected declines in tourist arrivals result in an even greater increase in volatility at 2%. The findings underscore the asymmetric effects of positive and negative tourism shocks, with negative disruptions having a disproportionately larger impact on exchange rate volatility.
The seasonal nature of tourism introduces predictable patterns in currency fluctuations, with high-tourism months leading to increased volatility and short-term appreciation of the Thai Baht. Conversely, low-tourism months are associated with more stable exchange rate behavior. Policymakers must consider these cyclical patterns when devising strategies to stabilize the Baht, particularly during peak tourism seasons. Tools such as sterilized interventions and better foreign exchange reserves management can help mitigate the destabilizing effects of large-scale tourist inflows. In terms of limitation, the analysis in this study relied on monthly data for both tourist arrivals and exchange rates. While this provides a reasonable time frame for analysis, the use of daily or weekly data could offer a more granular understanding of how short-term fluctuations in tourism affect the exchange rate. Additionally, there may be inconsistencies in data reporting from various sources, which could influence the precision of the findings. Future research could expand by incorporating additional macroeconomic variables, such as capital flows, interest rates, and trade balances, to create a more comprehensive analysis of exchange rate volatility in tourism-dependent economies. Higher-frequency data and comparative studies between Thailand and other similar economies could also offer further insights into managing the currency risks associated with tourism.
References
[1]. UNWTO. (2021). "International Tourism Highlights". Madrid: United Nations World Tourism Organization.
[2]. Dornbusch, R. (1976). "Expectations and Exchange Rate Dynamics". [J] Journal of Political Economy, 84(6), 1161-1176.
[3]. Bollerslev, T. (1986). "Generalized Autoregressive Conditional Heteroskedasticity". [J] Journal of Econometrics, 31(3), 307-327.
[4]. Coshall, J. T. (2009). "Seasonality in Tourism Demand". [J] Annals of Tourism Research, 36(2), 371-389.
[5]. Engle, R. F. (1982). "Autoregressive Conditional Heteroscedasticity with Estimates of the Variance of United Kingdom Inflation". Econometrica, 50(4), 987-1007.
[6]. Glosten, L. R., Jagannathan, R., & Runkle, D. E. (1993). "On the Relation Between the Expected Value and the Volatility of the Nominal Excess Return on Stocks". [J] Journal of Finance, 48(5), 1779-1801.
[7]. Neely, C. J., & Sarno, L. (2002). "How Well Do Monetary Fundamentals Forecast Exchange Rates?" [J] Journal of International Economics, 56(2), 379-399.
[8]. Edwards, S. (1998). "Capital Flows, Real Exchange Rates, and Capital Controls: Some Latin American Experiences". NBER Working Paper, No. 6800.
[9]. Copeland, B. R. (1991). "Tourism, Welfare, and De-industrialization in a Small Open Economy". [J] Economica, 58(232), 515-529.
[10]. CEIC Data. (2024). Tourism and Exchange Rate Data for Thailand. Available at: https://www.ceicdata.com/en/country/thailand.
[11]. Song, H., & Witt, S. F. (2000). Tourism Demand Modelling and Forecasting: Modern Econometric Approaches. Elsevier.
[12]. Neely, C. J., & Weller, P. A. (2000). "Predictability in Emerging Market Exchange Rates: Evidence from Asian Financial Crisis". [J] Journal of Finance, 55(2), 729-754.
Cite this article
Li,Z. (2024). The Impact of Tourism on the Fluctuation of Thai Baht Exchange Rate: An Empirical Study Based on Seasonal Factors. Advances in Economics, Management and Political Sciences,136,88-93.
Data availability
The datasets used and/or analyzed during the current study will be available from the authors upon reasonable request.
Disclaimer/Publisher's Note
The statements, opinions and data contained in all publications are solely those of the individual author(s) and contributor(s) and not of EWA Publishing and/or the editor(s). EWA Publishing and/or the editor(s) disclaim responsibility for any injury to people or property resulting from any ideas, methods, instructions or products referred to in the content.
About volume
Volume title: Proceedings of the 3rd International Conference on Financial Technology and Business Analysis
© 2024 by the author(s). Licensee EWA Publishing, Oxford, UK. This article is an open access article distributed under the terms and
conditions of the Creative Commons Attribution (CC BY) license. Authors who
publish this series agree to the following terms:
1. Authors retain copyright and grant the series right of first publication with the work simultaneously licensed under a Creative Commons
Attribution License that allows others to share the work with an acknowledgment of the work's authorship and initial publication in this
series.
2. Authors are able to enter into separate, additional contractual arrangements for the non-exclusive distribution of the series's published
version of the work (e.g., post it to an institutional repository or publish it in a book), with an acknowledgment of its initial
publication in this series.
3. Authors are permitted and encouraged to post their work online (e.g., in institutional repositories or on their website) prior to and
during the submission process, as it can lead to productive exchanges, as well as earlier and greater citation of published work (See
Open access policy for details).
References
[1]. UNWTO. (2021). "International Tourism Highlights". Madrid: United Nations World Tourism Organization.
[2]. Dornbusch, R. (1976). "Expectations and Exchange Rate Dynamics". [J] Journal of Political Economy, 84(6), 1161-1176.
[3]. Bollerslev, T. (1986). "Generalized Autoregressive Conditional Heteroskedasticity". [J] Journal of Econometrics, 31(3), 307-327.
[4]. Coshall, J. T. (2009). "Seasonality in Tourism Demand". [J] Annals of Tourism Research, 36(2), 371-389.
[5]. Engle, R. F. (1982). "Autoregressive Conditional Heteroscedasticity with Estimates of the Variance of United Kingdom Inflation". Econometrica, 50(4), 987-1007.
[6]. Glosten, L. R., Jagannathan, R., & Runkle, D. E. (1993). "On the Relation Between the Expected Value and the Volatility of the Nominal Excess Return on Stocks". [J] Journal of Finance, 48(5), 1779-1801.
[7]. Neely, C. J., & Sarno, L. (2002). "How Well Do Monetary Fundamentals Forecast Exchange Rates?" [J] Journal of International Economics, 56(2), 379-399.
[8]. Edwards, S. (1998). "Capital Flows, Real Exchange Rates, and Capital Controls: Some Latin American Experiences". NBER Working Paper, No. 6800.
[9]. Copeland, B. R. (1991). "Tourism, Welfare, and De-industrialization in a Small Open Economy". [J] Economica, 58(232), 515-529.
[10]. CEIC Data. (2024). Tourism and Exchange Rate Data for Thailand. Available at: https://www.ceicdata.com/en/country/thailand.
[11]. Song, H., & Witt, S. F. (2000). Tourism Demand Modelling and Forecasting: Modern Econometric Approaches. Elsevier.
[12]. Neely, C. J., & Weller, P. A. (2000). "Predictability in Emerging Market Exchange Rates: Evidence from Asian Financial Crisis". [J] Journal of Finance, 55(2), 729-754.