


1. Introduction
In China, the real estate market has always been an issue that makes most people anxious, and it is also an issue worthy of discussion and research. Both renting and buying are expensive and confusing. Some people choose to rent all their lives, while others will try their best to save up for a down payment. However, in relatively developed countries like China and the United States, there are many other factors, such as the household registration problem, which will increase the price several times. Therefore, this study chooses India, which has a large territory and a large population like China and the United States, but has relatively few other factors, as the data source. Although it is a data set of the rental housing market, its factors and results will also directly affect and reflect the current situation and future of the whole real estate market.
Rental housing is an important part of the urban housing tenure system, and also an important part of the upward mobility stage of migrant workers from shanty towns to self-owned housing. While the problem of housing deprivation and affordability remains for many families, the new phenomenon of a sharp increase in the number of vacant homes over the past decade has made the housing problem even more acute. It establishes the manifestation of growing inequality between those in need of housing and those who are well-off [1]. In the current environment of global economic recession, people's lives have become more constrained and formal. At the same time, there will be many social problems, including unemployment and so on. Workers often move from one city to another for better living conditions as well as economic factors, especially to urban areas, leading to an increase in the demand and price of rental housing [2].
Rents in India have been increasing significantly since the start of the pandemic. In this case, it is important for consumers to have a reasonable concept of the rental price, otherwise, they may be affected by the landlord deliberately raising the rent and thus face a more distress situation [3]. Rental housing in India has declined significantly in recent years for a variety of reasons, including the nature of rent-related laws or policies [4]. In sum, the housing market is a vehicle that can reflect the socio-economic environment. Accurate forecasting of house rental prices is a critical issue in real estate, helping tenants and landlords make informed decisions [5]. Studies in traditional economics and housing markets argue that there is a strong relationship between excess demand and actual vacancy rates, which is reflected in the deviation of actual vacancy rates from some long-term normal or ideal level and the fluctuation of rental housing service prices [6].
This study will be of great benefit to housing developers and researchers to analytically derive the most important attributes that determine housing prices and to acknowledge the best machine learning models for research in this area [7]. Determining what the influencing factors are is the most important step in understanding the changes in the rent-price ratio [8].
Prior to this, people have collected a large amount of data, as well as relevant policies and provisions, and combined them with the social environment to basically find out the influencing factors at the social level. However, the author should return to the essence, through the method of machine learning, find out the most fundamental and basic influencing factors, put aside the influence of social factors, find the basic cause of concern, and make a prediction model.
To achieve the stated objectives, the learning process must follow a systematic approach. Initially, data analysis should be conducted to uncover underlying linear relationships and logical structures. Next, an appropriate predictive model must be selected from various options. The chosen model's accuracy is then tested. A high accuracy rate enables the author to make a fundamental price prediction, controlling for various variables and conditions without external influences. This approach aids in identifying optimal choices within fixed budget constraints and serves as a basic investment reference. By providing a more reliable standard, it assists individuals in making informed decisions regarding real estate purchases and sales in the future.
2. Methodology
2.1. Dataset Description and Preprocessing
The dataset used in this study can be found on Kaggle [9]. Compared with a relatively developed country with a relatively good economic situation like China, the author prefers to choose a relatively backward country like India for research, because it will be more reference and can avoid some price inflation and speculation. This data set is the creation of Sourav Banerjee [10], who is an Indian, so the data will be more accurate.
Prior to conducting the study, the author pre-processed the data. Start by understanding the types of the data, as well as basic information about the data, such as its size, shape, and the number of columns and entries. Then make sure no data is missing, and find numerical features and categorical features separately. The content of the data set is shown in Table 1.
Table 1: The data columns.
BHK(Bedroom, Hall, Kitchen) | Rent |
Size | Floor |
Area type | Area locality |
City | Furnishing status |
Tenant preferred | Bathroom |
Point of contract |
2.2. Proposed Approach
This learning analyzes the actual data, finds its linear logic relationship, and then realizes the prediction of rental price through the machine learning of the model. However, the prediction results are not only applicable to the rental price, but also can play a reference role in the whole real estate market. When buying a house, it is also a kind of investment advice and prediction for the future. People can use this study to protect thesis’ own interests, and will also have a basic understanding of the whole real estate market. Firstly, the author needs to analyze the data to understand the distribution of the data, secondly, the author needs to find the linear relationship and the related factors behind it, and then need to rank the importance of the variables to find main reference factors, and then need to select the optimal model and complete the prediction by sorting the numerical analysis of the model. Finally, the accuracy of the prediction model and the results are evaluated. The process is shown in Figure 1.
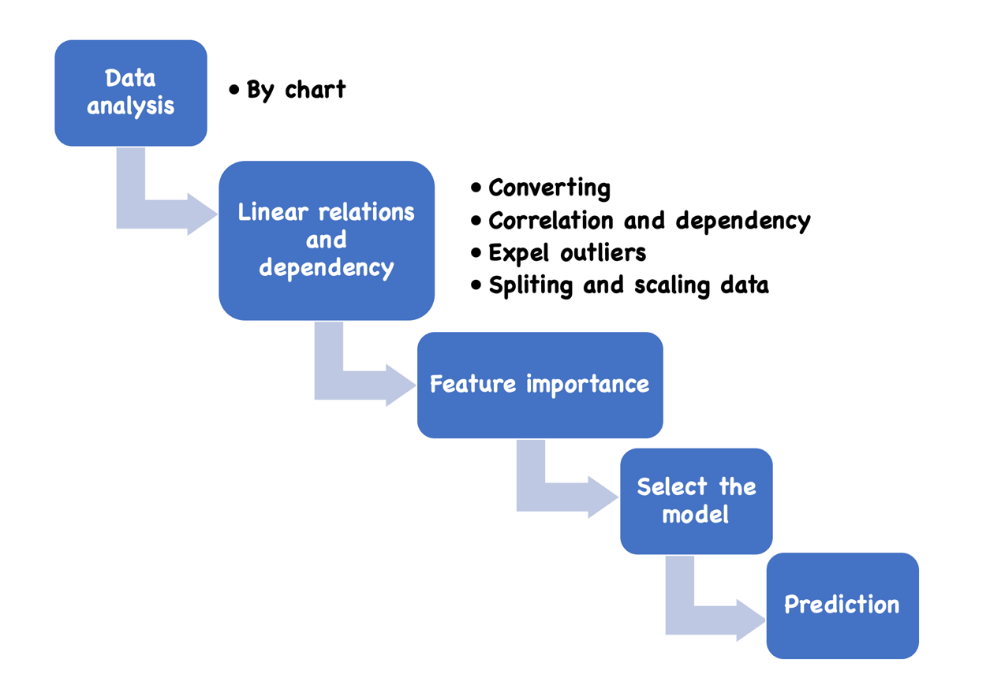
Figure 1: The pipeline of the model.
2.2.1. Random Forest
A Random Forest is an ensemble classifier made up of multiple decision trees, capable of addressing classification and regression tasks, as well as dimensionality reduction challenges. It exhibits strong resilience to outliers and noise, often outperforming individual decision trees in terms of prediction accuracy and classification effectiveness.
The construction of each tree follows a specific process: let N denote the number of training samples and M represent the total number of features. The input feature count m is used to make decisions at each node within the tree; typically, m should be significantly less than M. A bootstrap sampling method is employed to randomly select N samples from the original dataset to create a training set while using the remaining unselected samples for error evaluation during predictions. For every node in the tree, m features are chosen at random, with decisions based on these selected features determining how splits are made optimally. Each tree grows fully without any pruning initially; however, pruning may be applied after constructing a standard tree classifier if needed.
In order to get the importance of features, this study need to use Random Forest Regressor to confirm.
The author chooses to train this model with the training set and the target variable training set. The importance order of its features can be intuitively seen through the bar plot. As for the result, the Point of contract has the highest importance, indicating that people pay more attention to the rigor and terms of the contract. Second, size and city. This reflects that people have strict requirements and high expectations for the size of urban space. This is followed by total floor and bathroom, while the rest are relatively low.
2.2.2. Extreme Gradient Boosting (XGBoost)
XGBoost is a highly optimized library for distributed gradient boosting, designed to be efficient, adaptable, and portable. It implements machine learning algorithms within the Gradient Boosting framework. XGBoost features parallel tree boosting (also referred to as Gradient Boosting Decision Tree (GBDT) or Gradient Boosting Machines (GBM)), enabling rapid and accurate solutions to various data science challenges.
This library enhances the traditional gradient boosting algorithm by employing the Newton method to identify extreme values of the loss function. It utilizes a second-order Taylor expansion of this loss function while incorporating a regularization term. The objective function during training comprises two components: the first being the loss from the gradient boosting approach, and the second representing regularization. The loss function can be expressed as:
\( L(∅)=\sum _{i=1}^{n} l(y_{i}^{ \prime },{y_{i}})+\sum _{k} Ω({f_{k}})\ \ \ (1) \)
In this equation, n denotes the number of training samples; l represents individual sample loss—assumed to be convex; \( y_{i}^{ \prime } \) indicates predicted values from the model for each training sample; and \( {y_{i}} \) signifies their actual labels. The regularization term quantifies model complexity as follows:
\( Ω(f)=γT+\frac{1}{2}λ{∥ω∥^{2}}\ \ \ (2) \)
In this study, the author obtained the r squared values of train and test sets through r squared test. In general, the value of XGBoost is the highest among many models, so the author chose XGBoost to make the final prediction.
2.3. Implementation Details
The author chose Optima to perform hyperparameter optimization of the model. Using the tree method, Insert LaMDA, alpha, Col sample by tree, subsample, learning rate, n estimators, max depth, random state, min child weight, Hyperparameter optimization is performed. Find out the best combination of hyperparameters and the best root mean squared error (RMSE), then visualize them through plot, and finally get the most important hyperparameters, and use the best combination of hyperparameters to get the accuracy of train and test, so as to get the accuracy of the whole model.
3. Result and Discussion
Through data analysis, correlation exploration, model selection, and finally data set testing, this study can find the optimal model selection and its performance data. In the future, people can complete a prediction with an accuracy of about 91 percent, finding a range that will help people in their choices. At the same time, it will also be a tool that can help people make investment choices in the future, so that people can make better choices.
3.1. Data Analysis
This study wants to explore its distribution and concentricity according to the data of the data set, so the author needs to draw the distribution diagrams of numerical features and the quantity summary diagrams of categorical features.
In addition, the most noteworthy of attention is the relationship between rent and various data, to explore whether it is positive or negative correlation or no correlation, because rent is the feature the author predict, and is also the most directly reflected in the market analysis and prediction of rental price. As for cities, due to the capital's factors, it has a more developed economy and more opportunities, so the rent in Mumbai will be higher, while other cities will be relatively lower. Therefore, people are more inclined to cities with developed economy, perfect facilities and concentrated population, which is also one of the most important factors. The second thing worth discussing is the furniture. When deciding the rent, it must be that the rent of a well-furnished house is higher, because it will save a lot of trouble of moving and selecting furniture. A half-furnished house, on the other hand, rents about two-thirds as much as a fully furnished house, leading to a larger rent gap. However, the house that does not have furniture at all is a quarter of the house that has furniture perfect, so when people are making a choice, also want to notice whether the preparation that should undertake furniture. If people choose to leave a furniture fee and charge less rent, it is also an option, which can avoid the damage of furniture, but the price performance of semi-furniture is relatively low.
3.2. Correlation Exploration
The author has to look at the correlation between each feature and all the other features, and through machine learning, the author can get a ratio, which is a number, from which the author can see the dependency. A positive number would indicate a positive correlation, while a negative number would indicate a negative correlation. It is shown as the Figure 2.
It is a plot that integrates all features. The ratio between any two features can be obtained through the X-axis and Y-axis, and the degree of correlation can also be judged by the depth of color.
Among them, the most significant is the ratio of current floor to total floor, which is as high as 0.86, indicating that people still attach great importance to the number of floors in a house. The second is the ratio of BHK to bathroom, which reaches 0.79. This confirms that people attach great importance to the completeness of infrastructure and the adequacy of room facilities.
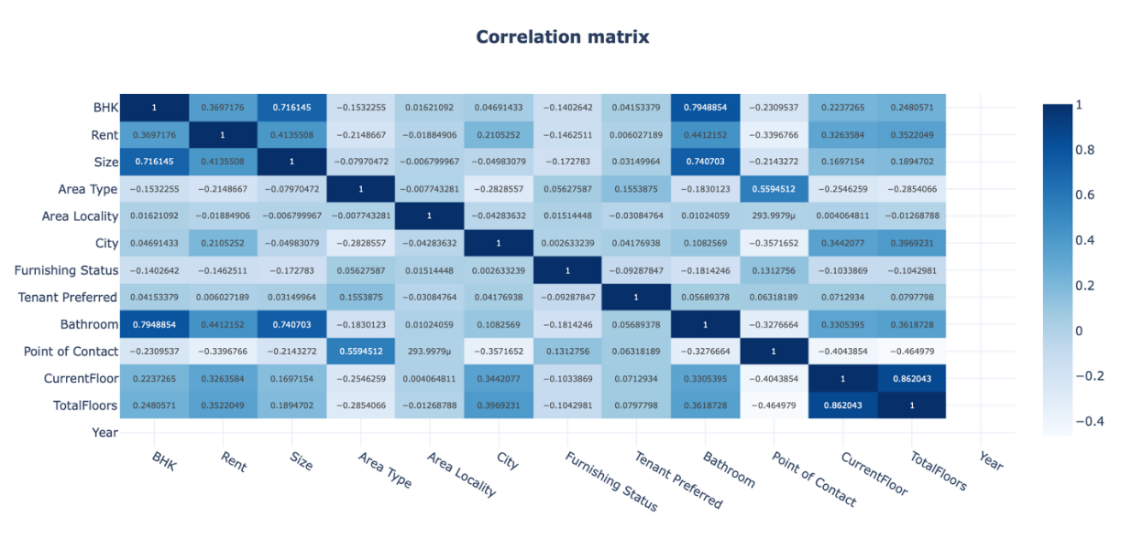
Figure 2: Correlation matrix.
3.3. Model Selection
In order to make the final analysis prediction, the author has to choose the most appropriate model to complete. There are many models with different advantages and disadvantages and different focuses to choose from in the python library. This study needs to test the data to find the model that best fits the learning and the data set to make the final prediction. So, the author is going to do a model selection.
First, the author wants to define a training set and a test set, which is the r squared here. Second, the author needs to define a function to train and evaluate the model. The author will use the training data of different training sets, and all models have the function for prediction. In addition, the r squared function calculates the scores of their respective training and test sets in the future and summarizes them into a data frame for comparison to select the optimal model.
For this learning and this data set, the author chooses to train and evaluate several models, namely Linear Regression, Ridge, Lasso, Elastic Net, Gradient Boosting, Random Forest, XGBoost, Light Gradient Boosting Machine (LightGBM) and Cat Boost.
With the Figure 3 drawn at the end, this study will finally choose the XGBoost model to complete the final analysis and prediction.
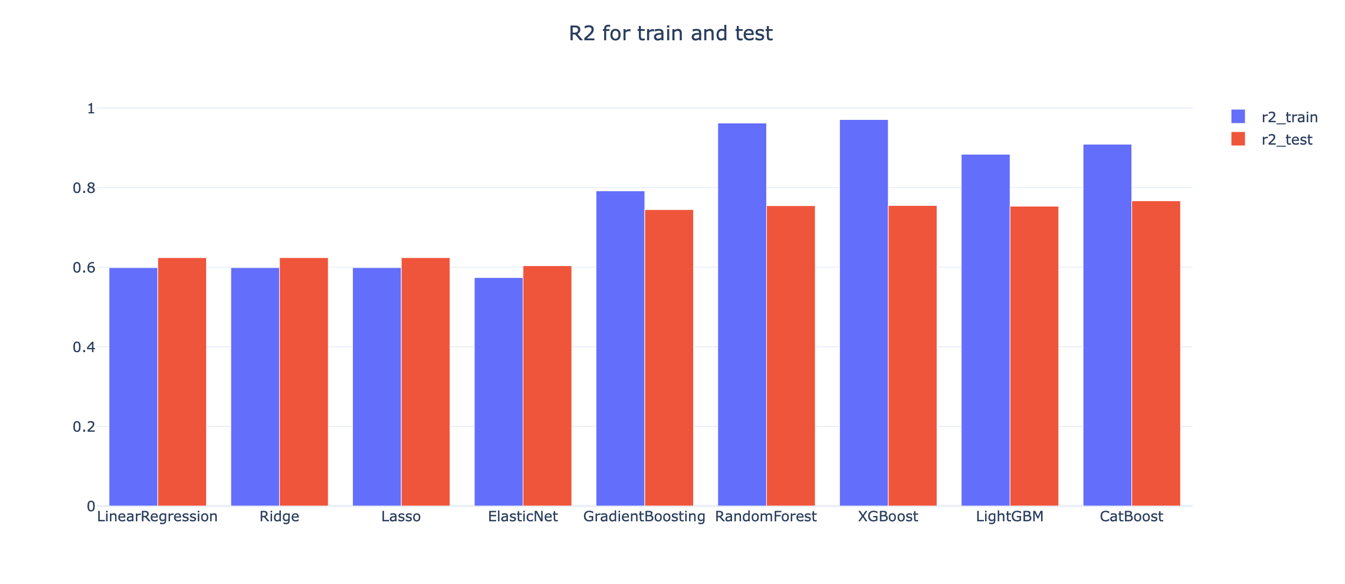
Figure 3: R2 for train and test.
In order to get the best parameter combination, the author needs to use Optima to complete the optimization of hyperparameters. And the mean squared error is evaluated and verified.
4. Conclusion
This study provides valuable insights into identifying the most effective model for predicting rental prices in India. By pinpointing the most critical variable factors among numerous influences, individuals can make more informed and economical decisions. Whether considering rental or purchase options in the future, these insights allow for the protection and enhancement of personal interests by leveraging relevant factors. Under consistent budget conditions, individuals can uncover more advantageous options with higher market value. The study offers features, models, and hyperparameters that can serve as reference points, facilitating more economical decision-making processes. This framework does not merely simplify investment choices but enriches them by incorporating cost-effectiveness considerations. In future real estate transactions, individuals will benefit from a more nuanced approach, using comprehensive reference factors rather than relying solely on simplistic criteria. This will lead to more strategic investments, enhancing the overall efficiency and value of their real estate decisions.
References
[1]. Kumar, A. (2016) India's residential rental housing. Economic and Political Weekly, 112-120.
[2]. Amenyah, I.D., Fletcher, E.A. (2013) Factors determining residential rental prices. Asian Economic and Financial Review, 3(1), 39.
[3]. Cai, Z., Zhao, Y. (2023) House Rent Analysis with Linear Regression Model—A Case Study of Six Cities in India. Highlights in Science, Engineering and Technology, 38, 576-582.
[4]. Dodman, D. (2016) Environment and urbanization. International Encyclopedia of Geography: People, the Earth, Environment and Technology: People, the Earth, Environment and Technology, 1-9.
[5]. Senthilkumar, V. (2023) Enhancing House Rental Price Prediction Models for the Swedish Market: Exploring External features, Prediction intervals and Uncertainty Management in Predicting House Rental Prices.
[6]. Rosen, K.T., Smith, L.B. (1983) The price-adjustment process for rental housing and the natural vacancy rate. The American Economic Review, 73(4), 779-786.
[7]. Zulkifley, N.H., Rahman, S.A., Ubaidullah, N.H., et al. (2020) House price prediction using a machine learning model: a survey of literature. International Journal of Modern Education and Computer Science, 12(6), 46-54.
[8]. Zhai, D., Shang, Y., Wen, H., et al. (2018) Housing price, housing rent, and rent-price ratio: Evidence from 30 cities in China. Journal of Urban Planning and Development, 144(1), 04017026.
[9]. Sourav, B. (2022) House Rent Prediction Dataset. Retrieved on 2024, Retrieved from: https://www.kaggle.com/datasets/iamsouravbanerjee/house-rent-prediction-dataset/data
[10]. Saith, A., Saith, A. (2019) Berkeley, The Launch Pad. Ajit Singh of Cambridge and Chandigarh: An Intellectual Biography of the Radical Sikh Economist, 33-53.
Cite this article
Zhang,J. (2024). Predicting Rental Prices in India: A Machine Learning Approach with Hyperparameter Optimization. Advances in Economics, Management and Political Sciences,137,160-166.
Data availability
The datasets used and/or analyzed during the current study will be available from the authors upon reasonable request.
Disclaimer/Publisher's Note
The statements, opinions and data contained in all publications are solely those of the individual author(s) and contributor(s) and not of EWA Publishing and/or the editor(s). EWA Publishing and/or the editor(s) disclaim responsibility for any injury to people or property resulting from any ideas, methods, instructions or products referred to in the content.
About volume
Volume title: Proceedings of the 3rd International Conference on Financial Technology and Business Analysis
© 2024 by the author(s). Licensee EWA Publishing, Oxford, UK. This article is an open access article distributed under the terms and
conditions of the Creative Commons Attribution (CC BY) license. Authors who
publish this series agree to the following terms:
1. Authors retain copyright and grant the series right of first publication with the work simultaneously licensed under a Creative Commons
Attribution License that allows others to share the work with an acknowledgment of the work's authorship and initial publication in this
series.
2. Authors are able to enter into separate, additional contractual arrangements for the non-exclusive distribution of the series's published
version of the work (e.g., post it to an institutional repository or publish it in a book), with an acknowledgment of its initial
publication in this series.
3. Authors are permitted and encouraged to post their work online (e.g., in institutional repositories or on their website) prior to and
during the submission process, as it can lead to productive exchanges, as well as earlier and greater citation of published work (See
Open access policy for details).
References
[1]. Kumar, A. (2016) India's residential rental housing. Economic and Political Weekly, 112-120.
[2]. Amenyah, I.D., Fletcher, E.A. (2013) Factors determining residential rental prices. Asian Economic and Financial Review, 3(1), 39.
[3]. Cai, Z., Zhao, Y. (2023) House Rent Analysis with Linear Regression Model—A Case Study of Six Cities in India. Highlights in Science, Engineering and Technology, 38, 576-582.
[4]. Dodman, D. (2016) Environment and urbanization. International Encyclopedia of Geography: People, the Earth, Environment and Technology: People, the Earth, Environment and Technology, 1-9.
[5]. Senthilkumar, V. (2023) Enhancing House Rental Price Prediction Models for the Swedish Market: Exploring External features, Prediction intervals and Uncertainty Management in Predicting House Rental Prices.
[6]. Rosen, K.T., Smith, L.B. (1983) The price-adjustment process for rental housing and the natural vacancy rate. The American Economic Review, 73(4), 779-786.
[7]. Zulkifley, N.H., Rahman, S.A., Ubaidullah, N.H., et al. (2020) House price prediction using a machine learning model: a survey of literature. International Journal of Modern Education and Computer Science, 12(6), 46-54.
[8]. Zhai, D., Shang, Y., Wen, H., et al. (2018) Housing price, housing rent, and rent-price ratio: Evidence from 30 cities in China. Journal of Urban Planning and Development, 144(1), 04017026.
[9]. Sourav, B. (2022) House Rent Prediction Dataset. Retrieved on 2024, Retrieved from: https://www.kaggle.com/datasets/iamsouravbanerjee/house-rent-prediction-dataset/data
[10]. Saith, A., Saith, A. (2019) Berkeley, The Launch Pad. Ajit Singh of Cambridge and Chandigarh: An Intellectual Biography of the Radical Sikh Economist, 33-53.