


1.Introduction
Due to its organized method to assessing the probable profitability and hazards of a purchase, investment appraisal is a crucial component of investment decision-making [1].
It involves assessing financial metrics like NPV, IRR, and payback periods to determine the viability of a project [2]. Using these tools, investors can make informed decisions, balancing short-term cash flows with long-term returns and making certain that capital is distributed effectively to maximise returns while minimising risks [3]. This approach is especially important in dynamic markets where economic conditions and costs fluctuate. Examining the investment possibilities of two investment opportunities, this paper demonstrates how to apply the investment appraisal techniques of NPV, IRR, and payback periods. The primary goal is to assess which project presents a more favourable investment opportunity under different economic conditions by providing a comprehensive financial evaluation. To achieve this, detailed financial models are developed to simulate cash flows for each property. These models account for rental income, maintenance costs, taxes, and potential appreciation over ten years. By calculating the NPV, the report precisely assesses each property’s financial viability. Additionally, IRR is used to evaluate the efficiency of the investments, while the payback period determines the time required to recover the initial capital. The analysis aims to provide well-founded investment recommendations, offering insights into how each property performs under various economic scenarios. The contribution of this research lies in its practical application of these financial metrics, offering investors a structured framework for opting on ventures with awareness based on profitability, efficiency and liquidity.
2.Methodology
2.1.NPV
Net present value (NPV) is a measure of how different cash inflows and outflows over a certain amount of time are from one another. The project's projected revenue is examined using net present value (NPV) in the capital budget and investment plan [4]. NPV is the outcome of calculating the present value of future earnings lines using a reasonable rate of discounting. A endeavor with an NPV that is higher than zero is often more worthwhile to pursue than one with a NPV that lower than 0 [5].
2.2.IRR
A measurement used in financial research to calculate the planned degree of investment effectiveness is the internal rate of return, or IRR [6]. The rate of discount used in the discounted cash flow analysis to zero out the net present value of all cash flows is known as the internal rate of return. The identical method used to calculate NPV is used to compute it. Recall that the yearly return, not the project's actual monetary worth (IRR), is what reduces net present value (NPV) to zero [7].
2.3.Payback period
An investment's period of payback is the amount of time spent to recoup its costs. It is, in simple terms, the amount of time required by an investment to begin to make into money. [8] The time necessary for payback is vital since the main incentive for inputs made by businesses and investors is to generate a profit. The appeal rises with a shorter payback period [9]. The payback period, which is arrived at by dividing the first money invested by the standard cash flow, is useful information for anybody to know.
3.Case study
3.1.Case Background Introduction
Making well-informed decisions in real estate investing requires having a solid understanding of a property's financial viability through the use of robust financial measures. The aim of the research is to use two residential apartments' investment potential utilizing important measures including payback period, IRR, and NPV. The analysis will compare the financial performance of two investment properties under different economic conditions, helping investors determine which property offers superior returns over a 10-year year.
The first property (Flat 1) has an initial value of £557,259 and generates a monthly rental income of £1,022, with a projected annual rent increase of 7%. The maintenance cost for this property starts at £56.78 per month and rises by 0.70% annually. The second property (Flat 2), valued at £300,062, has a monthly rental income of £750, with a significantly higher annual rent increase of 75%. However, the maintenance cost for this property starts at £44.12 and increases at a rate of 9.29% annually, tied to the rent increase. Both properties are subject to a tax rate of 14%, with their values expected to appreciate by 1.75% annually over the next ten years.
3.2.Analysis and discussion
In order to evaluate the rental income streams' profitability after taxes and maintenance expenditures, the NPV of the cash flows for each property will be calculated in this study. At the conclusion of the 10 years, the NPV of the sales price after capital gains tax will also be calculated. The pace at which the NPV drops to zero will then be determined by calculating the IRR for each property, enabling a comparison of the efficiency of returns. The payback period will next be examined to determine how soon rental revenue and a potential sale can allow the initial investment to be recovered.
3.2.1.Net present value
In this section, the Net Present Value (NPV) tackle was used to evaluate the financial sustainability of both properties, and an interest rate of 3.03% was employed throughout the project. The discount factor used for the analysis was 0.97, calculated based on the assumption that the interest rate remains constant over the 10-year investment period.
The initial investment for Flat 1 was £557,259, while for Flat 2, it was £300,062. The NPVs of these initial investments were computed as negative values because they represent the upfront capital outlay required to purchase each flat. The resulting NPVs were -£557,259 for Flat 1 and -£300,062 for Flat 2.
As for the rental income analysis, after accounting for taxes and maintenance costs, it revealed that the NPV of income for Flat 1 amounted to £118,839.93, while Flat 2 generated a lower NPV of £65,213. Despite Flat 1’s higher rental income, Flat 2 demonstrated a more efficient return than its lower initial investment.
At the end of the ten years, both flats were assumed to be sold. The sale price for Flat 1 was projected to be £662,828.65, with a corresponding capital gain of £105,569.65. Flat 2’s sale price was £356,907.09, with a capital gain of £56,845.09. After applying capital gains taxes (14%), the net sale price after tax for Flat 1 was £648,048.90, and Flat 2’s was £348,948.78.
The NPV of the price after tax was calculated as £480,806.99 for room 1 and £258,895.61 for room 2. These figures highlight the higher resale value of Flat 1, but also underscore the relative affordability and profitability of Flat 2.
When combining the NPVs of the initial investments, rental incomes, and sales after taxes, the total NPV for Flat 1 was £42,387.92, while Flat 2 had a total NPV of £24,046.60. (Table 1) This demonstrates that investing in both flats yields a positive return over the ten years, although individual performance varies depending on the property’s initial investment and income potential. This analysis suggests that while Flat 1 provides a higher absolute return, Flat 2 delivers a comparable return at a much lower initial cost.
Table 1: NPV analysis of Flat 1 and 2
|
Summary of NPV Analysis |
Flat 1 (£) |
Flat 2 (£) |
|
Initial investment |
-557,259.00 |
-300,062.00 |
|
NPV of income after tax |
118,839.93 |
65,213.00 |
|
Sales price after tax |
648,048.90 |
348,948.78 |
|
NPV of sale after tax |
480,806.99 |
258,895.61 |
|
Total NPV |
42,387.92 |
240,046.60 |
By comparing the total NPVs of both flats with their initial investments, it was found that Flat 1 has a yield of 7.61%, while Flat 2 offers a slightly higher yield of 8.01%. On an annualised basis, these yields translate to 0.76% for Flat 1 and 0.80% for Flat 2. This suggests that although Flat 1 delivers higher total returns, Flat 2 provides a better return relative to its lower cost, making it a more efficient investment in yield.
In conclusion, the NPV analysis indicates that while Flat 1 generates higher absolute returns due to its larger initial investment, Flat 2 offers a more efficient return on investment. Investors must consider both the total value and the relative efficiency of the investment when making their decision, depending on their financial goals and capital availability.
3.2.2.IRR analysis
The fiscal sustainability of both properties was assessed in this part using the NPV method, and an interest rate of 3.03% was applied the entire project.
The two apartments' net present values (NPVs) were to be calculated at a range of interest rates, from 0.5% to 10%, with increments of 0.5%. (Table 2) This approach allowed for a detailed comparison of the two investments under different financial conditions. As shown in the table and the accompanying graph, Flat 1 and Flat 2 experience a steady decline in NPV as the interest rate increases. At an interest rate of approximately 4%, the NPV for both properties crosses zero, indicating that the investments break even at this rate.
Table 2: NPV of Flat 1 & 2 in different interest rate
|
Interest rate |
NPV Flat 1 |
NPV Flat 2 |
Grand Total |
|
0.005 |
195,090.84 |
105,499.22 |
300,590.06 |
|
0.010 |
161,546.81 |
87,607.25 |
249,154.06 |
|
0.015 |
129,728.52 |
70,635.05 |
200,363.56 |
|
0.020 |
99,538.26 |
54,530.49 |
154,068.75 |
|
0.025 |
70,884.31 |
39,244.69 |
110,129.00 |
|
0.030 |
43,680.57 |
24,731.74 |
68,412.32 |
|
0.035 |
17,846.17 |
10,948.53 |
28,794.70 |
|
0.040 |
-6,694.88 |
-2,145.44 |
-8,840.33 |
|
0.045 |
-30,013.99 |
-14,588.25 |
-44,602.24 |
|
0.050 |
-52,178.28 |
-26,415.66 |
-78,593.94 |
|
0.055 |
-73,250.86 |
-37,661.33 |
-110,912.20 |
|
0.060 |
-93,291.13 |
-48,356.91 |
-141,648.04 |
|
0.065 |
-112,354.94 |
-58,532.17 |
-170,887.11 |
|
0.070 |
-130,494.89 |
-68,215.13 |
-198,710.02 |
|
0.075 |
-147,760.48 |
-77,432.19 |
-225,192.67 |
|
0.080 |
-164,198.33 |
-86,208.19 |
-250,406.52 |
|
0.085 |
-179,852.38 |
-94,566.54 |
-274,418.92 |
|
0.090 |
-194,764.00 |
-102,529.30 |
-297,293.31 |
Using Excel’s built-in IRR function, it can compute that the IRR for Flat 1 is approximately 3.87%, while Flat 2’s IRR is slightly higher at 3.92%. These values indicate that, although both properties have similar rates of return, Flat 2 presents a marginally better investment opportunity in terms of return efficiency relative to the initial capital outlay.
Figure 1 also reveals a crossover point where the NPVs of both flats intersect. This crossover occurs around an interest rate of 4%, suggesting that at rates below 4%, Flat 1 has a higher NPV, whereas at rates above 4%, Flat 2 becomes the more profitable investment.
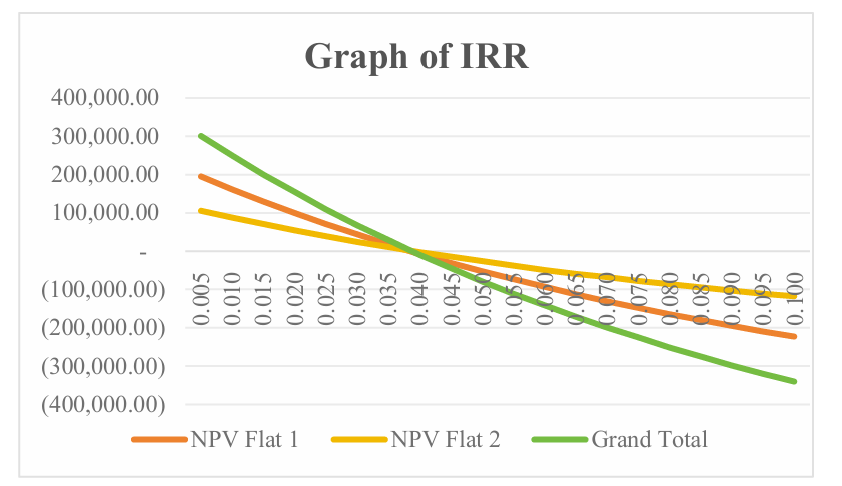
Figure 1: IRR of Flat 1 and Flat 2
(Picture credit: Original)
Overall, Flat 2’s IRR is higher than that of Flat 1, making it a more attractive option in terms of return on investment. However, the investment decision should also consider risk tolerance, capital availability, and future market conditions, particularly interest rate fluctuations.
3.2.3.Payback Period
The amount of time needed for an investment to produce sufficient cash flows to cover its initial cost is known as the payback period. This study tracked the cumulative cash flows over a ten-year period in order to determine the payback durations for Flats 1 and 2. The computation takes into account the entire cash flows from rental income, less any taxes and upkeep expenses, as well as the final sale of each property at the conclusion of the ten years.
The payback time for Flat 1 is 120 months (10 years), which ends with the property sale in the last year. For the first nine years, cumulative cash flows are negative, mostly because to the large original expenditure and the modest growth in rental income. The investment breaks even when, at the end of the tenth year, the flat is sold for enough money to pay the original outlay as well as the total cost of ownership. According to calculations, Flat 1's internal rate of return (IRR) is 3.87%. Likewise, Flat 2 has a 120-month payback period (10 years), and it isn't until the property is sold in the last year that the investment turns from negative to positive cumulative cash flows. Although Flat 2's rental revenue growth rate is larger than that of Flat 1, its lower original investment means that until the property is sold, its cash flows will not completely cover the initial cost. Reflecting its more efficient return in comparison to the initial outlay, Flat 2's IRR, at 3.92%, is marginally greater than Flat 1's.
Both investments reach a breakeven point only in the tenth year, as the sale of each property plays a critical role in generating sufficient cash flows to offset the initial capital outlays. While Flat 1 and Flat 2 exhibit similar payback periods, the marginally higher IRR for Flat 2 suggests that it may be the better option regarding investment efficiency.
The analysis shows that both properties require ten years to recover the initial investment, primarily relying on the final year’s sale to generate positive cumulative cash flows. When making investment decisions, investors should weigh these payback periods against other factors, such as risk and liquidity needs.
4.Discussion
While NPV, IRR, and the Payback Period are widely used financial metrics for evaluating investments, each has inherent limitations that must be considered when making investment decisions, and this can alco found from the analysis on the case above [10].
4.1.Disadvantages of NPV
Net Present Value (NPV) factors in an ongoing cost of capital for the project. In actuality, though, the cost of capital might vary as a result of shifting interest rates, economic cycles, or market conditions. If these variations are overlooked, this could result in values that are not appropriate. The precision of net present value computations is significantly reliant on the dependability of forthcoming cash flow forecasts. The resulting net present value (NPV) will be deceptive and may lead to unwise investment decisions if these estimates are inaccurate—due to unanticipated costs, market downturns, or faulty assumptions.
4.2.Disadvantages of IRR
IRR makes the assumption that any investment's intermediate cash flows can be reinvested at a rate equal to the calculated IRR. This assumption frequently overstates the project's potential profits because there may not always be opportunities to reinvest at the same rate due to changing market conditions. Additionally, IRR and NPV both make the assumption that the cost of capital will not change during the course of the project. The accuracy of the IRR computation can be impacted by the variability of capital costs in real-world scenarios, which should be taken into consideration.
4.3.Disadvantages of the Payback period
Any cash flows that are generated exceeding the time necessary to recover the initial investment aren't included in the payback period. As a result, it may underestimate the viability of long-term projects that generate substantial cash flows beyond the payback period. Furthermore, the time frame for payback, which only considers financial returns, ignores other strategic factors like the project's ability to improve market positioning or being consistent with the company's long-term goals. This might contribute to decisions that favour immediate financial gain above long-term strategic value.
These measurements offer insightful information about an investment's financial sustainability, but it's important to be aware of their limits before using them. A comprehensive investment analysis should integrate multiple financial tools and consider qualitative factors to ensure a more balanced and informed decision-making process.
5.Conclusion
The importance of employing financial metrics—Net Present Value (NPV), Internal Rate of Return (IRR), and the payback period—to inform real estate investment decisions is demonstrated by this report's thorough examination of the two properties' investment qualities. Investors can evaluate the profitability and efficiency of their investments with greater accuracy by using these methods, especially in dynamic market contexts where cost structures and future cash flows can be unforeseeable. The ability to compare properties based on their long-term financial outlooks provides a data-driven foundation for choosing optimal investment opportunities.
The essential importance of this research lies in its potential to aid individual and institutional investors in making informed decisions. It enables more precise risk and return assessments for individuals, especially those seeking to balance short-term cash flows with long-term asset appreciation. These insights can support portfolio optimisation for institutional investors, such as real estate funds or property management firms, by allowing a deeper understanding of how different properties perform under varying financial scenarios.
Furthermore, the methodologies employed in this report, such as NPV, IRR, and payback period analyses, can be adapted to other types of investments beyond real estate, including corporate projects, infrastructure investments, or financial securities. The research emphasises the need to use a combination of financial metrics to capture the multidimensional nature of investments, balancing gross returns with efficiency and capital outlay.
Future applications could improve the decision-making process even more by incorporating additional metrics like Return on Investment (ROI) and risk evaluations via scenario or sensitivity analysis. As global real estate markets continue to evolve, the methodologies and findings from this research offer a versatile framework for evaluating investment opportunities in an increasingly complex and competitive environment.
References
[1]. Busch, T., Bruce-Clark, P., Derwall, J., Eccles, R., Hebb, T., Hoepner, A., ... & Weber, O. (2021). Impact investments: A call for (re)orientation. SN Business & Economics, 1, 1-13.
[2]. Huang, J., Tong, J., Wang, P., & Zheng, X. (2022, March). Application and comparison of NPV and IRR methods in the company investment decision. In 2022 7th International Conference on Financial Innovation and Economic Development (ICFIED 2022) (pp. 71-78). Atlantis Press.
[3]. Liu, Q. (2022, March). Sensitivity analysis and investment decision making under uncertainty based on NPV method. In 2022 7th International Conference on Financial Innovation and Economic Development (ICFIED 2022) (pp. 1861-1865). Atlantis Press.
[4]. Dai, H., Li, N., Wang, Y., & Zhao, X. (2022, March). The analysis of three main investment criteria: NPV, IRR, and payback period. In 2022 7th International Conference on Financial Innovation and Economic Development (ICFIED 2022) (pp. 185-189). Atlantis Press.
[5]. Asadujjaman, M., Rahman, H. F., Chakrabortty, R. K., & Ryan, M. J. (2021). An immune genetic algorithm for solving NPV-based resource-constrained project scheduling problem. IEEE Access, 9, 26177-26195.
[6]. Hašková, S., & Fiala, P. (2023). Internal rate of return estimation of subsidised projects: Conventional approach versus fuzzy approach. Computational Economics, 62(3), 1233-1249.
[7]. Sargsyan, L. (2020). Assessing economic internal rate of return of education (Unpublished Master’s Thesis). Manoogian Simone College, Yerevan, 238.
[8]. Fetner, H., & Miller, S. A. (2021). Environmental payback periods of reusable alternatives to single-use plastic kitchenware products. The International Journal of Life Cycle Assessment, 26, 1521-1537.
[9]. Imteaz, M. A., Bayatvarkeshi, M., & Karim, M. R. (2021). Developing generalised equation for the calculation of payback period for rainwater harvesting systems. Sustainability, 13(8), 4266.
[10]. Nguyen, N., Almarri, K., & Boussabaine, H. (2021). A risk-adjusted decoupled-net-present-value model to determine the optimal concession period of BOT projects. Built Environment Project and Asset Management, 11(1), 4-21.
Cite this article
Liang,H. (2025). Applying Three Financial Analysis Methods in Investment: A Comparative Case Study. Advances in Economics, Management and Political Sciences,145,14-20.
Data availability
The datasets used and/or analyzed during the current study will be available from the authors upon reasonable request.
Disclaimer/Publisher's Note
The statements, opinions and data contained in all publications are solely those of the individual author(s) and contributor(s) and not of EWA Publishing and/or the editor(s). EWA Publishing and/or the editor(s) disclaim responsibility for any injury to people or property resulting from any ideas, methods, instructions or products referred to in the content.
About volume
Volume title: Proceedings of ICFTBA 2024 Workshop: Human Capital Management in a Post-Covid World: Emerging Trends and Workplace Strategies
© 2024 by the author(s). Licensee EWA Publishing, Oxford, UK. This article is an open access article distributed under the terms and
conditions of the Creative Commons Attribution (CC BY) license. Authors who
publish this series agree to the following terms:
1. Authors retain copyright and grant the series right of first publication with the work simultaneously licensed under a Creative Commons
Attribution License that allows others to share the work with an acknowledgment of the work's authorship and initial publication in this
series.
2. Authors are able to enter into separate, additional contractual arrangements for the non-exclusive distribution of the series's published
version of the work (e.g., post it to an institutional repository or publish it in a book), with an acknowledgment of its initial
publication in this series.
3. Authors are permitted and encouraged to post their work online (e.g., in institutional repositories or on their website) prior to and
during the submission process, as it can lead to productive exchanges, as well as earlier and greater citation of published work (See
Open access policy for details).
References
[1]. Busch, T., Bruce-Clark, P., Derwall, J., Eccles, R., Hebb, T., Hoepner, A., ... & Weber, O. (2021). Impact investments: A call for (re)orientation. SN Business & Economics, 1, 1-13.
[2]. Huang, J., Tong, J., Wang, P., & Zheng, X. (2022, March). Application and comparison of NPV and IRR methods in the company investment decision. In 2022 7th International Conference on Financial Innovation and Economic Development (ICFIED 2022) (pp. 71-78). Atlantis Press.
[3]. Liu, Q. (2022, March). Sensitivity analysis and investment decision making under uncertainty based on NPV method. In 2022 7th International Conference on Financial Innovation and Economic Development (ICFIED 2022) (pp. 1861-1865). Atlantis Press.
[4]. Dai, H., Li, N., Wang, Y., & Zhao, X. (2022, March). The analysis of three main investment criteria: NPV, IRR, and payback period. In 2022 7th International Conference on Financial Innovation and Economic Development (ICFIED 2022) (pp. 185-189). Atlantis Press.
[5]. Asadujjaman, M., Rahman, H. F., Chakrabortty, R. K., & Ryan, M. J. (2021). An immune genetic algorithm for solving NPV-based resource-constrained project scheduling problem. IEEE Access, 9, 26177-26195.
[6]. Hašková, S., & Fiala, P. (2023). Internal rate of return estimation of subsidised projects: Conventional approach versus fuzzy approach. Computational Economics, 62(3), 1233-1249.
[7]. Sargsyan, L. (2020). Assessing economic internal rate of return of education (Unpublished Master’s Thesis). Manoogian Simone College, Yerevan, 238.
[8]. Fetner, H., & Miller, S. A. (2021). Environmental payback periods of reusable alternatives to single-use plastic kitchenware products. The International Journal of Life Cycle Assessment, 26, 1521-1537.
[9]. Imteaz, M. A., Bayatvarkeshi, M., & Karim, M. R. (2021). Developing generalised equation for the calculation of payback period for rainwater harvesting systems. Sustainability, 13(8), 4266.
[10]. Nguyen, N., Almarri, K., & Boussabaine, H. (2021). A risk-adjusted decoupled-net-present-value model to determine the optimal concession period of BOT projects. Built Environment Project and Asset Management, 11(1), 4-21.