


1. Introduction
The semiconductor industry is a cornerstone of modern technology, encompassing the design, manufacturing, and distribution of semiconductor components that power a wide range of electronic devices, from smartphones and computers to autonomous vehicles and IoT devices. The global semiconductor market is expansive, with a total value projected to reach over $600 billion by 2024. With a compound annual growth rate (CAGR) of approximately 6-8%, the sector shows significant potential, fueled by increasing demand for high-performance computing, AI, and 5G technologies(Encyclopedia, 2024). The semiconductor industry supply chain is complex, involving design, fabrication, assembly, and distribution stages, with key players such as Qualcomm, Intel, AMD, and Nvidia competing in various segments [1].
A particularly transformative factor for the semiconductor industry is artificial intelligence (AI). AI technologies, especially in machine learning and neural network processing, have created unprecedented demand for high-performance semiconductor chips [2]. Nvidia, a leading semiconductor company known for its GPUs, exemplifies how AI has redefined the semiconductor landscape. Nvidia’s success in the AI domain, particularly with its GPU-based AI accelerators, demonstrates the significant impact AI can have on semiconductor sales and technological development. AI-driven data centres and autonomous systems have spurred Nvidia’s growth, positioning it as a leader in the next generation of computing and driving innovation in semiconductor design. This AI-fueled growth is a primary driver behind this research’s focus on semiconductor companies as AI technologies continue to reshape the market.
Qualcomm, a significant player in the semiconductor industry, is currently exploring a major acquisition of Intel’s business units, a move that could reshape its competitive position. Qualcomm’s interest in expanding its portfolio through this acquisition aligns with its diversification strategy beyond mobile chips, particularly in AI, IoT, and automotive technologies. The potential merger underscores the urgency of analyzing Qualcomm’s strategic direction in light of its ambition to strengthen its position in an AI-driven semiconductor market. This study explores Qualcomm’s current standing and growth prospects, particularly as it navigates this competitive and rapidly evolving landscape [3].
This research analyzes Qualcomm Incorporated (QCOM), highlighting its competitive positioning, financial performance, and growth prospects. This research also compares Qualcomm to key competitors: Advanced Micro Devices Inc. (AMD), Broadcom Inc. (AVGO), and Intel Corporation (INTC). Qualcomm’s leadership in the semiconductor and telecommunications equipment industry, particularly in 5G technology, is the focus of this research. Qualcomm is a leader in the semiconductor space, particularly in mobile and wireless technologies. Its primary competitors, AMD, Broadcom, and Intel, each have their areas of strength.
2. Company Overview
This section will introduce the companies selected for this analysis.
2.1. Qualcomm
Qualcomm’s competitive advantage lies in its leadership in 5G technology, strategic licensing agreements with a strong patent portfolio, and extensive relationships with major smartphone manufacturers. Its ability to leverage these strengths in the rapidly growing 5G market sets it apart from its competitors. Its main products are semiconductors and wireless telecommunication products. Qualcomm’s products and services are not limited to smartphones; they also extend to wearable devices, mobile computing, XR, automotive, Internet of Things, smart home, smart city, and other fields. Qualcomm is a semiconductor and telecommunications equipment company. Their products and businesses are revolutionizing medicine, automotive, Internet of Things, smart home, smart city and many other fields. Especially in 5G technology, Qualcomm is an important driving force for 5G research and development and large-scale commercial use, and its technical solutions have competitive advantages in smartphones, Internet of Things devices and automotive electronics.
2.2. AMD
AMD competes aggressively in the CPU and GPU markets, challenging Intel’s dominance with its Ryzen and EPYC processors. AMD focuses on high-performance computing and gaming, where it has seen significant growth. Its main products are manufacturing semiconductor devices used in computer processing. Advanced Micro Devices (AMD) is a leading semiconductor company in the industry. They primarily specialize in developing and manufacturing microprocessors, graphics processors, and related technologies. AMD’s products are widely utilized in personal computers, servers, game consoles, and embedded systems. Their product line includes the Ryzen family of CPUs, the Radeon family of GPUs, and the EPYC family of processors designed for data centres. AMD is recognized as a frontrunner in both the CPU and GPU markets. They are expanding their presence in the data centre and enterprise markets through steadfast technological innovation and product iteration.
2.3. Broadcom
Broadcom has diversified its operations beyond semiconductors into infrastructure software solutions. It focuses on networking, data storage, and broadband technology, which complements its hardware offerings. Its main products are networking devices, optical technologies, network interface controllers and data storage. Broadcom is in the semiconductor and infrastructure software solutions industry. Broadcom’s products include network switches, routers, broadband communications equipment, wireless communications chips and storage devices. The company’s products are widely used in data centres, enterprise and home networks, mobile devices, automotive electronics, and industrial applications. Broadcom has a strong market position in communications and networking equipment and is expanding its presence in the software-defined networking and cloud computing markets through continuous technological innovation and strategic acquisitions such as VMware.
2.4. Intel
Intel, one of the world’s largest semiconductor companies, is best known for its broad range of processors at the heart of personal computers, servers, mobile devices and Internet infrastructure. Intel’s product line covers the Core, Xeon and Atom family of processors, FPgas, ASICs, Optane storage solutions and networking devices. Intel has a deep business presence in client computing, data centres, Internet of Things, autonomous driving and network solutions. Intel’s technologies and services are used in various verticals, including retail, industrial, transportation, finance, healthcare, energy and education. Intel remains a giant in the semiconductor industry, with a broad portfolio that includes processors, memory, and advanced technologies for AI and autonomous vehicles. However, it faces challenges transitioning to newer manufacturing processes and maintaining market share. Its main products are processors and microprocessors. Intel is in the semiconductors industry, computer hardware, autonomous cars, and artificial intelligence automation.
3. Methodology
3.1. P/E Ratio
The P/E ratio compares a company’s stock price to its earnings per share (EPS), serving as a measure of market valuation [4]. There are two common variations: TTM P/E, which uses earnings over the trailing twelve months, and NTM P/E, which projects earnings for the next twelve months [5]. The P/E ratio helps assess how much investors are willing to pay for future earnings. A higher P/E ratio usually reflects greater growth expectations, while a lower ratio may indicate that the stock is undervalued [6].
3.2. Profit Margin
Profit margin provides insight into a company’s ability to turn revenue into profit after covering all expenses [7]. This can be broken down into three important types. Gross margin reflects the percentage of revenue remaining after deducting the cost of goods sold (COGS), highlighting production efficiency. It is calculated as (Revenue - COGS) / Revenue. EBIT margin measures how well a company manages its operations by comparing earnings before interest and taxes (EBIT) to total revenue, which demonstrates operational efficiency. Finally, net profit margin indicates the percentage of revenue that turns into net profit after all expenses, taxes, and interest are accounted for, offering a comprehensive view of overall profitability [8]. It is calculated as net profit divided by total revenue.
3.3. Return on Equity
ROE measures how efficiently a company generates profit from shareholders' equity, serving as a key indicator of financial performance [9]. It is calculated by dividing net profit by shareholder's equity. A higher ROE signifies that a company is more effective at converting shareholder capital into profits, making it an essential metric for evaluating the profitability and efficiency of equity use [10].
4. Analysis
4.1. P/E Ratio
Qualcomm’s valuation metrics suggest that the market is undervaluing its growth potential, particularly considering its leading position in the 5G industry. With a TTM P/E ratio of 21.92 and a forward P/E of 20.26, Qualcomm appears reasonably priced relative to its future earnings, especially compared to competitors like AMD, which have higher P/E ratios reflecting both elevated growth expectations and greater risk. (Table 1)
Table 1: P/E ratios of Qualcomm and its comparable firms
Qualcomm | AMD | Broadcom | Intel | |
TTM P/E | 21.92 | 71.19 | 44.58 | 118.11 |
NTM P/E | 20.26 | 41.93 | 37.08 | (155.23) |
4.2. Profit Margin
Qualcomm’s gross margin has seen a slight decline from 60.7% in 2020 to 55.7% in 2023, reflecting some market pressures, but it remains competitive, especially compared to AMD’s more stable but lower margin of around 46% and Intel’s declining margin, which fell to 40% in 2023. Broadcom consistently outperforms, with a gross margin increasing to 68.9% in 2023. Qualcomm’s quarterly trends show resilience, with its gross margin improving slightly from 55.05% in July 2023 to 56.60% in October 2023. Regarding EBIT margin, Qualcomm holds strong at 24.15%, significantly outperforming AMD’s 1.8% and Intel’s 0.1%, though it lags behind Broadcom’s 45.9%. This stability in EBIT margin underscores Qualcomm’s effective cost management and operational efficiency, positioning it as a strong industry performer despite minor gross margin fluctuations.
Table 2: Profit margin of Qualcomm and its comparable firms
Qualcomm | AMD | Broadcom | Intel | |
Gross profit margin | 55.7% | 46.1% | 68.9% | 40.0% |
EBIT margin | 24.15% | 1.77% | 45.9% | 0.17% |
Net Profit Margin | 20.2% | 3.8% | 39.3% | 3.1% |
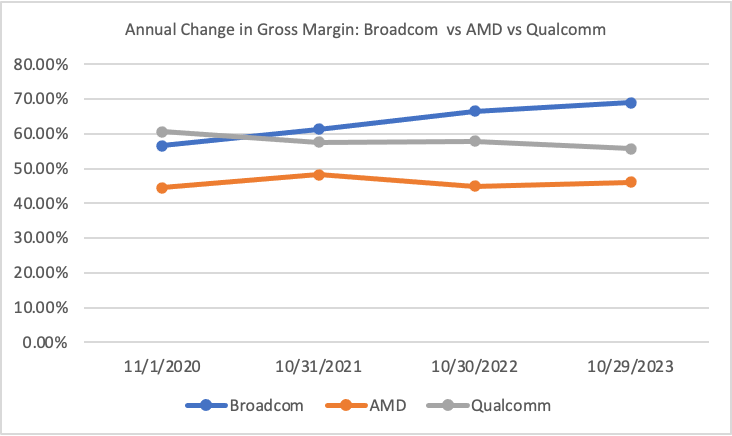
Figure 1: Annual changes in gross margin
(Picture credit: Original)
4.3. Return on Equity
Regarding ROE (Return on Equity), Qualcomm’s performance highlights its strong operational efficiency and profitability. Qualcomm achieves an ROE of 33.51%, significantly higher than AMD’s 1.53% and Intel’s 1.60%, though Broadcom leads with an impressive 58.7%. This indicates that Qualcomm is highly effective at generating profit from shareholders’ equity, reinforcing its position as a financially robust company. Combined with its solid gross and EBIT margins, Qualcomm’s strong ROE underscores its overall superior performance in the industry, showcasing its ability to efficiently convert equity into profit compared to most of its peers.
Table 3: ROE of Qualcomm and its comparable firms
Qualcomm | AMD | Broadcom | Intel | |
ROE | 33.51% | 1.53% | 58.7% | 1.60% |
4.4. Fundamental analysis
Qualcomm is well-positioned for growth, driven by three key factors. First, the increasing demand for AI-powered smartphone features is pushing Chinese brands to launch more high-end models, leading to a rise in the average selling price (ASP) of Qualcomm’s mobile chips. Second, the growing penetration of electric vehicles (EVs), particularly in smart cockpits and autonomous driving, is expected to significantly boost Qualcomm’s automotive revenue, projected to reach $4 billion by fiscal year 2026. Third, the launch of AI-enabled PCs using Qualcomm’s chips is set to provide a new revenue stream in the coming years. Given these strong growth drivers and its current attractive valuation with a P/E ratio of 21x, Qualcomm should be given a “Buy” rating.
5. Risk Analysis
Although the previous financial analysis concluded that Qualcomm is a recommended investment, certain risks are still associated with investing in the company. Below are some of the key risks Qualcomm are facing.
5.1. Return on Equity
Qualcomm relies heavily on key customers like Apple and Huawei, making its performance vulnerable to changes in their demand. If either company reduces orders or switches to alternative suppliers, it could significantly impact Qualcomm’s revenue. The dependence on a few major clients increases the risk of revenue fluctuations tied to individual customer decisions.
5.2. Return on Equity
The semiconductor industry is highly cyclical, with fluctuating demand based on the overall economic climate. During economic downturns, consumer demand weakens, reducing orders from downstream industries such as smartphones and other electronic devices. This cyclicality exposes Qualcomm to revenue volatility during periods of economic contraction.
5.3. Return on Equity
Qualcomm has significant exposure to the Chinese market, and any deterioration in U.S.-China relations could negatively affect its business. Trade restrictions, sanctions, or heightened tensions between the two countries could limit Qualcomm’s access to Chinese customers or lead to retaliatory actions, impacting revenue and market share in one of its largest markets.
6. Conclusion
In conclusion, this study critically examines Qualcomm’s competitive positioning within the semiconductor and telecommunications industries, focusing on its strengths in 5G technology, patent portfolio, and strategic partnerships. By employing key financial metrics such as ROE, profit margin, and P/E ratio, this research highlights Qualcomm’s strong operational efficiency and ability to maintain profitability compared to major competitors like AMD, Broadcom, and Intel. The analysis also underscores Qualcomm’s promising growth prospects in AI-powered devices, electric vehicles, and the Internet of Things, which are driven by the increasing demand for advanced technologies. Meanwhile, the research also identifies key risks, including Qualcomm’s dependence on major clients like Apple and Huawei, its vulnerability to the cyclical nature of the semiconductor industry, and its exposure to geopolitical tensions, particularly between the U.S. and China. Despite these challenges, the study concludes that Qualcomm’s leadership in 5G technology and its robust financial performance make it well-positioned for future growth while emphasizing the need to manage the identified risks effectively
References
[1]. Investopedia. (2024). Semiconductors: What is the supply chain? Why is it important? Investopedia.
[2]. Abbasi, I. (2023). The positive relationship between AI and the semiconductor industry. AZO Materials.
[3]. Wall Street Journal (WSJ). (2024). TNB Tech Minute: Qualcomm approaches Intel with takeover bid. Wall Street Journal.
[4]. Saputra, F. (2022). Analysis effect return on assets (ROA), return on equity (ROE), and price earning ratio (PER) on stock prices of coal companies in the Indonesia Stock Exchange (IDX) period 2018-2021. Dinasti International Journal of Economics, Finance & Accounting, 3(1), 82-94.
[5]. Liu, L. (2024). Analysis of enterprise value investment strategy. Highlights in Business, Economics and Management, 40, 537-541.
[6]. Mao, R. (2023). Verify the relationship between a company’s earning per share, return on equity, return on assets, sales growth, price to earning ratio, current ratio, gross profit margin, quick ratio, asset turnover and its stock price. In SHS Web of Conferences (Vol. 163, p. 03003). EDP Sciences.
[7]. Ramadhon, F. E. (2023). Pengaruh gross profit margin, net profit margin dan current ratio terhadap profitabilitas. Equivalent: Journal of Economic, Accounting and Management, 1(1), 22-29.
[8]. Islam, H., Rahman, J., Tanchangya, T., & Islam, M. A. (2023). Impact of firms’ size, leverage, and net profit margin on firms’ profitability in the manufacturing sector of Bangladesh: An empirical analysis using GMM estimation. Journal of Ekonomi, 5(1), 1-9.
[9]. Heikal, M., Khaddafi, M., & Ummah, A. (2014). Influence analysis of return on assets (ROA), return on equity (ROE), net profit margin (NPM), debt to equity ratio (DER), and current ratio (CR) against corporate profit growth in automotive in Indonesia Stock Exchange. International Journal of Academic Research in Business and Social Sciences, 4(12), 101.
[10]. Ahsan, A. M. (2012). Can ROE be used to predict portfolio performance? Economics, Management, and Financial Markets, 7(2), 132-148.
Cite this article
Zhang,X. (2025). Decoding Qualcomm's Equity: A 5G Investment Outlook. Advances in Economics, Management and Political Sciences,145,147-153.
Data availability
The datasets used and/or analyzed during the current study will be available from the authors upon reasonable request.
Disclaimer/Publisher's Note
The statements, opinions and data contained in all publications are solely those of the individual author(s) and contributor(s) and not of EWA Publishing and/or the editor(s). EWA Publishing and/or the editor(s) disclaim responsibility for any injury to people or property resulting from any ideas, methods, instructions or products referred to in the content.
About volume
Volume title: Proceedings of ICFTBA 2024 Workshop: Human Capital Management in a Post-Covid World: Emerging Trends and Workplace Strategies
© 2024 by the author(s). Licensee EWA Publishing, Oxford, UK. This article is an open access article distributed under the terms and
conditions of the Creative Commons Attribution (CC BY) license. Authors who
publish this series agree to the following terms:
1. Authors retain copyright and grant the series right of first publication with the work simultaneously licensed under a Creative Commons
Attribution License that allows others to share the work with an acknowledgment of the work's authorship and initial publication in this
series.
2. Authors are able to enter into separate, additional contractual arrangements for the non-exclusive distribution of the series's published
version of the work (e.g., post it to an institutional repository or publish it in a book), with an acknowledgment of its initial
publication in this series.
3. Authors are permitted and encouraged to post their work online (e.g., in institutional repositories or on their website) prior to and
during the submission process, as it can lead to productive exchanges, as well as earlier and greater citation of published work (See
Open access policy for details).
References
[1]. Investopedia. (2024). Semiconductors: What is the supply chain? Why is it important? Investopedia.
[2]. Abbasi, I. (2023). The positive relationship between AI and the semiconductor industry. AZO Materials.
[3]. Wall Street Journal (WSJ). (2024). TNB Tech Minute: Qualcomm approaches Intel with takeover bid. Wall Street Journal.
[4]. Saputra, F. (2022). Analysis effect return on assets (ROA), return on equity (ROE), and price earning ratio (PER) on stock prices of coal companies in the Indonesia Stock Exchange (IDX) period 2018-2021. Dinasti International Journal of Economics, Finance & Accounting, 3(1), 82-94.
[5]. Liu, L. (2024). Analysis of enterprise value investment strategy. Highlights in Business, Economics and Management, 40, 537-541.
[6]. Mao, R. (2023). Verify the relationship between a company’s earning per share, return on equity, return on assets, sales growth, price to earning ratio, current ratio, gross profit margin, quick ratio, asset turnover and its stock price. In SHS Web of Conferences (Vol. 163, p. 03003). EDP Sciences.
[7]. Ramadhon, F. E. (2023). Pengaruh gross profit margin, net profit margin dan current ratio terhadap profitabilitas. Equivalent: Journal of Economic, Accounting and Management, 1(1), 22-29.
[8]. Islam, H., Rahman, J., Tanchangya, T., & Islam, M. A. (2023). Impact of firms’ size, leverage, and net profit margin on firms’ profitability in the manufacturing sector of Bangladesh: An empirical analysis using GMM estimation. Journal of Ekonomi, 5(1), 1-9.
[9]. Heikal, M., Khaddafi, M., & Ummah, A. (2014). Influence analysis of return on assets (ROA), return on equity (ROE), net profit margin (NPM), debt to equity ratio (DER), and current ratio (CR) against corporate profit growth in automotive in Indonesia Stock Exchange. International Journal of Academic Research in Business and Social Sciences, 4(12), 101.
[10]. Ahsan, A. M. (2012). Can ROE be used to predict portfolio performance? Economics, Management, and Financial Markets, 7(2), 132-148.