


1. Introduction
Car prices have long been a highly valued concern for the general population, as they are an integral element of their lives. Numerous automakers have increased their research and development and introduced new energy vehicles (NEV) to protect the environment. The demand and supply of NEVs have been greatly impacted by the COVID-19 epidemic, the situation in Russia and Ukraine, and stretched global supply chains, which have caused sharp fluctuations in the price of conventional energy and raw materials. As an important tool to fight global warming, NEV prices have a great impact on its promoting and environment protection, and international economy requires predictable and relatively stable NEV prices [1, 2]. Given the significance of NEVs in promoting environmentally friendly transportation and cutting carbon emissions, it is critical to fully comprehend and analyze variables affecting their pricing, and it has been a focus of research in many countries.
Numerous factors, such as market dynamics, governmental regulations, technical developments, and shifts in the price of raw materials, have an impact on NEV prices. Jiang asserts that the pricing of NEVs and consumer demand are significantly influenced by government incentives and subsidies [3]. According to Shi, NEV production costs and final pricing are directly impacted by changes in the price of vital raw materials used in batteries [4]. Zhang showed that long-term price trends are also influenced by technological advancements and enhancements in manufacturing techniques [5]. Furthermore, NEV market dynamics are being influenced by environmental policies and government regulations more and more [6].
Many scholars have investigated different NEV price prediction models. Song employed GA-BP model (Genetic Algorithm-Back Propagation Neural Network) to evaluate the price of second-hand electric vehicles [7]. Santos constructed an optimized sale price model to analyze the impact of solar and wind energy installations at electric vehicle charging stations in a region in Brazil on pricing [8]. Peng analyzed price-dependent decision considering subsidies and backorders based on the newsvendor model to provide the suggestions for the stakeholders [9]. Additionally, Sun used GSRNN model to grasp the development trend of the upper, middle and downstream industries of NEVs and predict NEV industry chain stock price [10].
Hybrid models have also been studied recently to handle price volatility. For instance, the two-layer model based on generalized linear model and XGBoost algorithm was used by Zhang to estimate NEV insurance rate and he discovered that two-layer prediction model has good performance in including various variables such as battery type and drive mode [11]. Liu et al. integrated multi-source data and introduced an LSTM-GRU-SA-AM model to predict stock price of NEV companies and mentioned its influence on NEV price [12]. The model comprises Long Short-Term Memory (LSTM), Gated Recurrent Unit (GRU), Self-Attention (SA), and the hybrid attention structure SA-AM.
In conclusion, a large body of diverse research has been done on NEV price drivers. In order to forecast and assess NEV prices, this paper will use the multiple linear regression. Based on the predicted results, investors will receive actionable insights and suggestions. Through an analysis of the several factors affecting NEV prices, this research hopes to provide important information to market players and policymakers.
2. Methodology
2.1. Data Source
The dataset used in this paper is taken from the Kaggle website (Cheapest Electric Cars 2023). The original dataset contains data of 309 EV models. The original dataset remained in .csv format.
The original dataset has 7 variables except for the dependent variable, and all these variables may have an impact on dependent variable. There are some cars whose Fast Charge Speed is missing. Some cars only have PriceinGermany or PriceUK, and the two countries have different units of currency. This research eliminated EV models that has missing Fast Charge Speed and chose to use PriceinGermany as the EV price, which is the dependent variable. Eventually, the research is based on the remaining 278 observations. The data contains 7 variables (Battery, Acceleration, TopSpeed, Range, Efficiency, FastChargeSpeed, NumberofSeats) and one dependent variable (PriceinGermany). Table 1 provides the following detailed description of this dataset:
Table 1: List of Variables
Variable | Logogram | Meaning |
Battery | \( {x_{1}} \) | The battery capacity in kWh |
Acceleration | \( {x_{2}} \) | The seconds it takes to accelerate from 0km/h to 100km/h |
TopSpeed | \( {x_{3}} \) | The fastest speed the car can reach in km/h |
Range | \( {x_{4}} \) | The longest distance the car can travel in km |
Efficiency | \( {x_{5}} \) | The electricity consumption per kilometer (Wh/km) |
FastChargeSpeed | \( {x_{6}} \) | The distance the car can travel after 1h charging (km/h) |
NumberofSeats | \( {x_{7}} \) | The number of seats in the car |
PriceinGermany | Y | The price the car sells in Germany |
2.2. Method Introduction
The research employs a linear regression model with multiple variables to compare the condition with and without incorporating the interaction terms. The comparison of the two models' relevance and the precision of the findings will be the primary goals of this section. In due course, it will facilitate the most efficient handling of models.
A linear regression model containing various explanatory variables is called a multiple linear regression model. It serves as an explanation for the linear relationship that exists between the variable being explained and several additional explanatory factors. Furthermore, the fundamental idea behind it is to use ordinary least squares (OLS) to estimate a set of parameters in a way that minimizes the sum of squares of the residuals between the independent and dependent variables. Multiple linear regression uses the following general mathematical model:
\( E(Y)={{β_{0}}+β_{1}}{x_{1}}+{β_{2}}{x_{2}}+…+{β_{7}}{x_{7}}+ε \) (1)
3. Results and Discussion
3.1. Multiple Linear Regression
The investigation in this paper demonstrates that there are various factors impacting EV price. As the graph shows:
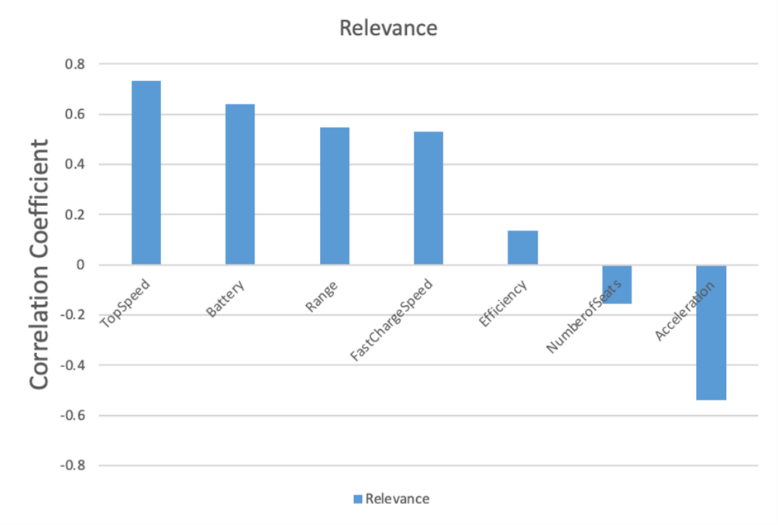
Figure 1: Relevance Analysis Between Dependent and Explanatory Variables
The coefficient of Pearson correlation between these variables and EV pricing is shown in Figure 1. According to the research data, the variables that most positively associate with EV pricing are, in order, the maximum speed, battery capacity, longest distance the car can travel, and rapid charging speed. Maybe when choosing the cheapest hundreds of EV models, the power and battery capacity of the car are the main concerns nowadays. Of course, electricity consumption per kilometer is also a positive correlation factor, but it is not as significant as the factors above. The seconds it takes to accelerate from 0 to 100km/h correlates significantly negatively with the price, which means that the acceleration power is also what people pay attention to. From what is mentioned above, the factors that may affect the EV prices are comprehensive. People may have different needs when choosing EV cars, and they may want to perfect their vehicles from various perspectives. Multiple regression analysis was carried out following the examination of the individual factors' Pearson correlation matrix.
Table 2: Regression Coefficient Table
Variables | \( {β_{i}} \) | Standard Error | T value | P value | VIF |
Constant | -179114.7 | 32476.13 | -5.52 | 0.000 | |
\( {x_{1}} \) | 200.1967 | 510.0762 | 0.39 | 0.695 | 49.43 |
\( {x_{2}} \) | 2423.109 | 1152.294 | 2.10 | 0.036 | 5.81 |
\( {x_{3}} \) | 876.0833 | 93.2944 | 9.39 | 0.000 | 6.02 |
\( {x_{4}} \) | 42.77268 | 100.6382 | 0.43 | 0.671 | 53.46 |
\( {x_{5}} \) | 467.9757 | 182.2172 | 2.57 | 0.011 | 15.99 |
\( {x_{6}} \) | -17.82084 | 10.82567 | -1.65 | 0.101 | 3.19 |
\( {x_{7}} \) | -7623.988 | 2826.671 | -2.70 | 0.007 | 3.26 |
The regression coefficients for the multiple linear regression equation model are displayed in Table 2. For the four independent variables ( \( {x_{2}}, \) \( {x_{3}}, \) \( {x_{5}}, \) \( {x_{7}} \) ), the T-test p-values were all less than 0.05. Consequently, it may be said that the dependent variable is significantly impacted by each of the seven independent factors. The following multiple linear regression equation may be derived from the given data:
\( E(Y)=-179114.7+200.1967{x_{1}}+2423.109{x_{2}}+…-7623.988{x_{7}} \) (2)
This model formulation yields the multivariate correlation coefficient R of 0.801, the adjusted R-squared of 0.631, and the coefficient R-squared for fitting multiple linear regression of 0.642. The model fits the user well.
The data in Figure 2's normal distribution P-P roughly resembles a diagonal straight line, showing that the data demonstrates normality and that its cumulative percentage is essentially compatible with that of the normal distribution.
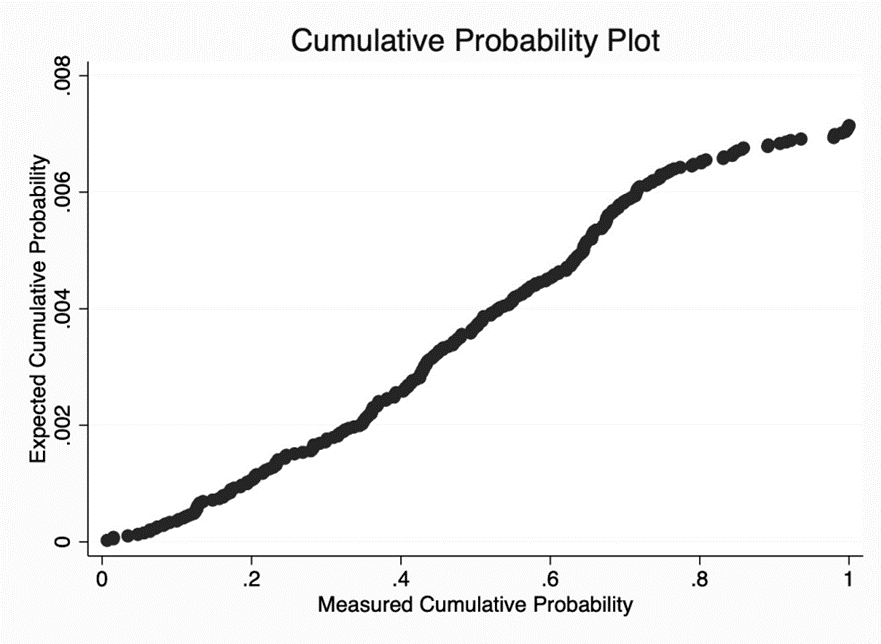
Figure 2: Normalized P-P plots of regression standardized residuals
3.2. Linear Regression with Interaction Terms
NEV pricing may also be impacted by interactions between certain independent factors; these terms having interactive effects are referred to as interaction terms. Indeed, there is likely a relationship between the car's range and battery capacity, and there may be some relationship between charging efficiency and fast charge speed. Multiplying the interaction terms and adding the coefficients to the equation provides the solution:
\( Y={{β_{0}}+β_{1}}{x_{1}}+{β_{2}}{x_{2}}+…+{β_{7}}{x_{7}}+{β_{8}}{x_{1}}{x_{4}}+{β_{9}}{x_{5}}{x_{6}}+ε \) (3)
\( {β_{i}} \) (i=1,2,3,…,9) is regression coefficient, \( {x_{1}}{x_{4}} \) and \( {x_{5}}{x_{6}} \) are interaction terms. When the magnitude of these three factors is greater, it is projected that higher NEV pricing will result from larger battery capacity, if the interaction term regression coefficients are considerably positive. The original regression coefficients of the independent variables lose some of their significance with the introduction of the interaction factor.
Table 3 below displays the findings of the multiple linear regression model analysis with interaction terms:
Table 3: Multiple Linear Regression Model analysis results with interaction terms
Variables | \( {β_{i}} \) | T Value | P Value | VIF | Tolerance |
Constant | 112317.9 | 2.67 | 0.008 | ||
\( {x_{1}} \) | -3178.926 | -4.63 | 0.000 | 121.59 | 0.008224 |
\( {x_{2}} \) | -5.210988 | -0.00 | 0.996 | 6.50 | 0.153768 |
\( {x_{3}} \) | -849.5038 | -4.33 | 0.000 | 36.07 | 0.027726 |
\( {x_{4}} \) | 35.10565 | 0.26 | 0.792 | 126.48 | 0.007906 |
\( {x_{5}} \) | 568.8627 | 3.63 | 0.000 | 16.06 | 0.062273 |
\( {x_{6}} \) | 21.06578 | 0.29 | 0.769 | 190.46 | 0.005250 |
\( {x_{7}} \) | -8789.437 | -3.61 | 0.000 | 3.28 | 0.305061 |
\( {x_{1}}{x_{4}} \) | 19.3991 | 9.55 | 0.000 | 93.57 | 0.010687 |
\( {x_{5}}{x_{6}} \) | -.1242452 | -0.33 | 0.740 | 178.33 | 0.005608 |
Many variables have poor correlation coefficients and VIF values more than 5, indicating that the inclusion of interaction terms causes serious covariance issues. Forward Stepwise Regression is utilized to tackle this issue. The following table (Table 4) shows the results of the regression analysis for the independent and dependent variables:
Table 4: Results of Forward Stepwise Regression
Variables | \( {β_{i}} \) | Coefficient | T Value | P Value | VIF | Tolerance |
Constant | 129011.7 | 4.45 | 0.000 | |||
\( {x_{1}} \) | -2996.255 | 0.6390 | -9.16 | 0.000 | 27.89 | 0.035853 |
\( {x_{3}} \) | -844.9198 | 0.7309 | -5.33 | 0.000 | 23.90 | 0.041842 |
\( {x_{5}} \) | 460.7555 | 0.1353 | 7.66 | 0.000 | 2.39 | 0.418132 |
\( {x_{7}} \) | -8082.943 | -0.1553 | -3.55 | 0.000 | 2.90 | 0.344599 |
\( {x_{1}}{x_{4}} \) | 19.26498 | 0.7767 | 10.42 | 0.000 | 78.47 | 0.012744 |
The adjusted R2 of the model is 0.7393, which is relatively great. The model is demonstrated to be valid according to the F-test results (F=158.67, P=0.000<0.05). Then the model formula is:
\( Y=129011.7-2996.255{x_{1}}-844.9198{x_{3}}+460.7555{x_{5}}-8082.943{x_{7}}+19.26498{x_{1}}{x_{4}} \) (4)
4. Conclusion
279 samples of cheapest NEVs in Germany in 2023 from the data set with 8 variables were included in the study. Multiple linear regression analysis is a thorough, accurate, and efficient procedure. After completing a multiple-factor analysis, the study obtained each variable's Pearson correlation coefficients.
In order to determine whether there may be a relationship between the variables and NEV pricing, the article employs a multiple linear regression model throughout the analysis phase. In order to get more precise results, the study includes interaction terms with coefficients in the equation and accounts for interaction effects. Thus, the battery capacity, maximum speed of the vehicle, electricity consumption per kilometer, and range of the vehicle are the elements that have a favorable impact on the price of NEVs. Prices of NEVs are inversely connected with the number of seats in the vehicle.
People who have a strong desire for NEVs can use the research to gather references from a variety of sources and make an overall budgetary decision regarding the cost of NEVs. There are still some shortcomings, though. For example, the data only includes the least expensive NEVs, there are no discernible causal correlations between the variables, and the sample size is relatively small. Finding potential causal relationships between NEV pricing and factors will require looking for larger datasets and applying the control variable approach in order to make improvements.
References
[1]. Mukesh, N.M. (2023) Predicting consumer purchase intention on electric cars in India: Mediating role of attitude. Business Strategy & Development, 6(4), 942-956.
[2]. Aqib, Z., Yajuan, Y., Saima, B., et al. (2023) The Carbon-Neutral Goal in China for the Electric Vehicle Industry with Solid-State Battery’s Contribution in 2035 to 2045. Journal of Environmental Engineering, 149(12).
[3]. Jiang, Z.S. and Xu, C.H. (2023) Policy incentives, government subsidies, and technological innovation in new energy vehicle enterprises: Evidence from China. Energy Policy, 177.
[4]. Shi, C. (2018) Higher Q1 NEV sales bode well for battery raw material demand. Industrial Minerals.
[5]. Zhang, T., Li, S., Li, Y., et al. (2023) Evaluation of technology innovation efficiency for the listed NEV enterprises in China. Economic Analysis and Policy, 80, 1445-1458.
[6]. Ruxia, L., Cuihua, Z., Zhitang, L., et al. (2023) Impact of regulatory intervention on green technology and innovation investment of the NEV automaker. Computers & Industrial Engineering, 184.
[7]. Song, X.Z. (2024) Research on valuation method of used pure electric vehicles based on GA-BP neural network model. Chongqing university of science and technology.
[8]. Carlos, D.S.P., et al. (2020) Analysis of solar and wind energy installations at electric vehicle charging stations in a region in Brazil and their impact on pricing using an optimized sale price model. International Journal of Energy Research, 45(5), 6745-6764.
[9]. Peng, Z. (2017) Price-dependent decision of new energy vehicles considering subsidies and backorders. Energy Procedia, 105, 2065-2070.
[10]. Sun, X. (2022) Research on stock price prediction of new energy automobile industry chain based on GSRNN model. Suzhou university.
[11]. Zhang, Y.K. (2023) Based on the double prediction model of new energy car insurance rates set research. Hunan university.
[12]. Liu, X., Wu, Y., Luo, M., et al. (2024) Stock price prediction for new energy vehicle companies based on multi-source data and hybrid attention structure. Expert Systems with Applications, 255, 124787.
Cite this article
Lin,J. (2025). Research on Factors Influencing NEV Prices-Take Cheapest Electric Cars in Germany, 2023 as an Example. Advances in Economics, Management and Political Sciences,145,154-159.
Data availability
The datasets used and/or analyzed during the current study will be available from the authors upon reasonable request.
Disclaimer/Publisher's Note
The statements, opinions and data contained in all publications are solely those of the individual author(s) and contributor(s) and not of EWA Publishing and/or the editor(s). EWA Publishing and/or the editor(s) disclaim responsibility for any injury to people or property resulting from any ideas, methods, instructions or products referred to in the content.
About volume
Volume title: Proceedings of ICFTBA 2024 Workshop: Human Capital Management in a Post-Covid World: Emerging Trends and Workplace Strategies
© 2024 by the author(s). Licensee EWA Publishing, Oxford, UK. This article is an open access article distributed under the terms and
conditions of the Creative Commons Attribution (CC BY) license. Authors who
publish this series agree to the following terms:
1. Authors retain copyright and grant the series right of first publication with the work simultaneously licensed under a Creative Commons
Attribution License that allows others to share the work with an acknowledgment of the work's authorship and initial publication in this
series.
2. Authors are able to enter into separate, additional contractual arrangements for the non-exclusive distribution of the series's published
version of the work (e.g., post it to an institutional repository or publish it in a book), with an acknowledgment of its initial
publication in this series.
3. Authors are permitted and encouraged to post their work online (e.g., in institutional repositories or on their website) prior to and
during the submission process, as it can lead to productive exchanges, as well as earlier and greater citation of published work (See
Open access policy for details).
References
[1]. Mukesh, N.M. (2023) Predicting consumer purchase intention on electric cars in India: Mediating role of attitude. Business Strategy & Development, 6(4), 942-956.
[2]. Aqib, Z., Yajuan, Y., Saima, B., et al. (2023) The Carbon-Neutral Goal in China for the Electric Vehicle Industry with Solid-State Battery’s Contribution in 2035 to 2045. Journal of Environmental Engineering, 149(12).
[3]. Jiang, Z.S. and Xu, C.H. (2023) Policy incentives, government subsidies, and technological innovation in new energy vehicle enterprises: Evidence from China. Energy Policy, 177.
[4]. Shi, C. (2018) Higher Q1 NEV sales bode well for battery raw material demand. Industrial Minerals.
[5]. Zhang, T., Li, S., Li, Y., et al. (2023) Evaluation of technology innovation efficiency for the listed NEV enterprises in China. Economic Analysis and Policy, 80, 1445-1458.
[6]. Ruxia, L., Cuihua, Z., Zhitang, L., et al. (2023) Impact of regulatory intervention on green technology and innovation investment of the NEV automaker. Computers & Industrial Engineering, 184.
[7]. Song, X.Z. (2024) Research on valuation method of used pure electric vehicles based on GA-BP neural network model. Chongqing university of science and technology.
[8]. Carlos, D.S.P., et al. (2020) Analysis of solar and wind energy installations at electric vehicle charging stations in a region in Brazil and their impact on pricing using an optimized sale price model. International Journal of Energy Research, 45(5), 6745-6764.
[9]. Peng, Z. (2017) Price-dependent decision of new energy vehicles considering subsidies and backorders. Energy Procedia, 105, 2065-2070.
[10]. Sun, X. (2022) Research on stock price prediction of new energy automobile industry chain based on GSRNN model. Suzhou university.
[11]. Zhang, Y.K. (2023) Based on the double prediction model of new energy car insurance rates set research. Hunan university.
[12]. Liu, X., Wu, Y., Luo, M., et al. (2024) Stock price prediction for new energy vehicle companies based on multi-source data and hybrid attention structure. Expert Systems with Applications, 255, 124787.