


1. Introduction
Changan Automobile is one of the leading enterprises in China's automobile industry, with multiple independent brands and joint venture brands. Its main business covers almost every segment of the automobile market, including the research and development, manufacturing and sales of complete vehicles, the research and development and production of engines, etc. In recent years, Changan Automobile has made continuous breakthroughs in technological innovation and market expansion, launched a number of new energy vehicle models, and achieved remarkable results in the field of intelligence. At the same time, Changan Automobile is also actively expanding overseas markets, setting up multiple research and development and production bases around the world, and its products are sold all over the world.
The company not only has profound accumulation in the field of traditional fuel vehicles, but also actively deploys in the fields of new energy vehicles and smart vehicles to adapt to the development trend of electrification and intelligence in the automotive industry.
Changan Automobile has a wide market layout. It not only cultivates the domestic market in China, but also actively expands overseas markets. In the domestic market, Changan Automobile has a huge sales network and service system covering major cities and regions. In the overseas market, the company has accelerated its global layout, and its products have entered many countries and regions around the world, especially the Middle East, Africa and Southeast Asia markets.
Changan Automobile's product line covers multiple market segments, mainly including passenger cars, commercial vehicles, electric vehicles, hybrid vehicles, intelligent connected vehicles and auto parts manufacturing. The company has rapidly occupied the market by meeting the needs of different consumers through a multi-level market layout.
As consumer demand for diversified model lineups and electric vehicles continues to grow, Changan Automobile has experienced significant growth in operating income, with average annual vehicle sales reaching 2.25 million vehicles. At the same time, Changan Automobile performed well in terms of export sales, with overseas sales reaching 300,000 vehicles. Overall, Changan's revenue comes from growing domestic sales and foreign exports.
Changan Automobile's profits have fluctuated in recent years. In 2023, Changan Automobile achieved double growth in revenue and net profit. In the first half of 2024, although the company's operating income increased, its profit declined. Despite this, Changan Automobile's profitability is still at a high level in the industry. The company is actively taking measures to optimize its product structure and improve operating efficiency to cope with market changes and competitive pressures.
2. Assumption
With the economic recovery, many new competitors have emerged in the automobile market. As a result, competition among companies for corporate interests has become increasingly fierce. Companies must maintain performance improvement so that their conditions can remain stable and avoid bankruptcy [1]. Changes in the operating environment could also affect the trends in accruals and earnings’ predictive ability. Thus, both accounting and operating factors could differentially affect the temporal variation in cash flow predictability [2]. Due to nothing is more liquid than cash, only cash flow information is able to reflect the liquidity position of the companies [3]. Therefore, this paper analyzes the cash flow of Changan Automobile in terms of revenue, cost of goods sold, R&D expenditure and salaries expenditure to understand the company's operating activities and make assumptions about its cash flow in the next five years.
Basic presupposition:
1. Assuming the company maintains its original production scale.
2. Assuming current car models and projected launch schedules remain unchanged.
3. Assuming the company is in the market where competitors are not exiting and entering.
2.1. Changan Automobile’s Revenue Growth Analysis and Forecast
As can be seen from Figure 1, between 2019 and 2023, Changan Automobile's revenue showed a continuous growth trend, and its growth rate declined.
Firstly, the globalization strategy is developing continuously. The company is strengthening its organizational construction, establishing a Southeast Asian business unit, a European regional headquarters, and establishing regional headquarters in the Americas, Africa and other regions in due course. The expansion of overseas markets will become an indispensable factor in the company's revenue growth. Secondly, the growing consumer demand for electric vehicles will also drive the growth of Changan Automobile's revenue. In addition, Changan Automobile's R&D investment in digitalization and intelligence is also crucial. By promoting the digital transformation of the entire value chain, the construction of intelligent manufacturing, intelligent management and a digital ecosystem, the company will improve operational efficiency and customer service levels, thereby enhancing market competitiveness. It is worth noting that there are many competitors in the electric vehicle market. Changan Automobile's independent brands face fierce competition in some segments, especially in the mid- and low-end markets. Although efforts have been made in this regard to make the sales of independent brands higher than those of peers, profitability is relatively weak, which has affected the company's overall revenue to a certain extent.
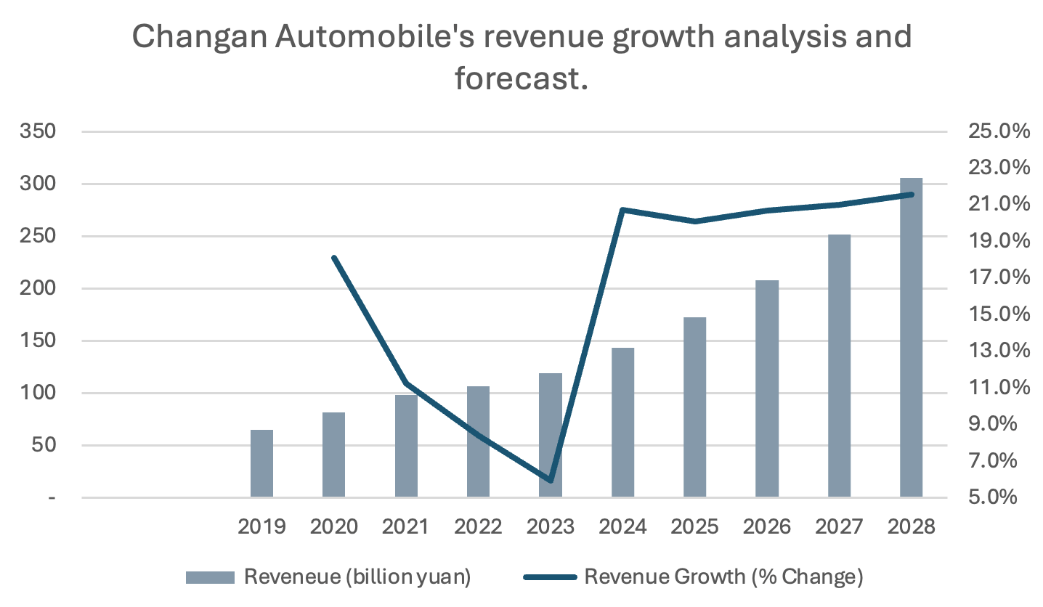
Figure 1: Changan Automobile’s revenue growth analysis and forecast.
In general, Changan Automobile's revenue is affected by many factors, including product innovation, market expansion, new energy transformation, quality management, competitiveness of independent brands, macroeconomic environment, globalization strategy and R&D investment. It predicts that in the next few years, the company will adjust the marketing strategy of its low-end models, reduce costs and increase efficiency, improve production efficiency and profitability, and achieve rapid revenue growth.
2.2. Changan Automobile’s Cost of Goods Sold Analysis and Forecast
The cost of goods sold is a critical component of the income statement and is a primary concern for company management in controlling operations. According to Fauzi et al.’s paper, there are three basic prices related to the cost of goods: inventory, production, and the cost of goods sold [4].
As can be seen from Figure 2, in the past five years, Changan Automobile's sales cost has maintained a high growth trend, which has affected the company's profitability to a certain extent. Compared with other brands with a single product type, Changan adopts a radical diversified marketing strategy to meet the needs of different consumers. This requires the company to invest a lot of resources, including money, personnel and time. With the expansion of product lines, enterprises are facing the problem of scattered resources. This means that in the process of marketing and sales, enterprises cannot effectively concentrate resources, resulting in the problem of unsalable products, thereby increasing sales costs. At the same time, the increase in raw material costs has led to an increase in sales costs. The company needs to reduce its raw material procurement costs by signing long-term contracts and bulk purchases. The problem of Changan Automobile's inventory backlog also affects its sales costs. There is a mismatch between its inventory level and market demand, resulting in low inventory management efficiency and difficulty in achieving close cooperation and information sharing in all links of the supply chain. Although Changan Automobile is promoting the digital transformation of the supply chain, the technical and personnel management issues in the transformation process are a challenge for the company. The company needs to strengthen supply chain collaboration and optimize product structure to cope with market changes and supply chain risks. In summary, this analysis predicts the company's sales costs to continue to rise in the next few years.
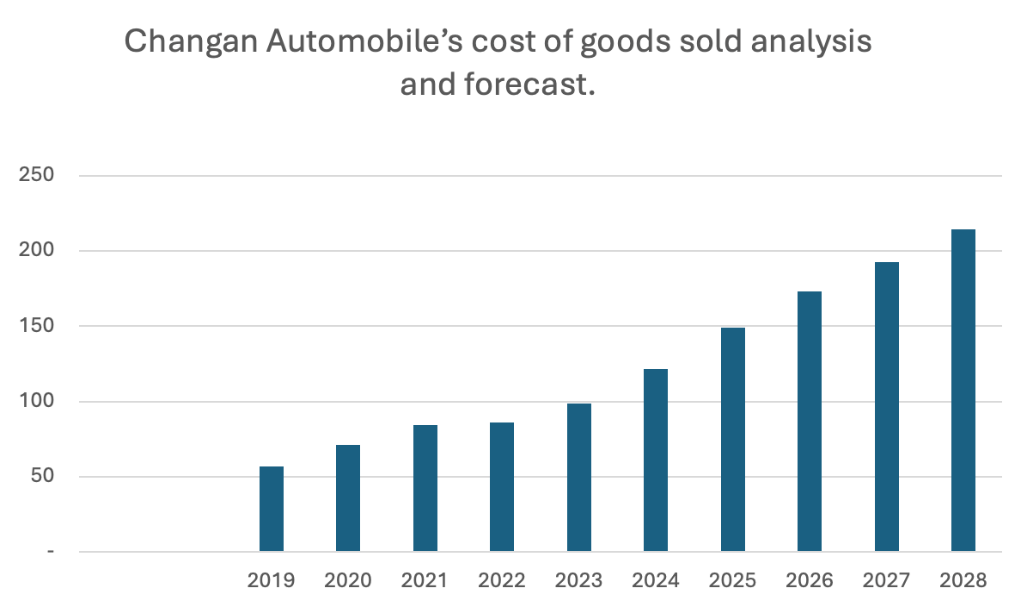
Figure 2: Changan Automobile’s cost of goods sold analysis and forecast.
2.3. Changan Automobile’s R&D Expenditure and Year-on-Year Percentage Forecast
By analyzing the company's financial statements, it can be seen that the company's R&D expenditure has gradually increased between 2019 and 2023. The year-on-year growth rate in Figure 3 can also reflect this fact, especially during the period of 2022-2023, when its year-on-year growth rate increased from 22.76% to 38.59%, indicating that the company has significantly increased its cash investment in R&D during this period . With the continuous breakthroughs in science and technology, energy saving and environmental protection have become the new trend of change in the transportation field around the world, and new energy vehicles are playing an increasingly important role [5]. Many car companies also reflect this. For example, Huawei, BYD, Xiaopeng and other car brands have successively launched new electric vehicles during this period, enhancing consumers' trust and loyalty. Compared with other car companies, Changan Automobile has a richer industrial chain, but it has defects in technology and plays the role of a "processing plant" in some joint venture brands. The company needs to speed up its research and development and continuously carry out technological innovation in order to launch more attractive and competitive products and stand out in the market.
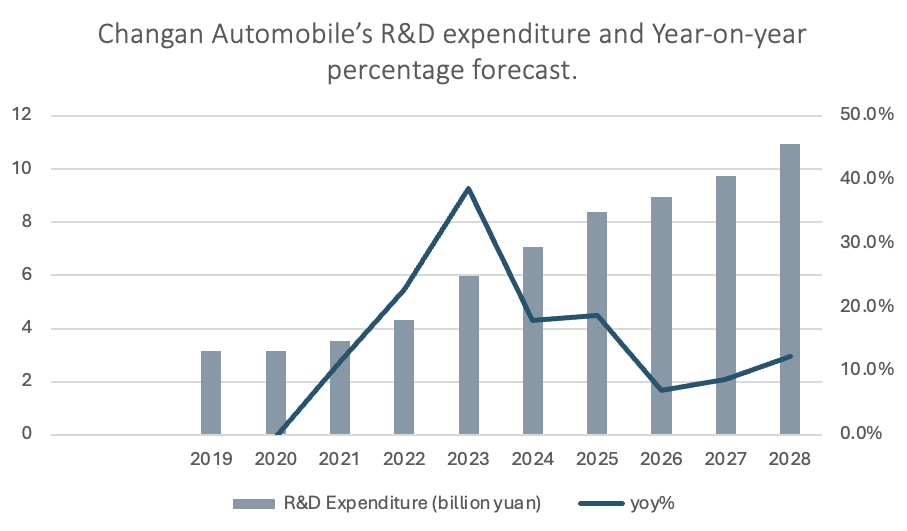
Figure 3: Changan Automobile’s R&D expenditure and Year-on-Year percentage forecast.
There are many factors that affect R&D expenditures, such as the R&D progress of competitors in the industry, customer demand for products, changes in R&D technology, market development trends, etc. At the same time, in the imperfect market condition, external funding is more costly than internal financing because of frictions arising from asymmetric information, agency problems and transaction costs. Under such conditions, firms’ investments are mostly affected by the availability of internal funds [6].
This paper predicts that companies will continue to increase their R&D investment in the next five years, but the year-on-year growth rate will decline. This growth trend is closely related to market development and corporate economic conditions. Many automakers are increasing their R&D investment in electric and hybrid vehicles. In the process, they may encounter technical bottlenecks, which will affect R&D progress and R&D investment.
In general, corporate R&D expenditures have been on the rise over the past five years and are expected to continue to grow in the future, helping companies stay competitive, expand into larger markets, and adapt to rapidly changing market environments and technological developments.
2.4. Changan Automobile’s Salary Expenditure Situation and Forecast
Through the company's annual reports from 2019 to 2023, it can get the annual salary expenditure. As can be seen from Figure 4, the data shows a trend of rising one year and falling the next. From 2019 to 2020, due to the COVID-19 pandemic, the company's salary expenditure should have declined or remained relatively stable. During this period, people's travel was restricted by the government, and the demand for cars would decrease. On the contrary, the company's salary expenditure during this period increased significantly. This shows that the company has a relatively good economic foundation, a relatively stable capital chain, and strong risk resistance. In the following years, the value still maintained the previous trend, which may be related to the economic situation after the epidemic.
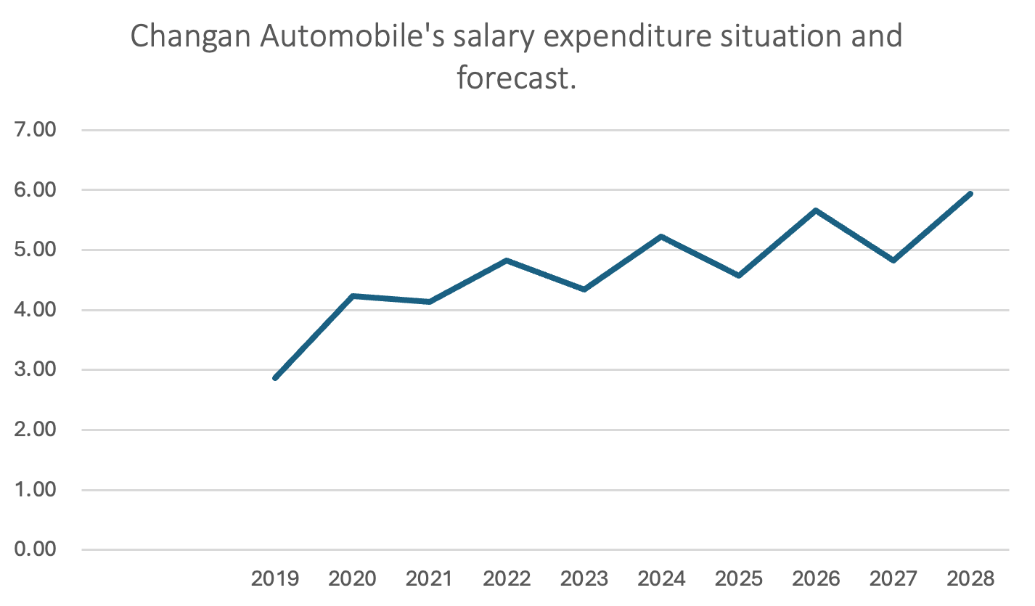
Figure 4: Changan Automobile’s salary expenditure and forecast.
Regarding the cyclical growth of the company's salary expenditure, it believes that this is a reflection of the company's effective cash flow management. As the economic environment and industry standards change, the company regularly analyzes the company's earnings, conducts risk assessments, and adjusts employee salary levels in a timely manner to improve employee work enthusiasm and satisfaction. Efficient boards may employ appropriate compensation incentives to align the interests of managers with those of the firm, thereby enabling managers to act as "good" stewards and mitigate high risk, thereby improving overall productivity and driving company performance [7].
Assuming the company's business scale remains unchanged, the company's salary expenditure in the next five years is predicted. Taking into account the average salary level in the automotive manufacturing industry, the company's geographical location, economic conditions and other factors, it believes that the company will maintain its previous business practices and its salary expenditure will maintain cyclical growth.
In general, the company's salary expenses have shown cyclical growth in the past five years and are expected to continue this growth trend in the next five years.
3. Forecast Result
Based on the previous discussion, this article calculates the total cash flow of Changan Automobile and predicts the cash flow situation in the next five years. The basic situation is as follows: the total cash flow in 2024 is 22.685 billion yuan, 17.637 billion yuan in 2025, 55.487 billion yuan in 2026, 12.658 billion yuan in 2027, and 4.464 billion yuan in 2028.
In addition, this article will also compare the forecast value of Changan Automobile's revenue with the forecast values of financial platforms such as Yahoo Finance, Xiaoniu Finance and Guolian Securities to demonstrate the relevance and reliability of the forecast results (see Table 1).
Table 1: Forecast comparison.
Revenue Estimate (billion yuan) | 2024 | 2025 | 2026 | 2027 | 2028 |
Forecasted | 143.26 | 172.92 | 208.72 | 251,93 | 304,07 |
Yahoo Finance | 187.84 | 216.27 | / | / | / |
Xiaoniu Finance | 183.25 | 220.02 | 250.05 | / | / |
Guolian securities | 179.95 | 210.47 | 240.02 | / | / |
After comparison, it is found that the annual revenue data predicted in this paper are different from those of the above financial platforms, which is mainly related to the large difference in the data in 2024. Seemingly upward trends in predictability estimates could be partly explained by changes over time in the relative importance of within-firm versus across-firm variation [8].
In the process of forecasting Changan Automobile's revenue, since the company's revenue growth rate from 2019 to 2023 is in a continuous downward trend, its revenue changes are relatively stable. Therefore, this paper used a linear regression model to calculate its approximate values. From 2024 to 2028, and made slight adjustments to the predicted values. Based on the macro-environment and corporate development, but the overall fluctuation is not large.
Among them, the value predicted by Yahoo Finance is relatively large, which mainly considers Changan Automobile's performance in the international market and the sales of its new energy vehicles. In recent years, Changan Automobile's sales in overseas markets have grown rapidly, and this factor accounts for an important proportion in Yahoo Finance's forecast.
Xiaoniu Finance places more emphasis on Changan Automobile's development trends in China, such as the launch of new models and cooperation with technology companies such as Huawei. Xiaoniu predicts that its revenue growth will increase significantly, and in the next two years, its investment in intelligentization and electrification will gradually show results.
Guolian Securities is more inclined to the impact of macroeconomic factors on the company, such as fluctuations in the global supply chain, fluctuations in raw material prices, development trends in the automotive industry, changes in the international environment, etc. Therefore, Guolian Securities' forecast for Changan Automobile is relatively conservative, but it can also be seen from its analysis data that Changan Automobile has strong growth potential in terms of revenue.
In general, the choice of forecasting models and methods leads to differences in the forecast results of different financial platforms, but it can be seen that Changan Automobile will have good operating cash inflows in the next five years, which is sufficient to ensure the normal operation of the company and has the hope of increasing its investment in research and development.
4. Risk
A related study reported that the current factors affecting the public adoption of new energy vehicles are complex, which mainly include infrastructure such as charging stations, upfront costs, public perceptions, group pressure, and the new crown epidemic, along with some technical limitations [9]. This article mainly discusses the risks in raw material prices and international markets.
4.1. Fluctuations in Raw Material Price
Against the backdrop of the rapid development of the global automotive industry, the supply chain of raw materials has become increasingly prominent, which has directly led to an increase in production costs. Batteries, the core components of electric vehicles, account for more than half of the cost. The metal materials such as lithium, cobalt, and nickel required for manufacturing batteries have a long development cycle and are in increasing demand. Changan Automobile does not yet have the ability to fully independently manufacture electric vehicles, and key material batteries still rely heavily on imports. In addition, Tesla is promoting the production of 4680 batteries and is expected to design four batteries with high energy density by 2026, which has a greater impact on domestic batteries, which are already at a disadvantage. According to Goestjahjanti & Widayati’ paper, control of the availability of production materials is due to the increase in prices of imported raw materials and supervision of production expense, with improvised way of their working to improve operational efficiency, customer service, inventory levels and profit margin [10]. Changan Automobile needs to increase its R&D efforts and find alternatives to raw materials. For example, the continuous advancement of battery technology will promote the development of new batteries such as solid-state batteries and sodium batteries, providing the company with better performance and more cost-stable material options.
4.2. International Market Risks
As the domestic automobile market gradually becomes saturated, Changan Automobile needs to find new growth points. Globalization can enable products to evolve to a higher level and maximize profits. In order to be more competitive, Changan has adopted an aggressive sales strategy in overall exports, attracting foreign consumers with cost-effectiveness by significantly reducing sales prices. Although the company has achieved good benefits in the short term, the overall profit is low, and the sales situation is in a stage where volume is not profitable. This has hindered the company from building a good brand image and gaining the trust of consumers. At present, Changan Automobile's exports are mainly based on product exports, and the industry has not yet been fully exported. Its manufacturing system is scattered, and it will take several years of development to form a complete overseas industrial chain. The policies of the automobile industry in various countries have had an adverse impact on this process, especially in the United States, India, Turkey and other countries, which have high tariffs on Chinese vehicles, 100%, 60%, and 40% respectively. In 2024, the European Union also adjusted tariffs on Chinese electric vehicles, raising them by more than 30%. These changes have dealt a heavy blow to the company's cars, especially electric vehicles, in international sales. In countries with high tariffs, Changan Automobile faces import restrictions and has difficulty expanding its market size. Its export regions are still concentrated in Asia Pacific, the Middle East, North Africa, and Central and South America, which requires the company to invest huge resources and efforts in the expansion of these countries' markets. In addition, Huawei, a competitor, is also accelerating its expansion in overseas markets. The company takes action with its strategy of being a supplier of hardware and soft-ware for the companies that compete as carriers [11].
5. Conclusion
This paper predicts the flow trend of Changan Automobile's cash flow in the next five years through an in-depth analysis of Changan Automobile's financial statements from 2019 to 2023, revealing the changes in the company's profitability, capital turnover and financial leverage. The study shows that Changan Automobile still occupies an important position in the Chinese automobile market. Despite fierce competition and market fluctuations, its brand influence and innovation capabilities provide strong support for its future development. With the continuous advancement of new energy vehicles and intelligent technologies, Changan Automobile's revenue is expected to grow steadily in the next few years. The company's optimization in cost control and production efficiency will further enhance profitability. However, the company's net profit is greatly affected by the market and cost control, and there is a phenomenon of fluctuation, which is closely related to the company's business scope and R&D scale. In order to achieve the transformation of automobile electrification and intelligence, Changan Automobile has adopted an intelligent development strategy, reasonably controlled costs, improved management efficiency, increased investment and R&D, and is expected to achieve good cash flow performance in the future. The significance of the study is to provide investors with a data-based investment decision reference and provide management with suggestions for improving financial conditions. However, the research in this paper is limited by the availability of public data and the simplified assumptions of the forecasting model.
References
[1]. Januar, F. D., Norisanti, N., & Mulia, F. (2020). Analisis financial distress dengan menggunakan model grover pada perusahaan sektor property, real estate dan kontruksi. Budgeting: Journal of Business, Management and Accounting, 1(2), 83-92.
[2]. Nallareddy, S., Sethuraman, M., & Venkatachalam, M. (2020). Changes in accrual properties and operating environment: Implications for cash flow predictability. Journal of Accounting and Economics, 69(2-3), 101313.
[3]. Kamaluddin, A., Ishak, N.A., & Mohammed, N.F. (2019). Financial Distress Prediction Through Cash Flow Ratios Analysis. International Journal of Financial Research.
[4]. Fauzi, A.A., Rifada, R.M., & Cahyani, D. (2024). Do Sales Volume and Cost of Goods Sold Increase Gross Profit Margin. AKSY Jurnal Ilmu Akuntansi dan Bisnis Syariah, 6(2), 208-222.
[5]. Jiang, Y., Wu, Q., Li, M., Gu, Y., & Yang, J. (2023). What Is Affecting the Popularity of New Energy Vehicles? A Systematic Review Based on the Public Perspective. Sustainability.
[6]. Gupta, G., & Mahakud, J. (2019). Alternative measure of financial development and investment-cash flow sensitivity: evidence from an emerging economy. Financial Innovation, 5, 1-28.
[7]. Li, X., Gupta, J., Bu, Z., & Kannothra, C. G. (2023). Effect of cash flow risk on corporate failures, and the moderating role of earnings management and abnormal compensation. International Review of Financial Analysis, 89, 102762.
[8]. Ball, R., & Nikolaev, V.V. (2021). On Earnings and Cash Flows as Predictors of Future Cash Flows. SRPN: Corporate Reporting (Topic).
[9]. Menes, M. (2021). Two decades of hybrid electric vehicle market. Journal of civil engineering and transport, 3(1), 29-37.
[10]. Goestjahjanti, F.S., & Widayati, C.C. (2020). Significance Effect Cost of Goods Sold and Inventory on Sales PT. Nippon Indosari Corpindo Tbk. Proceedings of the 4th International Conference on Management, Economics and Business (ICMEB 2019).
[11]. Micheli, J., & Carrillo, J.S. (2016). The Globalization Strategy of a Chinese Multinational: Huawei in Mexico.
Cite this article
Zheng,Y. (2025). A Financial Analysis and Performance Evaluation of Changan Automobile. Advances in Economics, Management and Political Sciences,146,118-126.
Data availability
The datasets used and/or analyzed during the current study will be available from the authors upon reasonable request.
Disclaimer/Publisher's Note
The statements, opinions and data contained in all publications are solely those of the individual author(s) and contributor(s) and not of EWA Publishing and/or the editor(s). EWA Publishing and/or the editor(s) disclaim responsibility for any injury to people or property resulting from any ideas, methods, instructions or products referred to in the content.
About volume
Volume title: Proceedings of ICFTBA 2024 Workshop: Human Capital Management in a Post-Covid World: Emerging Trends and Workplace Strategies
© 2024 by the author(s). Licensee EWA Publishing, Oxford, UK. This article is an open access article distributed under the terms and
conditions of the Creative Commons Attribution (CC BY) license. Authors who
publish this series agree to the following terms:
1. Authors retain copyright and grant the series right of first publication with the work simultaneously licensed under a Creative Commons
Attribution License that allows others to share the work with an acknowledgment of the work's authorship and initial publication in this
series.
2. Authors are able to enter into separate, additional contractual arrangements for the non-exclusive distribution of the series's published
version of the work (e.g., post it to an institutional repository or publish it in a book), with an acknowledgment of its initial
publication in this series.
3. Authors are permitted and encouraged to post their work online (e.g., in institutional repositories or on their website) prior to and
during the submission process, as it can lead to productive exchanges, as well as earlier and greater citation of published work (See
Open access policy for details).
References
[1]. Januar, F. D., Norisanti, N., & Mulia, F. (2020). Analisis financial distress dengan menggunakan model grover pada perusahaan sektor property, real estate dan kontruksi. Budgeting: Journal of Business, Management and Accounting, 1(2), 83-92.
[2]. Nallareddy, S., Sethuraman, M., & Venkatachalam, M. (2020). Changes in accrual properties and operating environment: Implications for cash flow predictability. Journal of Accounting and Economics, 69(2-3), 101313.
[3]. Kamaluddin, A., Ishak, N.A., & Mohammed, N.F. (2019). Financial Distress Prediction Through Cash Flow Ratios Analysis. International Journal of Financial Research.
[4]. Fauzi, A.A., Rifada, R.M., & Cahyani, D. (2024). Do Sales Volume and Cost of Goods Sold Increase Gross Profit Margin. AKSY Jurnal Ilmu Akuntansi dan Bisnis Syariah, 6(2), 208-222.
[5]. Jiang, Y., Wu, Q., Li, M., Gu, Y., & Yang, J. (2023). What Is Affecting the Popularity of New Energy Vehicles? A Systematic Review Based on the Public Perspective. Sustainability.
[6]. Gupta, G., & Mahakud, J. (2019). Alternative measure of financial development and investment-cash flow sensitivity: evidence from an emerging economy. Financial Innovation, 5, 1-28.
[7]. Li, X., Gupta, J., Bu, Z., & Kannothra, C. G. (2023). Effect of cash flow risk on corporate failures, and the moderating role of earnings management and abnormal compensation. International Review of Financial Analysis, 89, 102762.
[8]. Ball, R., & Nikolaev, V.V. (2021). On Earnings and Cash Flows as Predictors of Future Cash Flows. SRPN: Corporate Reporting (Topic).
[9]. Menes, M. (2021). Two decades of hybrid electric vehicle market. Journal of civil engineering and transport, 3(1), 29-37.
[10]. Goestjahjanti, F.S., & Widayati, C.C. (2020). Significance Effect Cost of Goods Sold and Inventory on Sales PT. Nippon Indosari Corpindo Tbk. Proceedings of the 4th International Conference on Management, Economics and Business (ICMEB 2019).
[11]. Micheli, J., & Carrillo, J.S. (2016). The Globalization Strategy of a Chinese Multinational: Huawei in Mexico.