


1. Introduction
Stock market is of paramount importance for global economy in terms of financial stability, corporate finance and the investor sentiment. Stock indices are used as benchmarks of market performance, and offer insight to market trend that can serve as information for investors or policy makers evaluating the economic health of a country [1,2]. The Shanghai Composite Index stands sone of the leading stock indices in China which is designed to reflect the performance of all companies listed on the Shanghai Stock Exchange. This fact testifies to the importance of making precise predictions regarding future movements in the value of the Shanghai Composite Index, both for private and institutional domestic investors as well as for foreign investors and economic planners.
Predicting stock indices is a challenging problem as financial markets are notorious for their volatility and randomness. Over the years, there have been several models proposed to predict changes in the stock market which include traditional statistical method as well as advanced machine learning techniques[3-5]. One of the most popular and commonly methods is ARIMA (AutoRegressive Integrated Moving Average), which is a long-standing approach that can capture linear dependencies present in time series data and has been used with substantial success when predicting stock price movements or index returns [6–8].
Despite their successes, ARIMA based models are known to be less robust in presence of highly volatile and non-linear data patterns represented by financial time-series [9-10]. In addition to internal correlation between stock price and trading volume, external factors (macroscopic indexes, political events, investor sentiment) are also important drivers in the fluctuation of the stock market but cannot be catch by univariate ARIMA models [11, 12]. This results in the theoretical performance of ARIMA model differing significantly from reality regarding stock market forecasting.
In light of this, the main purpose of this paper is to find out whether ARIMA model is effective on predicting Shanghai Composite Index. More precisely, the article first searches for the most suitable ARIMA model to represent the Shanghai Composite Index and then validate its predictive performance. The study focus on ARIMA modeling using the time series data of daily closing prices of Shanghai Composite Index from 1 Jan 2017 to current to generate a forecast. In this paper, we do the careful model selection, evaluation and diagnostic checks in order to handle the best forecasting model for future Shanghai Composite Index value.
The significance of this research lies in both its theoretical and practical contributions. In theory, this study supplements the existing knowledge. ARIMA models are a traditinoal and widely-used model to analyze stock prices in Western developed markets while China is an emerging market in its own right with unique characteristics as compared with western markets. Practically speaking, forecasting the Shanghai Composite Index (SCI) can contribute to better-informed investment decisions for investors; help financial institutions prevent risk exposures; and provide modality to policymakers in order to interpret market fluctuation and adjust economic policies.
2. Data
2.1. Source and Description
The data used in this study consists of the daily closing prices of the Shanghai Composite Index from January 1, 2017, to September 4, 2024. The dataset was sourced from Investing.com, a well-known financial data provider that offers accurate and up-to-date financial information. The dataset includes the following variables: date, opening price, high price, low price, closing price, trading volume, and percentage change.
The dataset contains 1,828 observations of daily trading data. Table 1 presents the descriptive statistics for the key variable of interest, the closing price of the Shanghai Composite Index, over the observation period.
Table 1: Descriptive Statistics
Statistic | Value |
Count | 1866 |
Mean | 3151.571 |
Std Dev | 258.6138 |
Min | 2464.36 |
25% | 2968.803 |
Median | 3163.22 |
75% | 3331.075 |
Max | 3715.37 |
From Fig 1, it is clear that the distribution of the closing prices appears relatively symmetric, with no extreme outliers. The central 50% of the data is spread between approximately 2950 and 3300, while the overall data ranges from about 2600 to 3500. This suggests that the Shanghai Composite Index has had a relatively stable range of closing prices during the period being analyzed. There are no points plotted outside the whiskers, indicating that there are no extreme outliers in the data based on the 1.5xIQR rule.
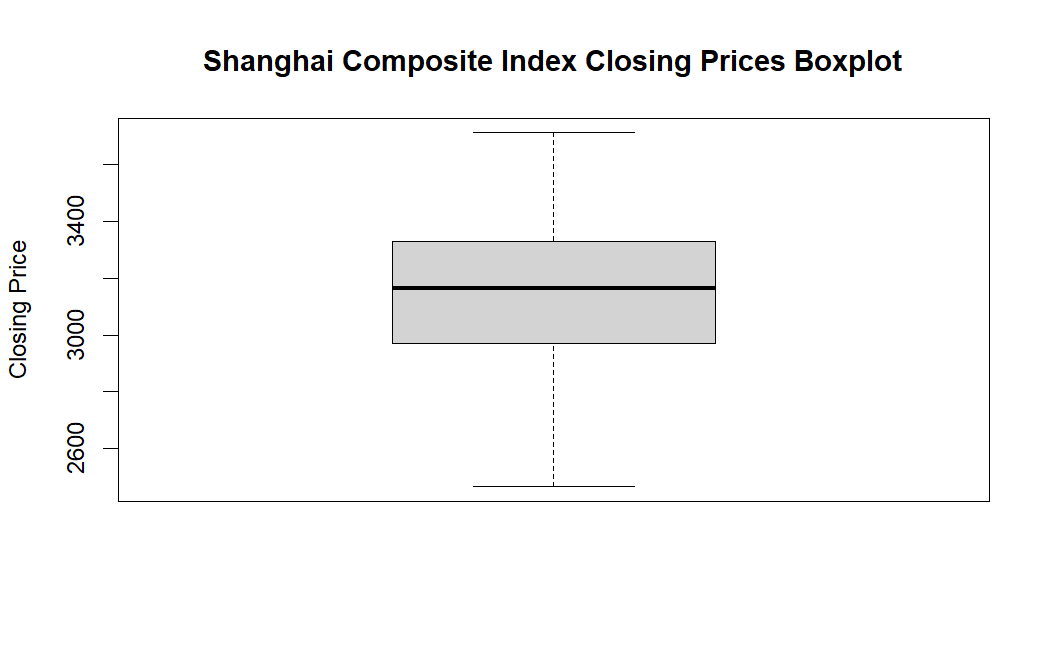
Figure 1: Shanghai Composite Index Closing Prices Boxplot (Picture Credit: Original)
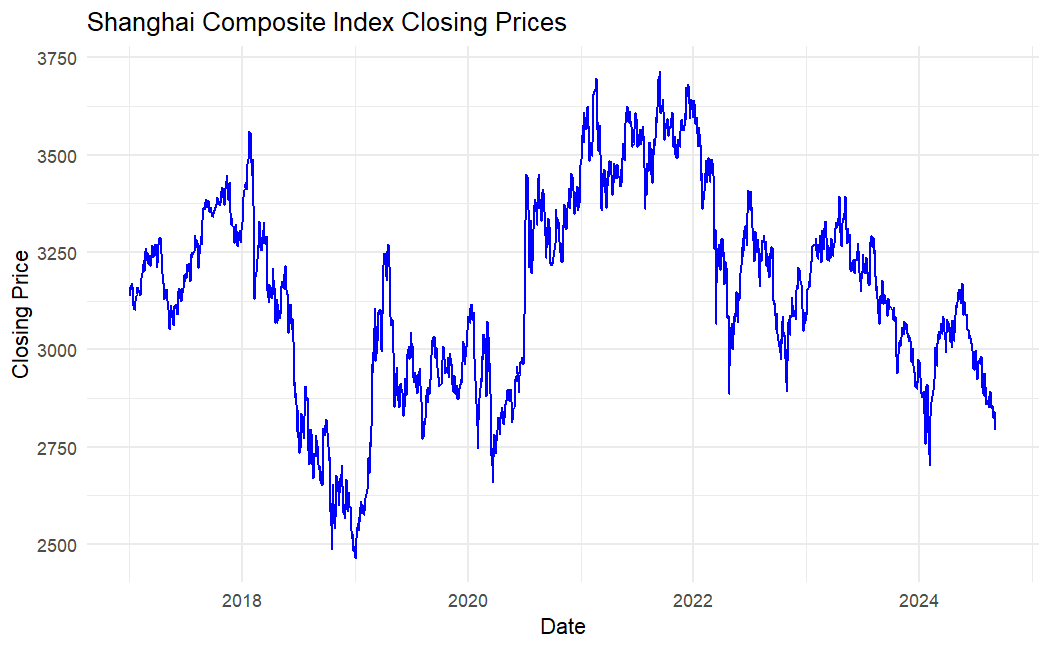
Figure 2: Shanghai Composite Index Closing Prices (Picture Credit: Original)
2.2. Data Preprocessing and Stationarity Check
The stationarity of the Shanghai Composite Index closing prices was tested using an Augmented Dickey-Fuller (ADF) test. Unit root testADF test is one of the most commonly used methods to detect unit roots in a time series, which are referred to as stationarity. ADF test is performed, which uses the statistics of the parameters of a time series model and compares it with ADF distribution to determine if a time series is stationary or not[13]. Meanwhile, stationed series are marked by the constancy of all statistical properties and joint distribution over time, shaping that process to be more predictable[14]. Hence, stationary time series data is a basic requirement to model in forecasting with models like ARIMA that assume consistent statistical properties of data over time. At first, an ADF test was applied confirming non-stationarity in the original closing prices and as shown below (Table 2);
Table 2: ADF Test Result
Test Statistic | Lag Order | p-value | Conclusion |
-2.682 | 12 | 0.2896 | Non-stationary |
The p-value of 0.2896 was greater than the significance threshold of 0.05, indicating that we could not reject the null hypothesis of non-stationarity. This confirmed that the original data contained trends or other non-stationary components, which needed to be addressed before proceeding with modeling.
To remove the non-stationary elements, a first-order differencing was applied. This method involves subtracting each observation from the previous one, effectively removing any linear trends. The differenced time series is displayed in Figure 3:
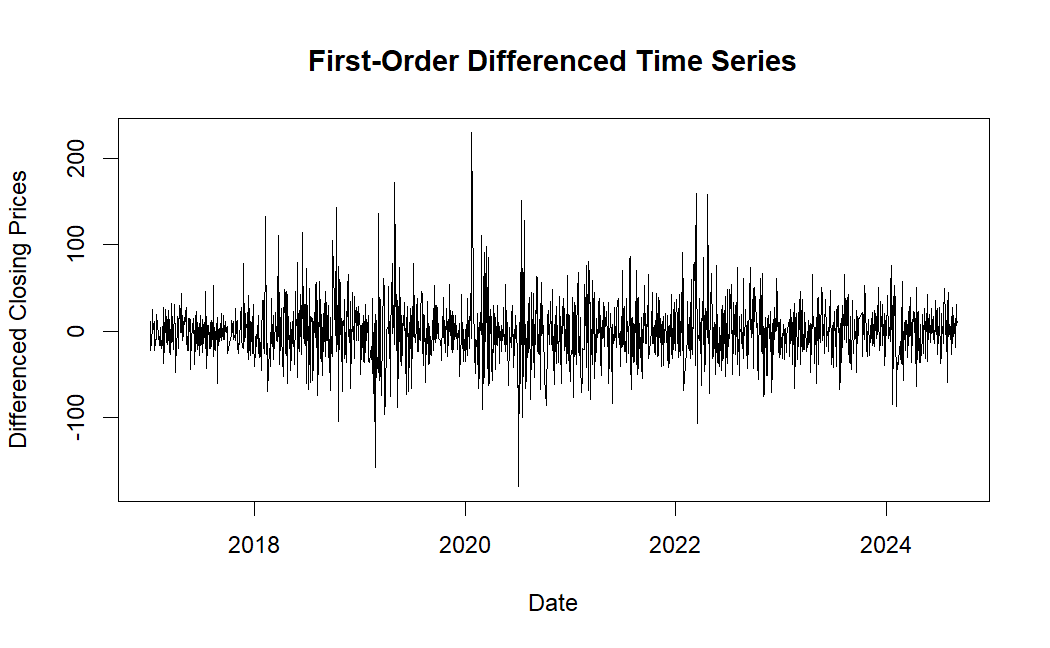
Figure 3: First-Order Differenced Time Series (Picture Credit: Original)
As shown in Figure 3,the differenced series fluctuates around a mean of zero, suggesting that the linear trends present in the original data have been removed. However, to ensure the data was now stationary, a second ADF test was performed on the differenced series:
Table 3: ADF Test Result on Differenced Time Series
Test Statistic | Lag Order | p-value | Conclusion |
-12.621 | 12 | 0.01 | Stationary |
The p-value of 0.01, being significantly below 0.05, allowed us to reject the null hypothesis. This confirmed that the first-order differencing successfully transformed the series into a stationary one, making it suitable for ARIMA modeling (Table 3).
In conclusion, the initial ADF test showed that the original Shanghai Composite Index closing prices were non-stationary. After applying first-order differencing, the second ADF test confirmed that the transformed data was stationary, allowing us to proceed with forecasting models that require this assumption.
3. Model Building
This paper describes the model-building process of time series forecasting the Shanghai Composite Index in this section. The objective to develop an ARIMA model that accurately captures the trend and periodicity in the time series data.
3.1. Model Identification
The original series is non-stationary as found by Augmented Dickey-Fuller (ADF) test. To address this, the study performed a first-order differencing of the series, and the ADF test on the differenced series confirmed stationarity, with a p-value below 0.05.
After that the order of AR and MA terms for the ARIMA model were found out using PACF (partial autocorrelation function) and ACF (autocorrelation function).
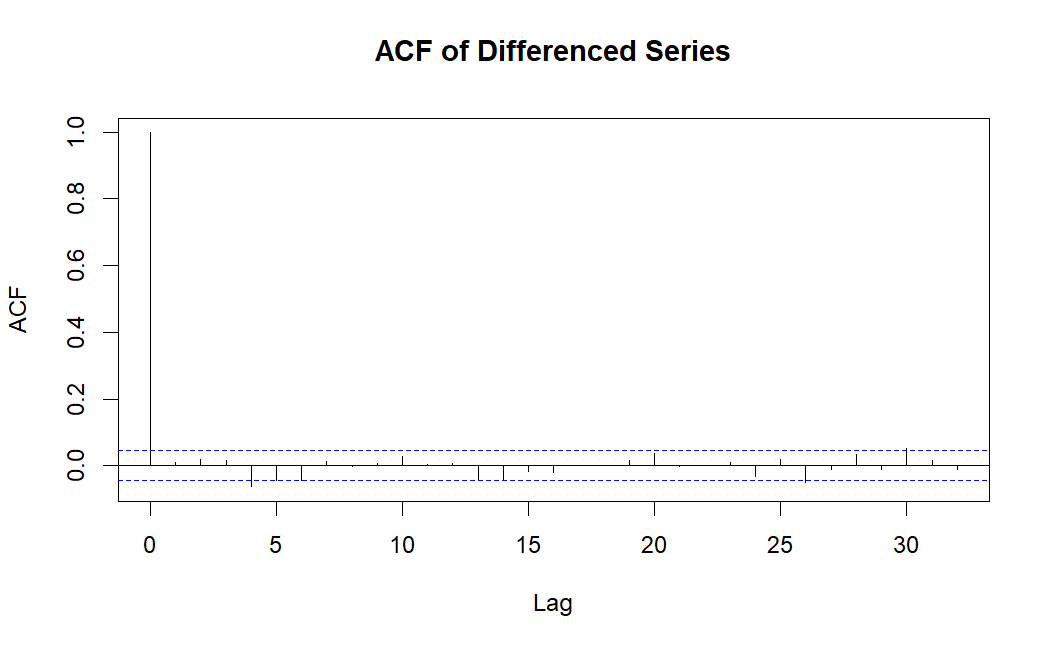
Figure 4: ACF of Differenced Series (Picture Credit: Original)
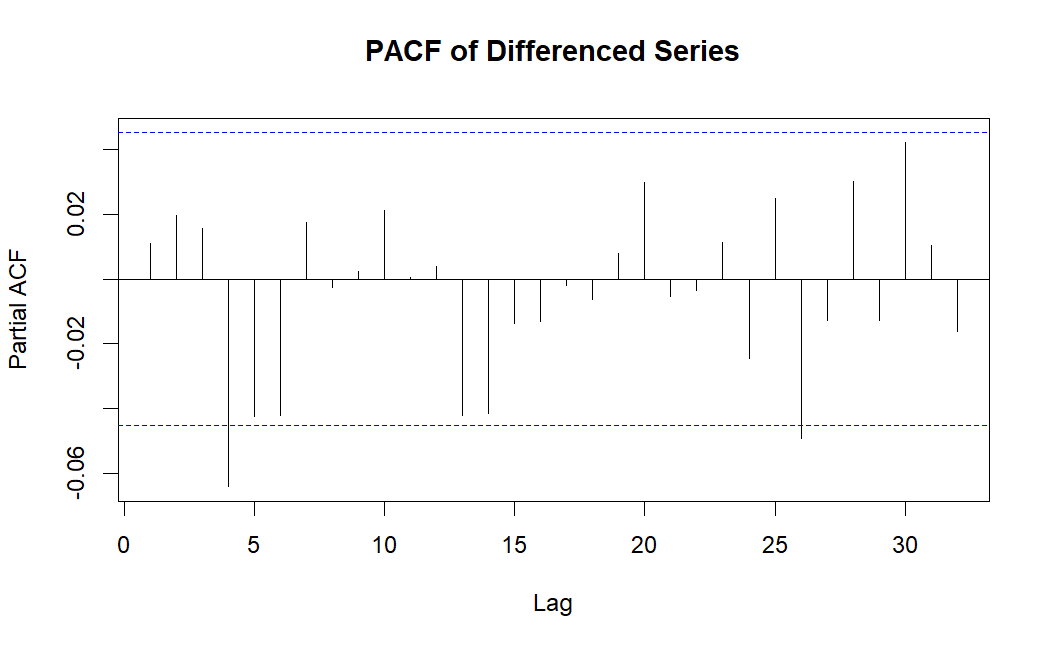
Figure 5: PACF of Differenced Series (Picture Credit: Original)
After differencing the data, we applied ARIMA (AutoRegressive Integrated Moving Average) models to identify the best-fitting model for the time series. Several models were initially considered based on the ACF and PACF plots. The PACF plot of the differenced series (shown in Figure 4 and 5) suggested that AR terms might be appropriate up to lag 4, while the ACF plot suggested an MA term at lag 1 or 0.
We tested the following three ARIMA models to determine the optimal fit:
• ARIMA(4,1,0)
• ARIMA(4,2,0)
• ARIMA(4,1,1)
Each model was evaluated based on its goodness-of-fit metrics, including the Akaike Information Criterion (AIC), Bayesian Information Criterion (BIC), and residual diagnostics.
3.2. Model Selection and Diagnostics
The choice of model is less systemic, and following any logical thought process leading from the graph can often be misleading. Hence, different metrics are often used to evaluate if the parameters chosen are ideal. Indicators commonly used are AIC and BIC[15].
The parameter estimates for the models are presented in the following tables.
Table 4: Parameters of the Models
ARIMA(4,1,0) | ARIMA(4,2,0) | ARIMA(4,1,1) | |
Residual Variance | 989.9 | 1218 | 988 |
AIC | 18162.72 | 18539.72 | 18135.51 |
BIC | 18190.37 | 18567.38 | 18168.59 |
According to AIC, BIC along with residual variance ARIMA(4,1,1) comes out as the best classifier model. It resulted in the lowest AIC (18135.51) and BIC (18168.59), which means it provided a better fit of candidate model to the data as compared to other models came into observation. In addition, the residual variance was that with the least amount (988) indicating fewer reasons for this unexplained variability (Table 4).
The performance of the three models was compared based on several error measures calculated on the training set, including Mean Error (ME), Root Mean Square Error (RMSE), Mean Absolute Error (MAE), and Mean Absolute Percentage Error (MAPE). Table 5 summarizes the training set error metrics for each model.
Table 5: Error Metrics for each Model
Model | ME | RMSE | MAE | MAPE |
ARIMA(4,1,0) | 0.1893 | 31.42 | 22.56 | 0.7227 |
ARIMA(4,2,0) | -0.0322 | 34.84 | 25.44 | 0.8143 |
ARIMA(4,1,1) | 0.1875 | 31.24 | 22.45 | 0.7188 |
As seen in Table 5, ARIMA(4,1,1) had the lowest RMSE, MAE, and MAPE, indicating that it is the most accurate model for predicting the Shanghai Composite Index (Figure 6).
To verify the adequacy of the chosen model, residual diagnostic checks were conducted. As shown in Figure 6, the residuals of the ARIMA(4,1,1) model exhibited no significant autocorrelation (ACF), implying that the model captured the underlying structure of the data well. Additionally, the histogram of residuals (Figure 7) showed a roughly normal distribution, further supporting the assumption of normally distributed residuals.
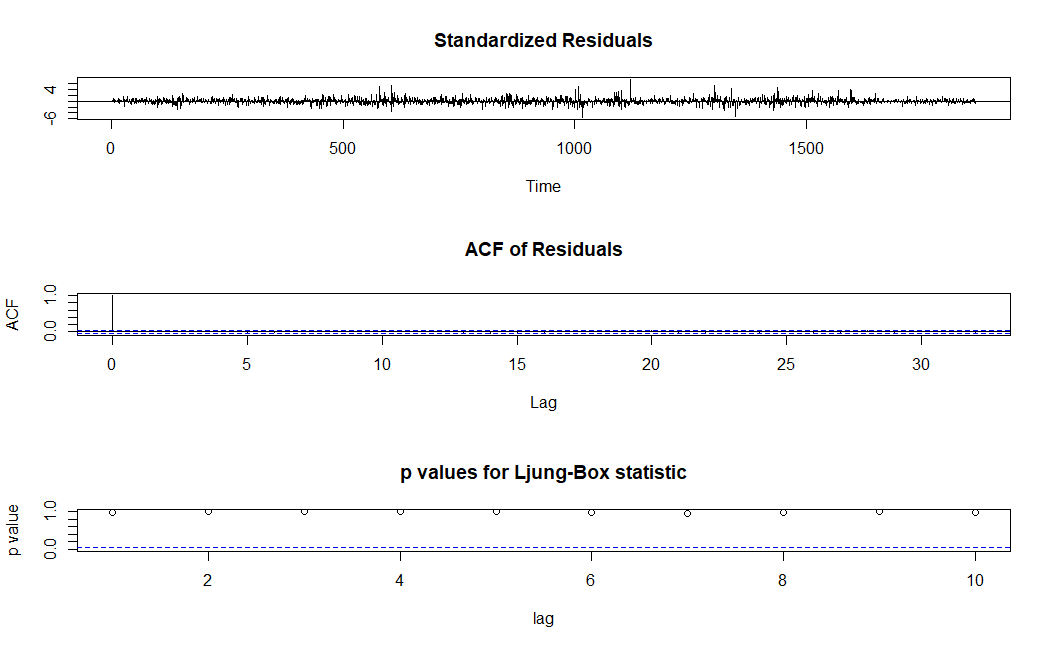
Figure 6: Residuals of Arima(4,1,1) (Picture Credit: Original)
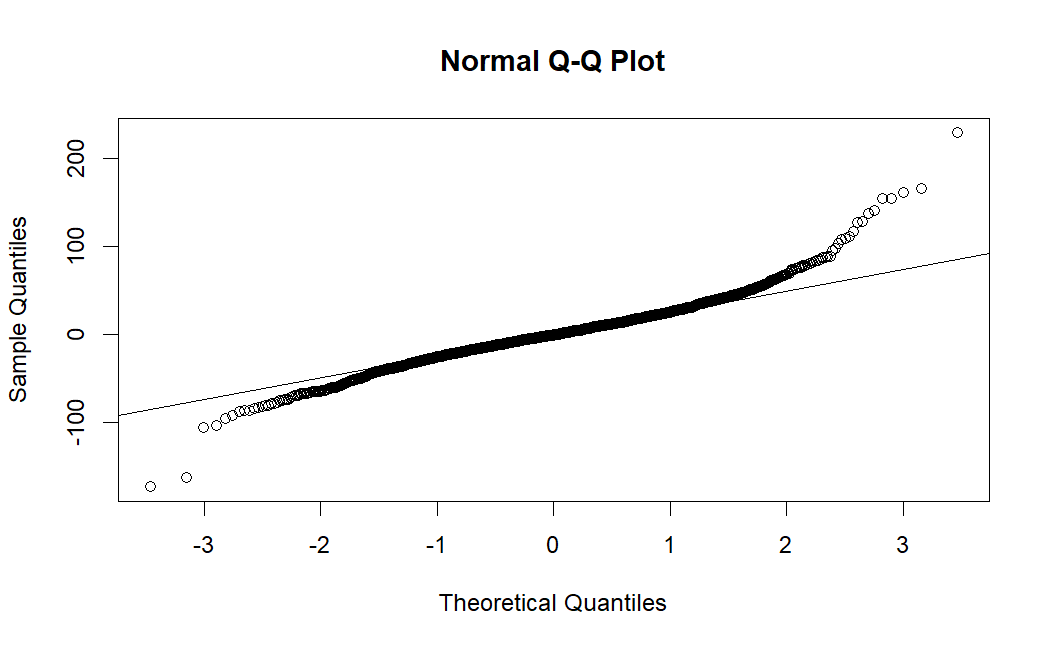
Figure 7: Normal Q-Q Plot (Picture Credit: Original)
In conclusion, the ARIMA(4,1,1) model is the most appropriate for forecasting the Shanghai Composite Index based on the data available. It provides the best fit and most accurate forecasts while maintaining a balance between model complexity and goodness of fit.
3.3. Result Analyses
Figure 8 illustrates the forecast from the ARIMA(4,1,1) model, showing the predicted values along with the confidence intervals. The forecast suggests that while the Shanghai Composite Index will experience fluctuations, the general trend remains within a stable range.
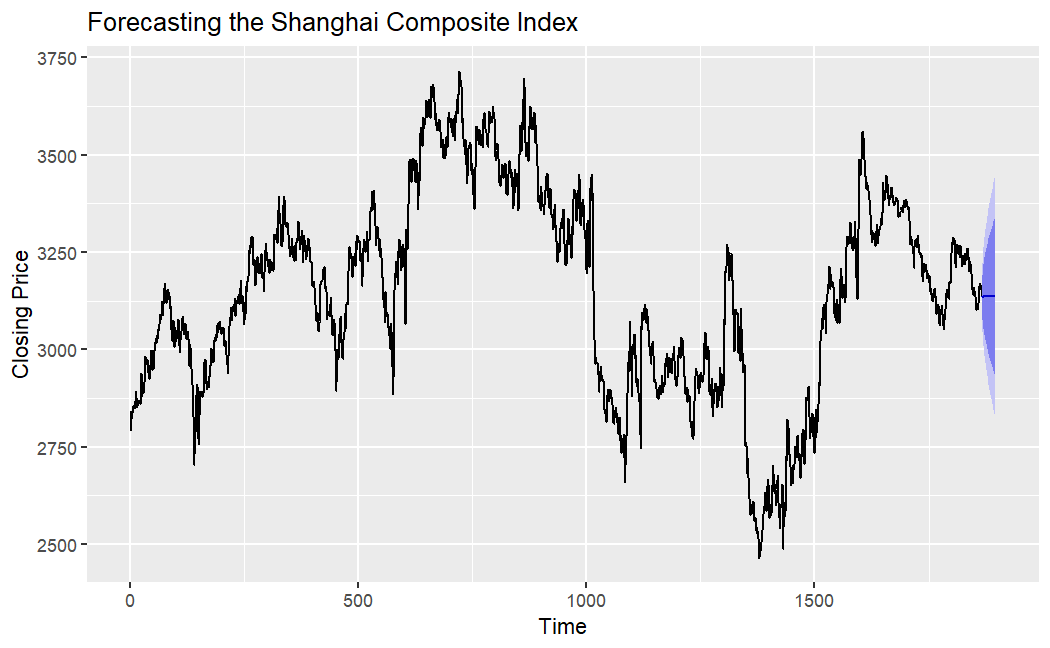
Figure 8: Forecasting of Shanghai Composite Index (Picture Credit: Original)
4. Conclusion
The optimal model selected for forecasting based on this study was ARIMA(4,1,1) for the Shanghai Composite Index. After comparing several ARIMA models, such as the ARIMA(4,1,0), and the ARIMA(4,2,0) we identified that the ARIMA(4,1,1) provided an optimum performance based on a range of metrics such as lowest AIC and BIC values while having minimized residual variance with best respective estimated RMSE & MA. This model was able to fit great historical trends of the Shanghai and provided a relatively stable forecast for the near future.
However, despite the model's strong alignment with historical data, there is a significant gap between the model's forecast and the actual movements of the Shanghai Composite Index in recent months. While the ARIMA(4,1,1) model anticipated a stable or mildly fluctuating trend, the actual performance of the Shanghai Composite Index has exhibited a marked downward trend. This discrepancy underscores some of the intrinsic limitations of the ARIMA model in accurately reflecting the complexities of financial markets.
The reasons for the divergence between how the index was forecasted and subsequently trending may include:
(1) External Economic Factors
The ARIMA model used in this article is a univariate time series model that does not consider macroeconomic external factors that may have a great influence on the characteristics of the stock markets, only historical price data of Shanghai Composite Index were used. Falling under the weight of recent economic uncertainties – China’s slowing against higher global trade backdrop, all complicated by domestic policy fluctuations – the Shanghai Composite Index has come off, hitting lows that saw it test a 4-year low achieved during this mid-July reset. Nevertheless, due to the non-consideration of these macroeconomic factors in ARIMA hence results slight forecast deviation.
(2) Market Sentiment and Investor Behavior:
The investor sentiment usually gets reflected in the financial markets which make them unstable leading to sudden changes in the market direction and cannot always be predicted well using traditional time series models. Market sentiment, for instance driven by geopolitical events, economic uncertainty or even shifts in investor confidence can trigger diverging market trends that depart from otherwise typical patterns[16,17]. The ARIMA(4,1,1 ) model based on historical data only does not cater to these non-linear sentiment driven changes.
(3) Model Limitations:
ARIMA models are good at picking up linear trends and volatility in the short-term, but its ability to predict non-linear movement of markets can often fail especially when there is an external shock or unexpected events. There could be good reasons to suspect that the recent decline in Chinese stocks (Shanghai Composite Index) is significantly influenced by non-linear dynamics, and so we might expect our simple ARIMA model not to do a very good job of capturing these dynamics. Also, the absence of exogenous variables prevents the model to generate more complete set predictions.
In summary, although the ARIMA(4,1,1) model worked well in forecasting the Shanghai Composite Index initially, as it failed to consider external economic variables and market sentiment, and with non-linear behavior of market iteration contradicting the linear structure of ARIMA modeling approaches lead to a gap between predictive scenarios and actual results. There is scope in future work to account for exogenous variables, investigate non-linear models and include real-time updating methods that would enhance the robustness of predictions as well as accounting for other nuances existing within financial markets.
References
[1]. Carpenter, J. N., & Whitelaw, R. F. (2017). The development of China's stock market and stakes for the global economy. Annual Review of Financial Economics, 9(1), 233-257.
[2]. Fedorova, E., Musienko, S., & Afanasyev, D. (2020). Impact of the Russian stock market on economic growth. Finance: Theory and Practice, 24(3), 161-173.
[3]. Kumar, D., Sarangi, P. K., & Verma, R. (2022). A systematic review of stock market prediction using machine learning and statistical techniques. Materials Today: Proceedings, 49, 3187-3191.
[4]. Strader, T. J., Rozycki, J. J., Root, T. H., & Huang, Y. H. J. (2020). Machine learning stock market prediction studies: review and research directions. Journal of International Technology and Information Management, 28(4), 63-83.
[5]. Pang, X., Zhou, Y., Wang, P., Lin, W., & Chang, V. (2020). An innovative neural network approach for stock market prediction. The Journal of Supercomputing, 76, 2098-2118.
[6]. Khanderwal, S., & Mohanty, D. (2021). Stock price prediction using ARIMA model. International Journal of Marketing & Human Resource Research, 2(2), 98-107.
[7]. Dhyani, B., Kumar, M., Verma, P., & Jain, A. (2020). Stock market forecasting technique using arima model. International Journal of Recent Technology and Engineering, 8(6), 2694-2697.
[8]. Kulshreshtha, S. (2020). An ARIMA-LSTM Hybrid Model for Stock Market Prediction Using Live Data. Journal of Engineering Science & Technology Review, 13(4).
[9]. Wijesinghe, G. W. R. I., & Rathnayaka, R. M. K. T. (2020, December). Stock Market Price Forecasting using ARIMA vs ANN; A Case study from CSE. In 2020 2nd International Conference on Advancements in Computing (ICAC) (Vol. 1, pp. 269-274). IEEE.
[10]. Mondal, P., Shit, L., & Goswami, S. (2014). Study of effectiveness of time series modeling (ARIMA) in forecasting stock prices. International Journal of Computer Science, Engineering and Applications, 4(2), 13.
[11]. Sivaramakrishnan, S., Srivastava, M., & Rastogi, A. (2017). Attitudinal factors, financial literacy, and stock market participation. International journal of bank marketing, 35(5), 818-841.
[12]. Al-Dwiry, M., Al-Eitan, G. N., & Amira, W. (2022). Factors affecting stock price: Evidence from commercial banks in the developing market. Journal of Governance and Regulation/Volume, 11(4).
[13]. Wang, J., Ji, T., & Li, M. (2021, September). A combined short-term forecast model of wind power based on empirical mode decomposition and augmented dickey-fuller test. In Journal of Physics: Conference Series (Vol. 2022, No. 1, p. 012017). IOP Publishing.
[14]. Liu, Y., Wu, H., Wang, J., & Long, M. (2022). Non-stationary transformers: Exploring the stationarity in time series forecasting. Advances in Neural Information Processing Systems, 35, 9881-9893.
[15]. Zhang, Y., & Meng, G. (2023, March). Simulation of an adaptive model based on AIC and BIC ARIMA predictions. In Journal of Physics: Conference Series (Vol. 2449, No. 1, p. 012027). IOP Publishing.
[16]. Ben Yaala, S., & Henchiri, J. E. (2024). Predicting stock market crashes in MENA regions: study based on the irrationality of investor behavior and the NARX model. Journal of Financial Regulation and Compliance.
[17]. Dhika, R., & Dewi, R. (2024). Analyzing Factors Influencing Stock Prices on Ex-Dividend Day: Insights into Dividend Yield, Investor Behavior, and Market Sentiment. Indonesia Accounting Research Journal, 11(3), 150-162.
Cite this article
Li,Y. (2025). Forecasting the Shanghai Composite Index Using the ARIMA Model. Advances in Economics, Management and Political Sciences,144,107-115.
Data availability
The datasets used and/or analyzed during the current study will be available from the authors upon reasonable request.
Disclaimer/Publisher's Note
The statements, opinions and data contained in all publications are solely those of the individual author(s) and contributor(s) and not of EWA Publishing and/or the editor(s). EWA Publishing and/or the editor(s) disclaim responsibility for any injury to people or property resulting from any ideas, methods, instructions or products referred to in the content.
About volume
Volume title: Proceedings of ICFTBA 2024 Workshop: Finance's Role in the Just Transition
© 2024 by the author(s). Licensee EWA Publishing, Oxford, UK. This article is an open access article distributed under the terms and
conditions of the Creative Commons Attribution (CC BY) license. Authors who
publish this series agree to the following terms:
1. Authors retain copyright and grant the series right of first publication with the work simultaneously licensed under a Creative Commons
Attribution License that allows others to share the work with an acknowledgment of the work's authorship and initial publication in this
series.
2. Authors are able to enter into separate, additional contractual arrangements for the non-exclusive distribution of the series's published
version of the work (e.g., post it to an institutional repository or publish it in a book), with an acknowledgment of its initial
publication in this series.
3. Authors are permitted and encouraged to post their work online (e.g., in institutional repositories or on their website) prior to and
during the submission process, as it can lead to productive exchanges, as well as earlier and greater citation of published work (See
Open access policy for details).
References
[1]. Carpenter, J. N., & Whitelaw, R. F. (2017). The development of China's stock market and stakes for the global economy. Annual Review of Financial Economics, 9(1), 233-257.
[2]. Fedorova, E., Musienko, S., & Afanasyev, D. (2020). Impact of the Russian stock market on economic growth. Finance: Theory and Practice, 24(3), 161-173.
[3]. Kumar, D., Sarangi, P. K., & Verma, R. (2022). A systematic review of stock market prediction using machine learning and statistical techniques. Materials Today: Proceedings, 49, 3187-3191.
[4]. Strader, T. J., Rozycki, J. J., Root, T. H., & Huang, Y. H. J. (2020). Machine learning stock market prediction studies: review and research directions. Journal of International Technology and Information Management, 28(4), 63-83.
[5]. Pang, X., Zhou, Y., Wang, P., Lin, W., & Chang, V. (2020). An innovative neural network approach for stock market prediction. The Journal of Supercomputing, 76, 2098-2118.
[6]. Khanderwal, S., & Mohanty, D. (2021). Stock price prediction using ARIMA model. International Journal of Marketing & Human Resource Research, 2(2), 98-107.
[7]. Dhyani, B., Kumar, M., Verma, P., & Jain, A. (2020). Stock market forecasting technique using arima model. International Journal of Recent Technology and Engineering, 8(6), 2694-2697.
[8]. Kulshreshtha, S. (2020). An ARIMA-LSTM Hybrid Model for Stock Market Prediction Using Live Data. Journal of Engineering Science & Technology Review, 13(4).
[9]. Wijesinghe, G. W. R. I., & Rathnayaka, R. M. K. T. (2020, December). Stock Market Price Forecasting using ARIMA vs ANN; A Case study from CSE. In 2020 2nd International Conference on Advancements in Computing (ICAC) (Vol. 1, pp. 269-274). IEEE.
[10]. Mondal, P., Shit, L., & Goswami, S. (2014). Study of effectiveness of time series modeling (ARIMA) in forecasting stock prices. International Journal of Computer Science, Engineering and Applications, 4(2), 13.
[11]. Sivaramakrishnan, S., Srivastava, M., & Rastogi, A. (2017). Attitudinal factors, financial literacy, and stock market participation. International journal of bank marketing, 35(5), 818-841.
[12]. Al-Dwiry, M., Al-Eitan, G. N., & Amira, W. (2022). Factors affecting stock price: Evidence from commercial banks in the developing market. Journal of Governance and Regulation/Volume, 11(4).
[13]. Wang, J., Ji, T., & Li, M. (2021, September). A combined short-term forecast model of wind power based on empirical mode decomposition and augmented dickey-fuller test. In Journal of Physics: Conference Series (Vol. 2022, No. 1, p. 012017). IOP Publishing.
[14]. Liu, Y., Wu, H., Wang, J., & Long, M. (2022). Non-stationary transformers: Exploring the stationarity in time series forecasting. Advances in Neural Information Processing Systems, 35, 9881-9893.
[15]. Zhang, Y., & Meng, G. (2023, March). Simulation of an adaptive model based on AIC and BIC ARIMA predictions. In Journal of Physics: Conference Series (Vol. 2449, No. 1, p. 012027). IOP Publishing.
[16]. Ben Yaala, S., & Henchiri, J. E. (2024). Predicting stock market crashes in MENA regions: study based on the irrationality of investor behavior and the NARX model. Journal of Financial Regulation and Compliance.
[17]. Dhika, R., & Dewi, R. (2024). Analyzing Factors Influencing Stock Prices on Ex-Dividend Day: Insights into Dividend Yield, Investor Behavior, and Market Sentiment. Indonesia Accounting Research Journal, 11(3), 150-162.