


1. Introduction
Stock indices are important for financial aspects of a country which are designed to quantify the movements of the stock market prices [1]. Due to the above fact, effective stock price forecasting is essential for both individual and institutional investors which can be used to point out the relationship or the summation of the series of data [2]. In addition to assisting them in making more prudent investment decisions and increasing risk management, it can also have a significant influence on business strategy development, allocation of resources, market productivity, consumer confidence, and fiscal policy formulation [3]. Meanwhile, it supports the sound operation of the whole economic system and aids in preserving the stability of the financial markets.
At present, the academic circle has done quite a lot of research on stock price forecasting, which can be divided into three types. The first is studying the impact of exogenous variables on asset prices, such as Hosseini and Lai mentioned the connections between four macroeconomic factors—the price of crude oil (COP), the money supply (M2), industrial output (IP), and the inflation rate (IR) in China and India—and stock market indexes [4]. The second is using machine learning for stock price forecasting, for example Mailagaha Kumbure investigates machine learning techniques for stock market prediction, focusing on the markets, stock indices, and variables used as input, and the review that builds a model for choosing stocks using machine learning techniques to improve the benchmark index's performance for individual investors [5-6]. The third will be building an asset price prediction model using single stock price time series data, which include application of both non-linear (GARCH, ARCH, and neural networks) and linear (AR, MA, and ARIMA) algorithms [7]; the PSR technique and long- and short-term memory networks (LSTMs) for DL are the foundations of a DNN-based prediction model that is used to forecast stock values [8]; and Wang & Zhang & Guo describe the hybrid model combining ESM, ARIMA, and BPNN is proposed for forecasting [9]. But above all, studies do not contain the comparison of Shanghai Composite Index and OMX20 for both ETS model and ARIMA model. It is important to know which model is better for prediction under these circumstances.
In this paper, ARIMA and ETS models are both statistical models constructed to forecast the stock price of Shanghai Composite and OMX20 time series data. This paper uses data from 2020.1 to 2023.3 as the training set and data from 2023.3 to 2024.9 as the test set. After fitting the data of the training set with ARIMA model and ETS model, the results show that both two models can predict the development trend of stock price correctly. Therefore, this paper further compares the RMSE index of the two models. The results show that the RMSE value of ARIMA model fitting results is smaller than that of ETS model fitting results, so, this paper concludes that ARIMA model prediction results are more accurate. Both ARIMA and ETS are popular models for forecasting time series data. This study effectively blends the two models and ultimately concludes that the ARIMA model is more accurate, offering a fresh viewpoint on stock price prediction.
2. Data
Two countries were selected to compare stock indices across different economic contexts (developing and developed) to reduce bias. The dataset includes the Shanghai Composite Index, and Copenhagen OMX 20 Index from January 1, 2020, to September 16, 2024, sourced from Investing [10]. After data cleaning, the final dataset used for the research was obtained. Table 1 and Table 2 are the descriptive statistics data of Copenhagen OMX20 Index and Shanghai Composite Index. The columns on the leftmost are the metric in the datasets which contain close price, open price, highest price, lowest price, volume (million) or volume (billion) and change. I calculated each metric with their minimum(min), first quartile 25% (1st.Qu), median, mean, third quartile 75% (3rd.Qu.), maximum(max), standard deviation (SD), and their length.
Table 1: Descriptive Statistics of Copenhagen OMX20 Index Data
Metric | Min | 1st Qu. | Median | Mean | 3rd Qu. | Max | SD | Length |
Close | 939.80 | 1474.50 | 1745.60 | 1817.50 | 2077.70 | 2952.50 | 457.44 | 1181 |
Open | 931.90 | 1478.00 | 1747.70 | 1816.70 | 2079.40 | 2931.50 | 457.33 | 1181 |
High | 967.40 | 1485.70 | 1762.30 | 1831.60 | 2089.60 | 2966.80 | 460.66 | 1181 |
Low | 900.30 | 1465.90 | 1727.20 | 1801.90 | 2055.90 | 2903.70 | 453.73 | 1181 |
Volume (M) | 2.62 | 9.80 | 11.59 | 12.70 | 14.10 | 59.88 | 4.86 | 1181 |
Change | -7.52 | -0.70 | 0.10 | 0.08 | 0.89 | 9.35 | 1.32 | 1181 |
The prediction data that is used for this paper is the “close” row. The minimum and maximum of the close price is 939.80 and 2952.50, the 25% (first quartile) and 75% (third quartile) is 1474.50 and 2077.70, the median and mean of the 1181 numbers of observations is 1745.60 and 1817.50. The standard deviation of the 1181 observations is 457.44.
Table 2: Descriptive Statistics of Shanghai Composite Index
Metric | Min | 1st Qu. | Median | Mean | 3rd Qu. | Max | SD | Length |
Close | 939.76 | 1474.54 | 1745.61 | 1817.45 | 2077.70 | 2952.52 | 457.44 | 1142 |
Open | 931.88 | 1477.98 | 1747.69 | 1816.68 | 2079.42 | 2931.53 | 457.33 | 1142 |
High | 967.39 | 1485.65 | 1762.28 | 1831.64 | 2089.65 | 2966.79 | 460.66 | 1142 |
Low | 900.29 | 1465.86 | 1727.21 | 1801.94 | 2055.89 | 2903.69 | 453.73 | 1142 |
Volume (B) | 2.62 | 9.80 | 11.59 | 12.70 | 14.10 | 59.88 | 4.85 | 1142 |
Change | -7.52 | -0.70 | 0.10 | 0.08 | 0.89 | 9.35 | 1.32 | 1142 |
For Shanghai Composite Index, the minimum and maximum of the close price is 939.76 and 2952.52, the 25% (first quartile) and 75% (third quartile) is 1474.54 and 2077.70, the median and mean of the 1178 numbers of observations is 1745.61 and 1817.45. The standard deviation of the 1178 observations is 457.44.
3. Methods
3.1. ARIMA Model
ARIMA could serve as a very effective forecasting tool for time series data without seasonal features. This is so because ARIMA models combine three key elements to both collect and forecast the dynamic behavior of data. First, the autoregressive (AR) component. The link between an observation and many of its antecedent observations (lags) is represented by the AR component. The ARIMA model may detect autocorrelations in different time series, or correlations between present values and past values, by examining historical data points. Second, the integrated component (I). It represents the number of times that the data needs to be different in order to make it stationary, which does not contain trends and seasonality. Third, it is the moving average component (MA). It illustrates how an observation and a residual error from a moving average of earlier time steps relate to one another. The specific formula of ARIMA model is below in Equation (1).
\( {Y_{t}} = c + \sum _{i=1}^{p}{φ_{i}}{Y_{t-i}}+\sum _{i=1}^{q}{θ_{t}}{ϵ_{t-i}}+{ϵ_{t}} \) | (1) |
In this formula, \( {Y_{t}} \) is the Shanghai Composite Index and OMX20 that the paper studies. \( {φ_{1 }} \) to \( {φ_{p}} \) are the parameters of the ARIMA model. These parameters are used to describe the relationship between the current value and the value of the past p time points. \( {θ_{1}} \) to \( {θ_{q}} \) are the parameters of the ARIMA model. These parameters are used to describe the relationship between the current value and the error at q time points in the past. is the error term at time t. \( ϵ \) is a constant term.
3.2. ETS Model
Another method is called exponential Smoothing State Space Model (ETS model). ETS is widely used in the time series forecasting method. Not similar to ARIMA, ETS is more structurally interpretable by modeling the components of a time series with no stationary but with exponential smoothing.
There are also three main components of the ETS model. First, it is the Error component (E). The error component specifies the kind of randomness or mistake in the data, which might be multiplicative (M) or additive (A). It means that changes in the data cannot be explained by trends of seasonality. Second, it is the Trend (T) component which describes the long-term trend of a time series over time. Third, it is the seasonality (S). The seasonality component captures recurring patterns at regular intervals.
The flow of data processing by the ETS model contains the model identification, model fitting, forecast and model evaluation. Prior to choosing the right kind of error (additive or multiplicative), it is necessary to identify the model and ascertain whether the time series data contains trend and seasonal components. The second step in this work is model fitting, which involves estimating the model parameters using historical data and then using the estimated values to fit the time series data. Third, this study forecasts future values using a well-fitted model. Lastly, by computing the prediction error and charting the expected value against the actual value, this research must assess the model's predictive ability.
4. Results
This paper uses data from 2020.1.1 to 2023.3 (first 70%) as the training set and data from 2023.3 to 2024.9 (rest 30%) as the test set. The parameters obtained by fitting training set data are shown in Table 3 below.
Table 3: Parameter Fitting Results
Parameter 1 | Parameter 2 | Parameter 3 | |
ARIMA (SARIMA) | 2 | 1 | 2 |
ETS | A | N | N |
As shown in Table 3, this paper chooses the ARIMA (2,1,2) and ETS (A, N, N) models respectively. For ARIMA (2,1,2), p=2 means that there is an autoregressive part, that is, the model uses past values to predict the current value. d=1 means that the data needs one difference to reach a stationary state. This means that the model assumes that there are non-stationary trend or seasonal components in the data, and these no stationarities can be eliminated by differencing. q=2 indicates that there is a moving average part, that is, the model does use past error terms to predict the current value. For the ETS (A, N, N) model, the first letter A represents the additional model applied to the error term. The second letter N represents that no trend is included. The third letter N represents that the model does not have seasonal terms.
4.1. ARIMA Model Results
Below is the ARIMA (SARIMA) model that predicted the close price. From the beginning of 2020 until the forecast point, the black line represents the actual observed closing price of the Shanghai Composite Index. Volatility appears on the index over this time period, especially with significant rises and falls in 2020 and 2021. The point at which the prediction starts is the part behind the dotted line. The blue line shows the ARIMA (SARIMA) model's forecast for future prices. As can be seen from the graph, the blue line of forecasts flattens out, indicating that the ARIMA (SARIMA) model predicts less volatility in future closing prices, close to a stable level (See Figure 1).
The gray area represents the 95% confidence interval. This means that in the future, there is a 95% chance that the actual index value will fall within this gray area. The confidence interval gradually widens over time, which indicates that the uncertainty of the forecast increases with time. Although the model predicted relatively stable values, the wider confidence interval suggested large future price fluctuations.
The prediction of the Shanghai Composite Index by the ARIMA (SARIMA) model is relatively stable, and the predicted value has no significant trend increase or decrease. However, the widening of confidence intervals over time indicates that future forecasts become more uncertain and may be subject to large fluctuations.
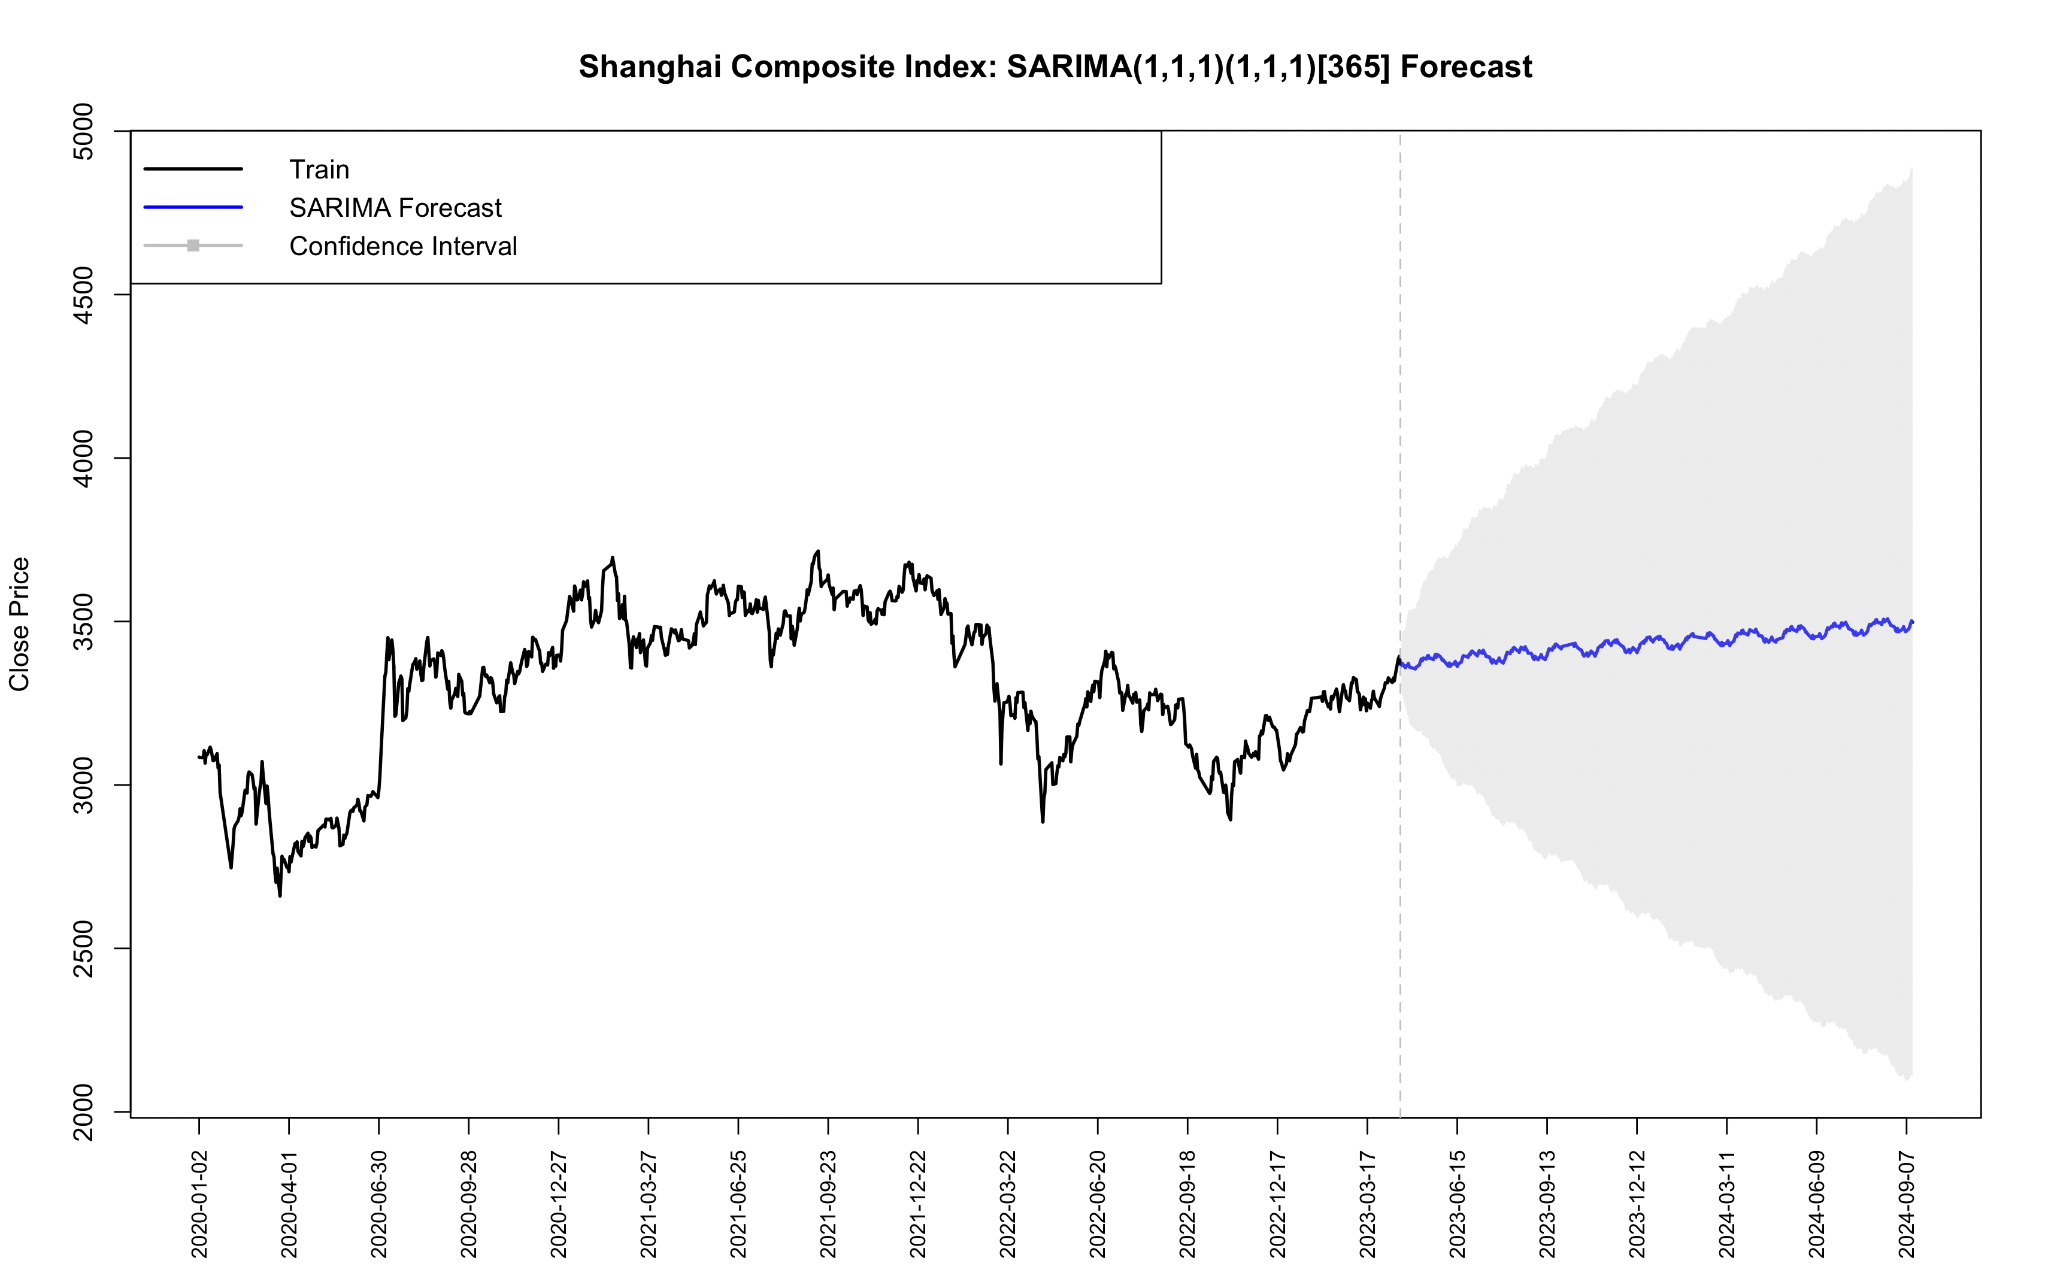
Figure 1: Shanghai Composite Index: SARIMA (1,1,1)(1,1,)(365) forecast
Below is the ARIMA (SARIMA) model forecast. The black lines from January 2020 to mid-March 2023 (before the dotted line) represent the actual historical data for the Danish OMX20 index. From 2020 to 2023, the index generally shows an upward trend, although there are some fluctuations during the period, especially in early 2020 and late 2022. Starting in mid-March 2023, the blue lines represent the SARIMA model's predictions for the future. The forecast trend indicates that the index will show a steady upward trend in the future, although the growth is more moderate, but will continue to rise later. The gray shaded area indicates a 95% confidence interval, meaning that there is a 95% chance that the actual index will fall within this range in the future. Over time, the confidence interval gradually widened, showing that the uncertainty of the forecast increased with time. Although the median forecast of the SARIMA model shows an increasing trend, the gray area indicates increased possible volatility in the future.
As can be seen from Figure 2, the confidence interval in the second half of 2023 has widened significantly, indicating that the long-term risk of the market has intensified, and the future forecast value may fluctuate within a wide range. Investors need to be aware of this possible uncertainty in the market and take potential market risks into account when making decisions.
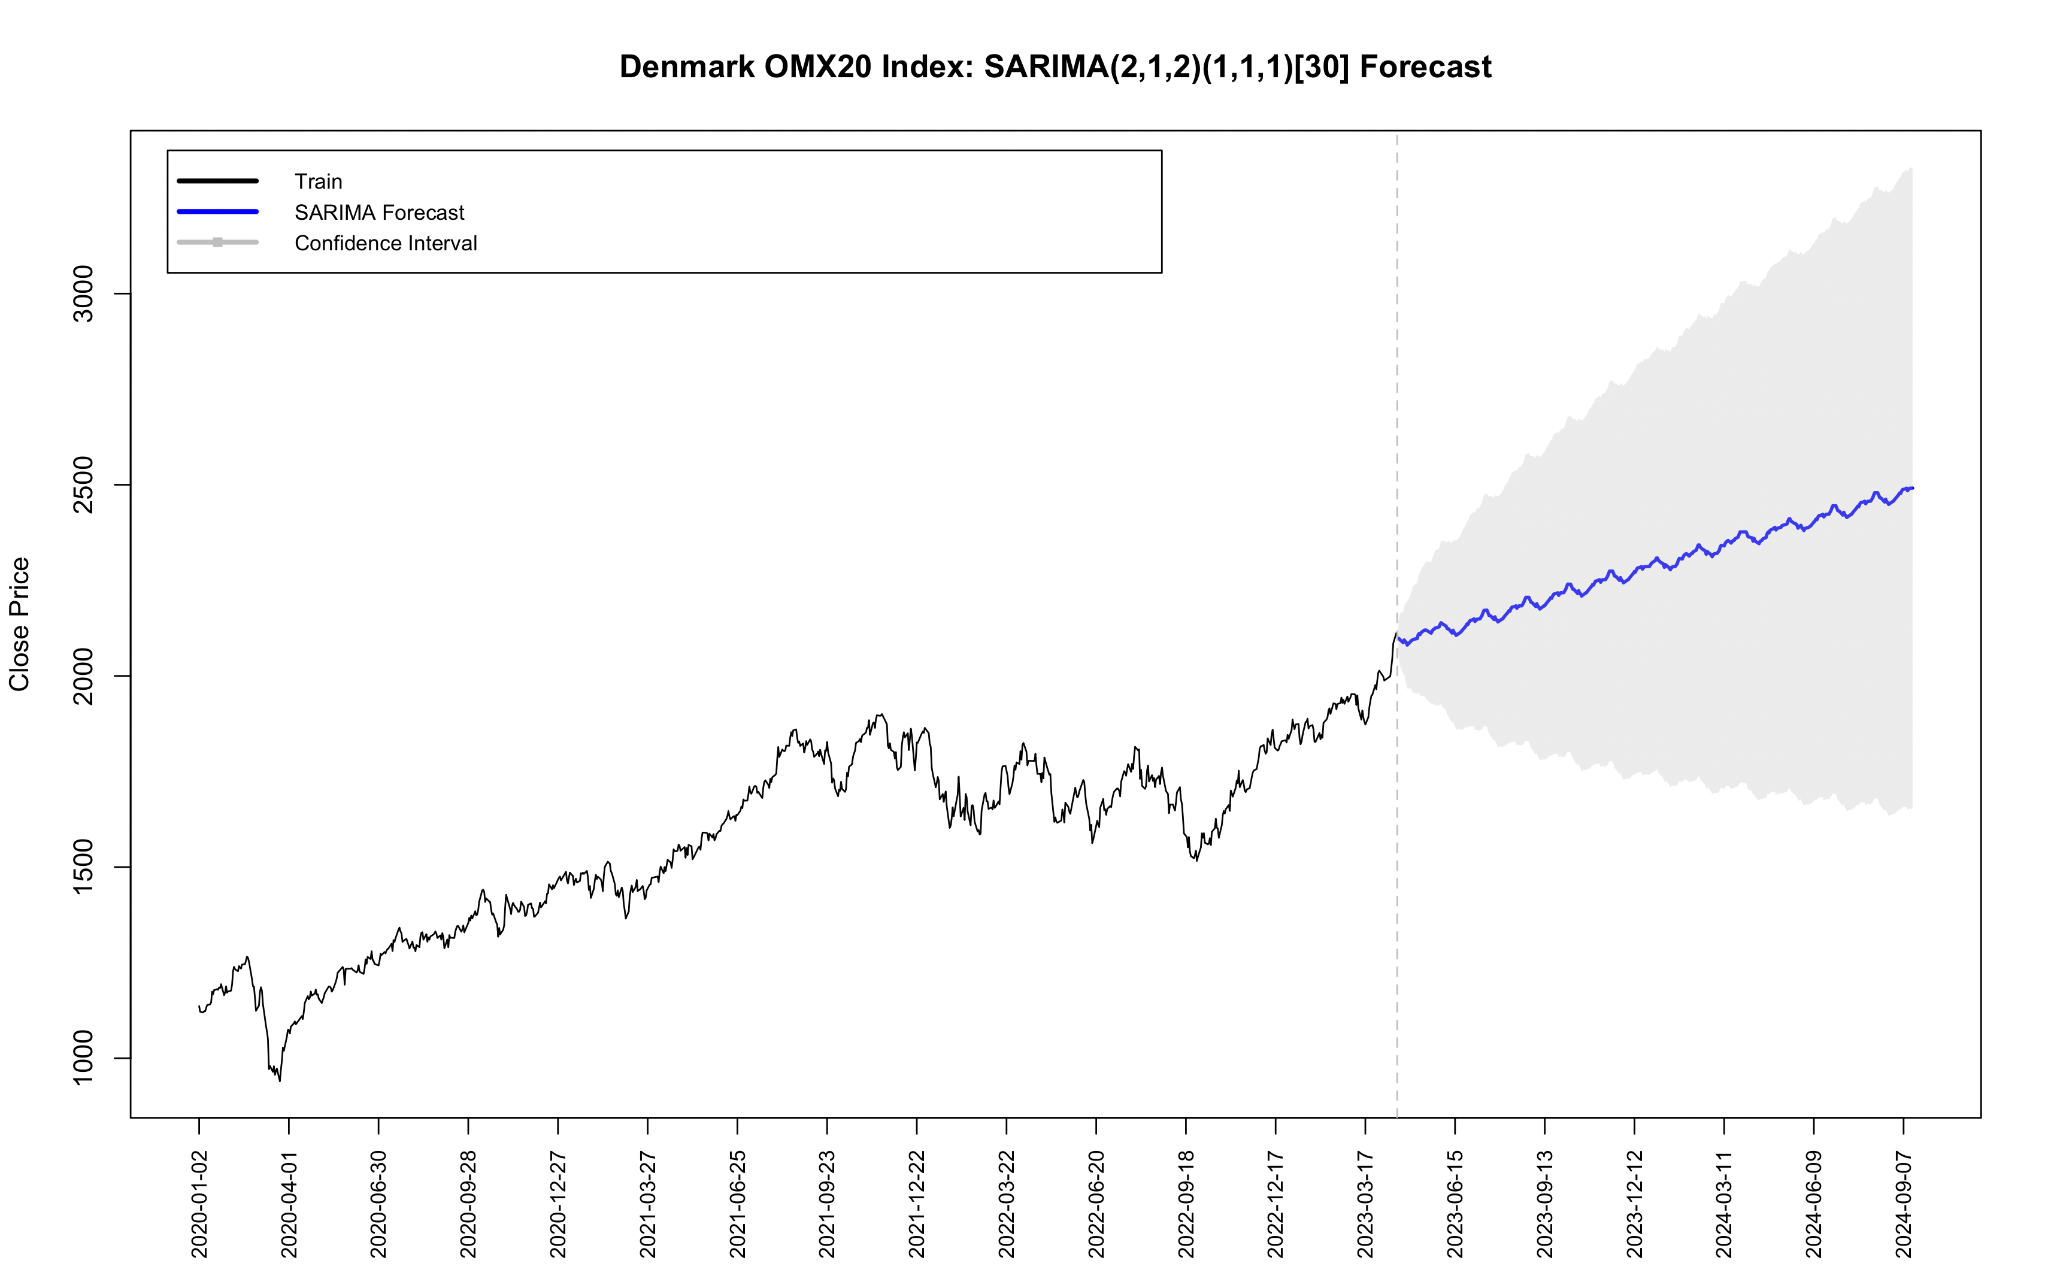
Figure 2: OMX20 Index: SARIMA (1,1,1)(1,1,)(365) forecast
4.2. ETS Model
The black lines represent the historical data (training data) of the Shanghai Composite Index. This section of data shows the actual closing price from January 2020 to March 2023. This part is used to train the prediction model which is 70% of all the data. The blue lines show the projected values starting in March 2023 and extending through September 2024. The blue line shows the model's forecast for the future closing price. The gray shaded area around the blue prediction line represents a confidence interval, usually a 95% confidence interval. This means that there is a high probability that the actual value predicted by the model will fall within this range. Over time, the confidence interval gets wider, which means that the uncertainty of the model's predictions about the future increases. Historical prices have shown significant volatility, especially after mid-2021, with multiple peaks and troughs. At the same time, the forecast data indicates that the index will continue to fluctuate in the future, but the forecast line shows relatively stable, with no clear upward or downward trend. The confidence interval widened over time, suggesting that the accuracy of the forecast became more uncertain over time. Short-term forecasts are usually more accurate, while long-term forecasts tend to have larger intervals due to the accumulation of various uncertainties (See Figure 3).
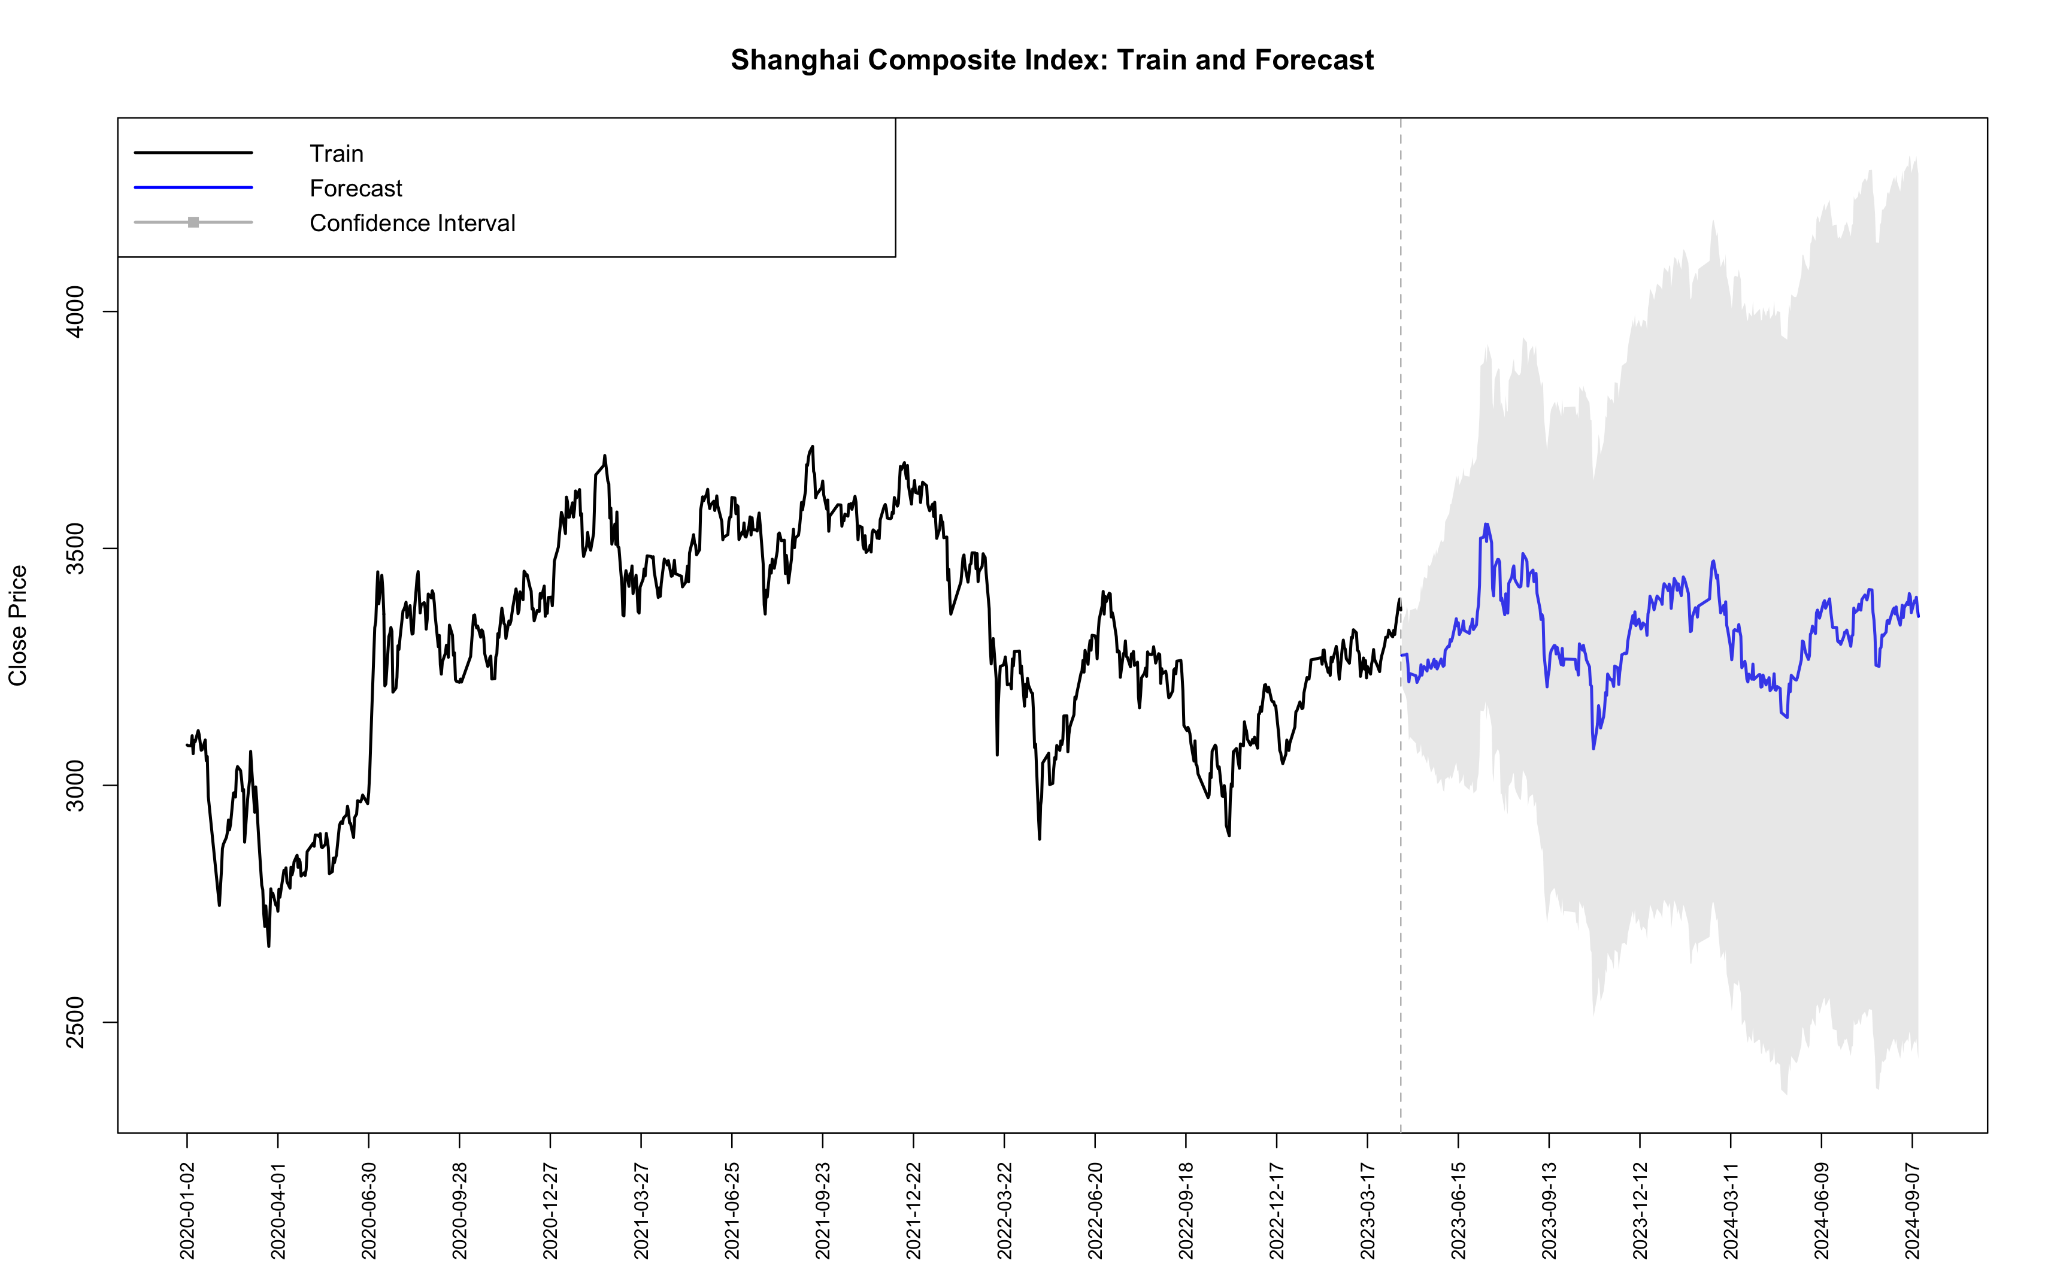
Figure 3: ETS forecast of Shanghai Composite Index
Below is the ETS model forecast for OMX20. The black line represents the historical movement of the OMX20 index from early 2020 to around March 2023, showing the actual closing price of the index. During this period, the index experienced a clear upward trend, especially in 2021, reaching a high peak in late 2022 and then falling back. The blue lines show the model's predictions for the future, from March 2023 to September 2024. From the forecast trend, the index has a slight downward trend in the short term, but the overall show a strong volatility, no obvious long-term upward or downward trend. The confidence interval widens significantly over the forecast period, reaching a maximum in 2024, which means that the model is less certain about the long-term forecast, which is a common phenomenon in financial market forecasts, because long-term market movements are affected by a variety of uncontrollable factors (See Figure 4).
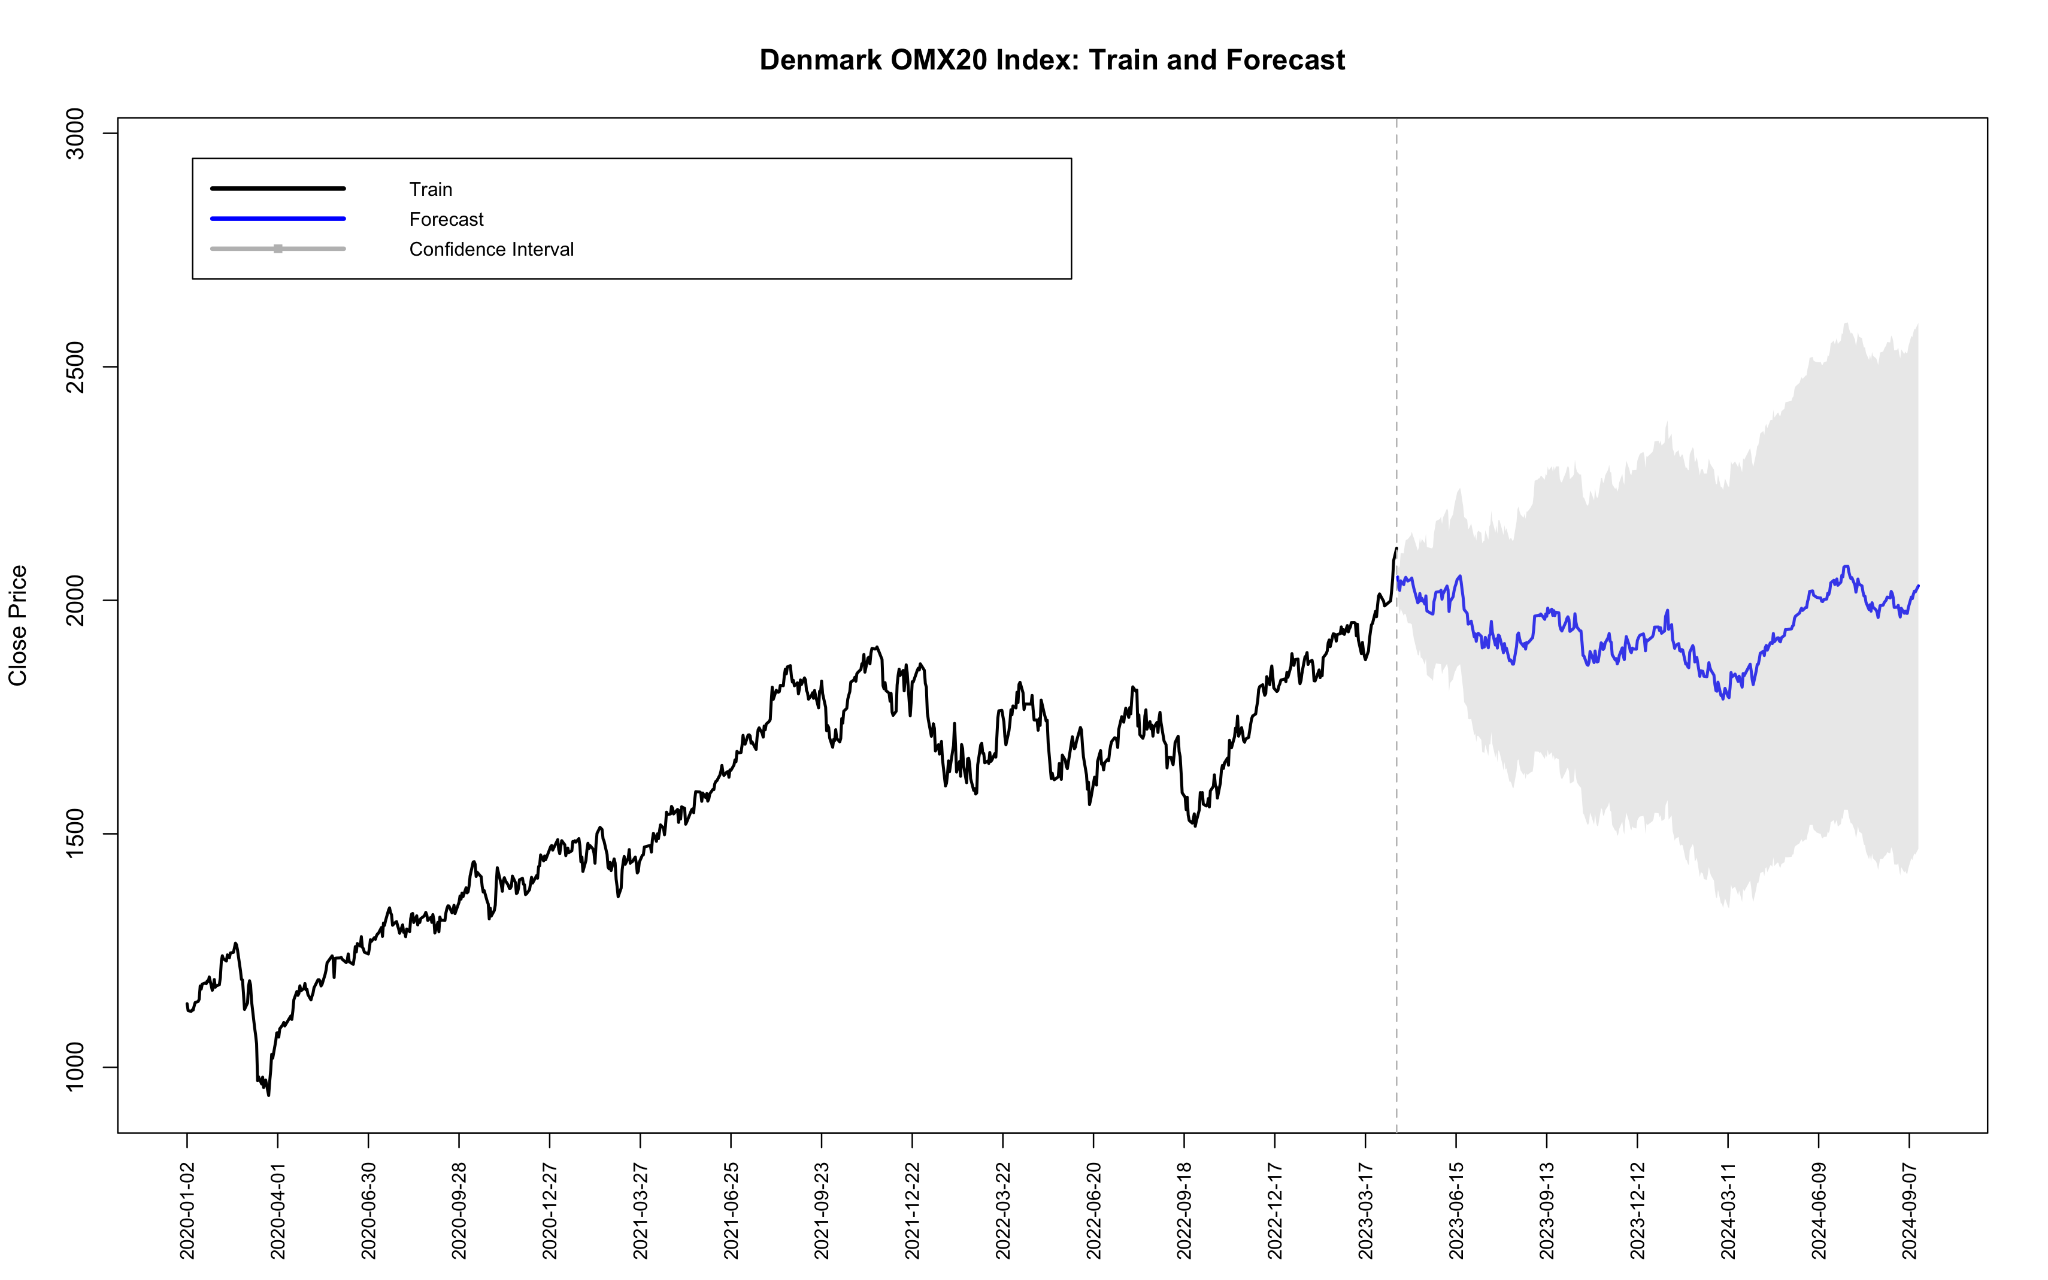
Figure 4: ETS forecast of OMX20 Index
4.3. Comparison
Table 4 shows the RMSE (root mean square error) comparison between the Shanghai Composite Index and the Danish OMX20 index under the ETS model (exponential smoothing model) and the SARIMA model (seasonal autoregressive integrated moving average model). RMSE is a common index used to measure the prediction error of a model. The smaller the value, the more accurate the model's prediction. Shanghai Composite Index: The RMSE of the ETS model is 326.8825. The RMSE for the SARIMA model is 219.4687. Danish OMX20 index: The RMSE for the ETS model is 539.6991. The RMSE for the SARIMA model is 219.9274.
Table 4: RMSE of ETS and ARIMA model for Shanghai Composite and OMX20 Index
ETS RMSE | SARIMA RMSE | |
Shanghai Composite | 326.8825 | 219.4687 |
Denmark OMX20 | 539.6991 | 219.9274 |
The smaller the RMSE, the better the model prediction. Therefore, the SARIMA model outperforms the ETS model in the prediction of both indices because the SARIMA model has a smaller RMSE value on both indices than the ETS model. Whether it is Shanghai Composite Index or Denmark OMX20 index, SARIMA model has lower prediction error, so it can be considered that SARIMA is the better choice.
5. Conclusion
In this study, the prediction ability of ARIMA and ETS for Shanghai Composite and OMX20 Index was compared and analyzed, and the prediction accuracy of ARIMA model was better than ETS model. This study offers a fresh perspective on asset price forecasting for 2024 and broadens the scope of asset price forecasting.
By concentrating on two crucial aspects, researchers can further investigate the forecasting of the OMX20 and Shanghai Composite indices in future studies because the stock indices are important to the stock index future. First, extending the analysis's time horizon can help gain a deeper knowledge of long-term trends and fluctuations by enabling a more comprehension of index movements. The second way to find the best techniques for predicting the movements of these indexes is to test out different forecasting models. Through the integration of these methodologies, scholars can get a more thorough comprehension of market dynamics, ultimately providing investors with more accurate stock index price projections.
References
[1]. Sutcliffe, C.M.S. (2006). Stock Index Futures (3rd ed.). Routledge.
[2]. Fisher, L. (1966). Some New Stock-Market Indexes. The Journal of Business, 39(1), 191–225.
[3]. Marquering, W., & Verbeek, M. (2004). The Economic Value of Predicting Stock Index Returns and Volatility. Journal of Financial and Quantitative Analysis, 39(2), 407–429.
[4]. Hosseini, M., Ahmad, Z., & Lai, Y. W. (2011). The role of macroeconomic variables on stock market index in China and India. International Journal of Economics and Finance, 3(6), 233–243.
[5]. Mailagaha Kumbure, M., Lohrmann, C., Luukka, P., & Porras, J. (2022). Machine learning techniques and data for stock market forecasting: A literature review. Expert Systems with Applications, 197, 116659.
[6]. Hsu, T. Y. (2021). Machine learning applied to stock index performance enhancement. Journal of Banking and Financial Technology, 5(1), 21–33.
[7]. Selvin, S., Vinayakumar, R., Gopalakrishnan, E. A., Menon, V. K., & Soman, K. P. (2017). Stock price prediction using LSTM, RNN and CNN-sliding window model. 2017 International Conference on Advances in Computing, Communications and Informatics (ICACCI), 1643–1647.
[8]. Yu, P., & Yan, X. (2020). Stock price prediction based on deep neural networks. Neural Computing and Applications, 32(6), 1609–1628.
[9]. Wang, J. J., Wang, J. Z., Zhang, Z. G., & Guo, S. P. (2012). Stock index forecasting based on a hybrid model. Omega, 40(6), 758-766.
[10]. Investing. Retrieved from: https://cn.investing.com/
Cite this article
Tian,W. (2025). OMX20 and Shanghai Composite Index Forecasts Based on ARIMA and ETS Models. Advances in Economics, Management and Political Sciences,144,158-166.
Data availability
The datasets used and/or analyzed during the current study will be available from the authors upon reasonable request.
Disclaimer/Publisher's Note
The statements, opinions and data contained in all publications are solely those of the individual author(s) and contributor(s) and not of EWA Publishing and/or the editor(s). EWA Publishing and/or the editor(s) disclaim responsibility for any injury to people or property resulting from any ideas, methods, instructions or products referred to in the content.
About volume
Volume title: Proceedings of ICFTBA 2024 Workshop: Finance's Role in the Just Transition
© 2024 by the author(s). Licensee EWA Publishing, Oxford, UK. This article is an open access article distributed under the terms and
conditions of the Creative Commons Attribution (CC BY) license. Authors who
publish this series agree to the following terms:
1. Authors retain copyright and grant the series right of first publication with the work simultaneously licensed under a Creative Commons
Attribution License that allows others to share the work with an acknowledgment of the work's authorship and initial publication in this
series.
2. Authors are able to enter into separate, additional contractual arrangements for the non-exclusive distribution of the series's published
version of the work (e.g., post it to an institutional repository or publish it in a book), with an acknowledgment of its initial
publication in this series.
3. Authors are permitted and encouraged to post their work online (e.g., in institutional repositories or on their website) prior to and
during the submission process, as it can lead to productive exchanges, as well as earlier and greater citation of published work (See
Open access policy for details).
References
[1]. Sutcliffe, C.M.S. (2006). Stock Index Futures (3rd ed.). Routledge.
[2]. Fisher, L. (1966). Some New Stock-Market Indexes. The Journal of Business, 39(1), 191–225.
[3]. Marquering, W., & Verbeek, M. (2004). The Economic Value of Predicting Stock Index Returns and Volatility. Journal of Financial and Quantitative Analysis, 39(2), 407–429.
[4]. Hosseini, M., Ahmad, Z., & Lai, Y. W. (2011). The role of macroeconomic variables on stock market index in China and India. International Journal of Economics and Finance, 3(6), 233–243.
[5]. Mailagaha Kumbure, M., Lohrmann, C., Luukka, P., & Porras, J. (2022). Machine learning techniques and data for stock market forecasting: A literature review. Expert Systems with Applications, 197, 116659.
[6]. Hsu, T. Y. (2021). Machine learning applied to stock index performance enhancement. Journal of Banking and Financial Technology, 5(1), 21–33.
[7]. Selvin, S., Vinayakumar, R., Gopalakrishnan, E. A., Menon, V. K., & Soman, K. P. (2017). Stock price prediction using LSTM, RNN and CNN-sliding window model. 2017 International Conference on Advances in Computing, Communications and Informatics (ICACCI), 1643–1647.
[8]. Yu, P., & Yan, X. (2020). Stock price prediction based on deep neural networks. Neural Computing and Applications, 32(6), 1609–1628.
[9]. Wang, J. J., Wang, J. Z., Zhang, Z. G., & Guo, S. P. (2012). Stock index forecasting based on a hybrid model. Omega, 40(6), 758-766.
[10]. Investing. Retrieved from: https://cn.investing.com/