1. Introduction
The air quality index is a parameter of the level of air pollution. It considers several pollutants in the air, among them PM2.5 and PM10 are the focus of this study. The complex air quality data are converted into a single positive number that usually ranges from 0 to 300. AQI is separated into different sections, which range from "Good" to "Hazardous". Long-term AQI studies in a region help us understand how polluted air might affect residents' health. Air pollution increases the risk of health problems. Particulate matter exposure often leads to respiratory symptoms and may trigger asthma or lead to premature death [1]. Chongqing, as one of the largest cities in China, has developed significant industry since the mid-20th century. The rapid growth of industry progressed particularly during World War II and the "Third Front" campaign in the 1960s, establishing it as a major center for heavy industry including manufacturing and steel production. [2] This heavy industrial legacy has been closely tied to its air pollution issues. Coal combustion and other industrial activities have contributed largely to the high levels of particulate matter in Chongqing [3]. Such high levels of air pollutants have negatively impacted the public health of Chongqing residents. Studies have shown connections between the long-term air quality issues and childhood asthma and atopic dermatitis in Chongqing [4, 5].
Many studies have employed time series models to predict the trend of air pollution levels, particularly emphasizing pollutants such as PM2.5 and PM10. The majority of studies have utilized the ARIMA family because of their strong performance in capturing linear time-dependent structures in the data. For instance, Gao et al. used ARIMA models to predict air quality in Hunan, China, and Zhang et al. applied ARIMA to forecast PM2.5 levels in Fuzhou, China [6, 7]. However, the ARIMA may be limited with nonlinear patterns and complex seasonality characteristics of air quality data. To address these challenges, hybrid models combining wavelet decomposition with ARIMA have been proposed. These models have shown better results for improvement of forecasting accuracy [8, 9]. Moreover, Ahmad et al. and Ye also developed the Prophet forecast model to handle the time series data with strong seasonal variation [10, 11]. Despite these advancements, there is still a need for comparative analyses of different models in order to determine their suitability for air pollution prediction. Therefore, this study provided a thorough comparison between ARIMA and STLF models in predicting air pollution trends.
This study explored forecasting future trends of PM2.5 and PM10 using STLF and ARIMA models. The models were trained based on daily AQI collected from 2014 to 2023. The performance was evaluated by comparing predicted trends with actual data collected in 2024. The results suggest that STLF outperformed ARIMA in both PM2.5 and PM10 prediction due to lower RMSE and MAE scores.
2. Data
The data are obtained from the Chongqing Environmental Protection Bureau for daily air quality measurements of Chongqing, China. This dataset includes data that ranges from January 2014 to September 2024, which is over 10 years of data on AQI values for air pollutants in Chongqing. An extended timeframe captures long-term trends and seasonal variations that make statistical analysis more reliable and forecasts more precise. The following Table 1 provides a brief look at the data, which offers useful insights into Chongqing's air quality trends.
Table 1: PM2.5 and PM10 general statistic
Statistic | PM2.5 AQI | PM10 AQI |
Mean | 118.04 | 60.38 |
Median | 114.00 | 57.00 |
Standard Deviation | 41.88 | 25.71 |
Min | 32.00 | 12.00 |
Max | 299.00 | 226.00 |
The summary statistics clearly indicate that PM2.5 has a higher average AQI compared to PM10, thus meaning that fine particles contribute more to poor air quality. PM2.5 also had higher variability, as the standard deviation was higher. Maximum values for both pollutants point out times of extreme pollution, with PM2.5 reaching the hazardous AQI value of 299. Overall, the city experiences poor air quality, with PM2.5 levels regularly exceeding healthy limits.
3. Method
3.1. ARIMA Model
The ARIMA model is a common method of time series analysis. It can capture temporal dependencies and patterns in data and is particularly effective for short-term predictions. In this study, ARIMA is used to forecast the AQI of PM2.5 and PM10 in Chongqing.
ARIMA consists of three key components: AutoRegressive (AR), Integrated (I), and Moving Average (MA).
AR: Measures the relation of current values and their past values.
I: Indicates the number of differences required to stationarize the series.
MA: Incorporates the error terms of past observations.
The general ARIMA model is represented as follows in Equation (1).
\( (1- {ϕ_{i}}{L^{i}})(1-L{)^{d}}{Y_{t}}=α+(1+ {θ_{j}}{L^{j}}){ϵ_{t}} \) | (1) |
Where \( {Y_{t}} \) is the value at time \( t \) , \( {ϕ_{i}} \) are the coefficients for the AR terms, \( {θ_{j}} \) are the coefficients for the MA terms, \( L \) is the lag operator , \( d \) is the differencing order to make the series stationary, \( α \) is the intercept, and \( {ϵ_{t}} \) is the error term at time \( t \) .
3.2. STLF Model
STLF (Seasonal and Trend decomposition using Loess Forecasting) decomposes time series data into trend, seasonal, and remainder components. It is suitable for most environmental series such as PM2.5 and PM10, since it brings out most of the seasonal patterns and long-term trends. It's effective in managing fluctuation over extended periods.
The STLF model separates the time series into three components:
Trend: The long-term direction of the data.
Seasonal: Recurring patterns or cycles within the data
Remainder: Residual noise following the elimination of trend and seasonality.
The final model combines these components for forecasting future values. The LOESS method is applied for seasonal adjustment. In this study, after decomposing the time series using STL, the ETS (Error, Trend, Seasonal) model was then applied to forecast future values.
The STLF formula is expressed as follows in Equation (2).
\( {Y_{t}}={T_{t}}+{S_{t}}+{R_{t}} \) | (2) |
Where \( {Y_{t}} \) is the observed value, \( {T_{t}} \) is the trend, \( {S_{t}} \) is the seasonal component, and \( {S_{t}} \) is the remainder.
4. Result
To assess the performance of ARIMA and STLF models, the forecasted values are compared with the actual AQI in 2024 in the following section.
4.1. PM2.5
The ARIMA model results for PM2.5 are summarized in Table 2 below, providing the model’s forecast accuracy and residual analysis.
Table 2: Arima Evaluation matrix on PM2.5
Set | ME | RMSE | MAE | MPE | MAPE | MASE |
Test Set | -78.55 | 85.23 | 79.25 | -97.15 | 97.56 | 4.47 |
The ARIMA model was applied to the PM2.5 data. The residuals were checked using the Ljung-Box test, yielding a p-value of 0.5941, which suggests that the residuals do not exhibit significant autocorrelation. However, the RMSE for the test set was 85.23, indicating that the model may not perform well in capturing complex seasonal patterns. Visualization of these forecasts are shown below in Figure 1.
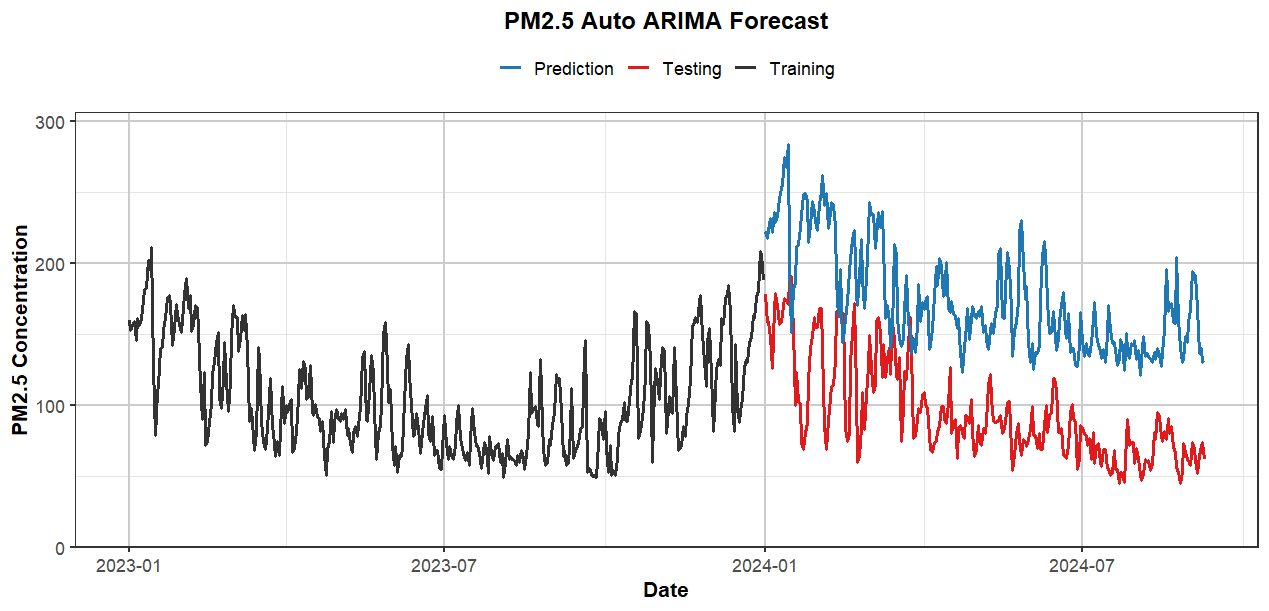
Figure 1: Arima Forecast on PM2.5
Similarly, the STLF model’s performance for PM2.5 is displayed in the following Table 3, highlighting its strengths in handling seasonal patterns.
Table 3: STLF Evaluation matrix on PM2.5
Set | ME | RMSE | MAE | MPE | MAPE | MASE |
Test Set | -53.81 | 59.20 | 54.02 | -69.33 | 69.45 | 3.04 |
The STLF model demonstrated better performance. The Ljung-Box test for the STLF residuals returned a p-value of 0.1207, indicating better handling of autocorrelations and trends. The test set RMSE was 59.20, significantly lower than that of the ARIMA model. Visualization of these forecasts are shown below in Figure 2.
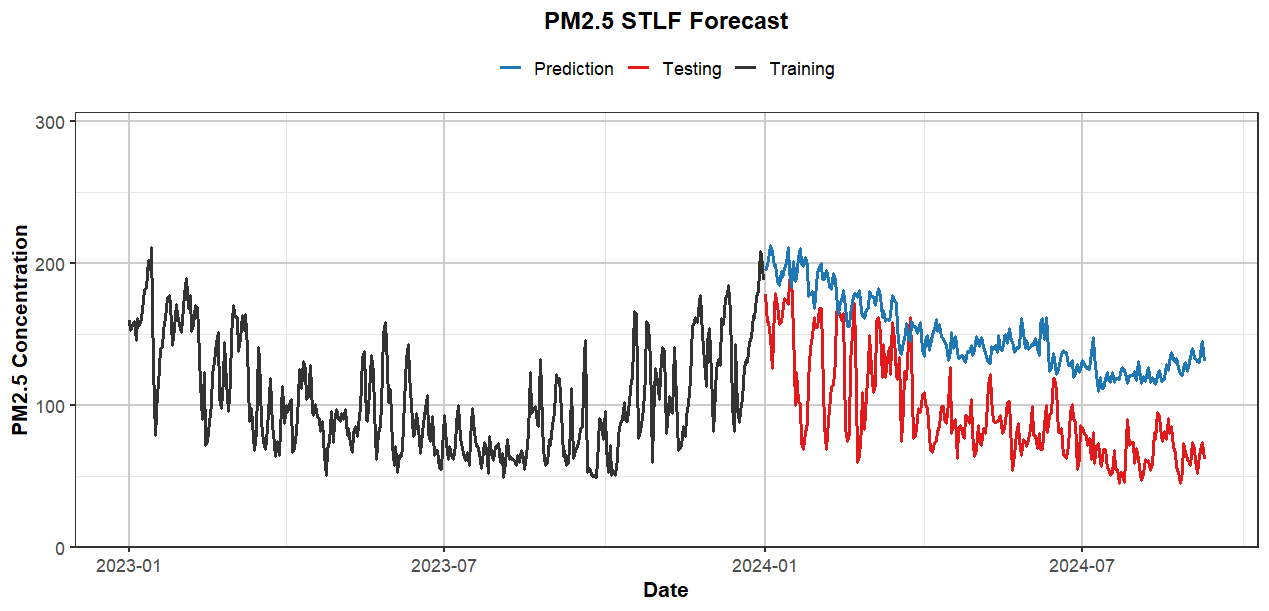
Figure 2: STLF Forecast on PM2.5
4.2. PM10
The ARIMA model’s results for PM10 are presented in Table 4 below, offering a detailed view of the model’s performance metrics.
Table 4: Arima Evaluation matrix on PM10
Set | ME | RMSE | MAE | MPE | MAPE | MASE |
Test Set | -43.60 | 47.91 | 44.44 | -117.96 | 118.77 | 3.83 |
For PM10, the ARIMA model had an RMSE of 47.91 on the test set. The Ljung-Box test showed a p-value of 0.7293, suggesting uncorrelated residuals. Although the model handles short-term predictions reasonably well, it struggles with capturing the seasonality inherent in PM10 levels. Visualization of these forecasts are shown below in Figure 3
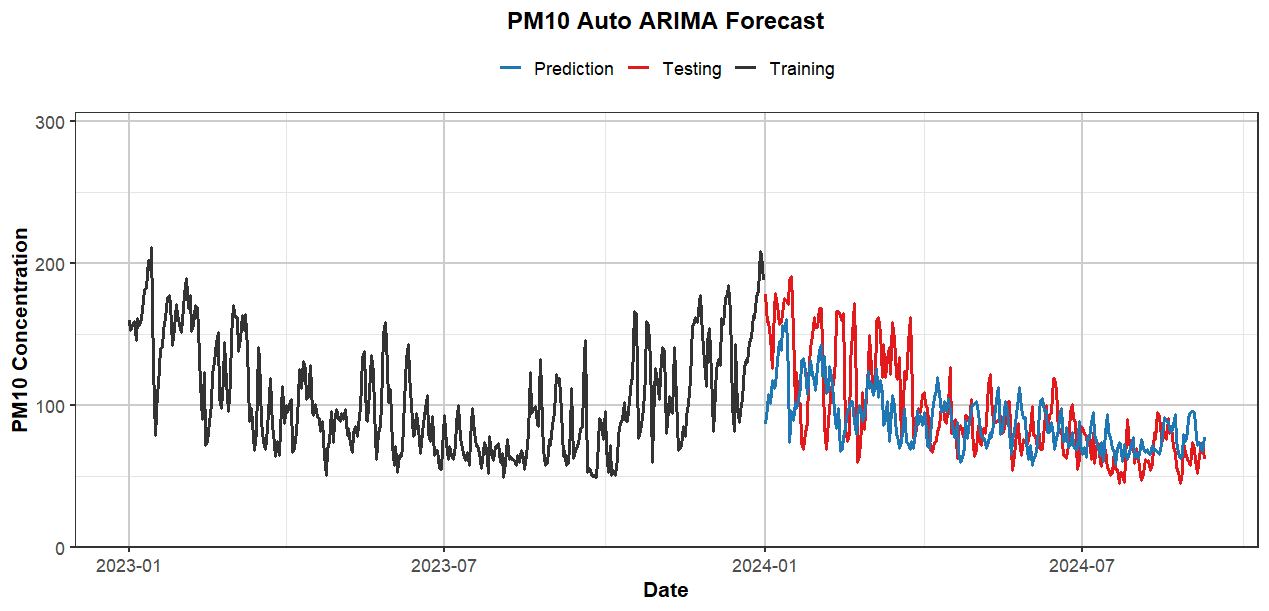
Figure 3: Arima Forecast on PM10
Finally, the STLF model’s forecast accuracy for PM10 is shown in the following Table 5, demonstrating its comparative effectiveness over the ARIMA model.
Table 5: STLF Evaluation matrix on PM10
Set | ME | RMSE | MAE | MPE | MAPE | MASE |
Test Set | -26.97 | 30.79 | 27.87 | -78.64 | 79.44 | 2.40 |
The STLF model significantly outperformed the ARIMA model, with an RMSE of 30.79 on the test set. The Ljung-Box test returned a p-value of 0.5333, indicating that the residuals are uncorrelated and that the model fits the data well. This model is particularly proficient at detecting seasonal fluctuations in PM10 data. Visualization of these forecasts are shown below in Figure 4.
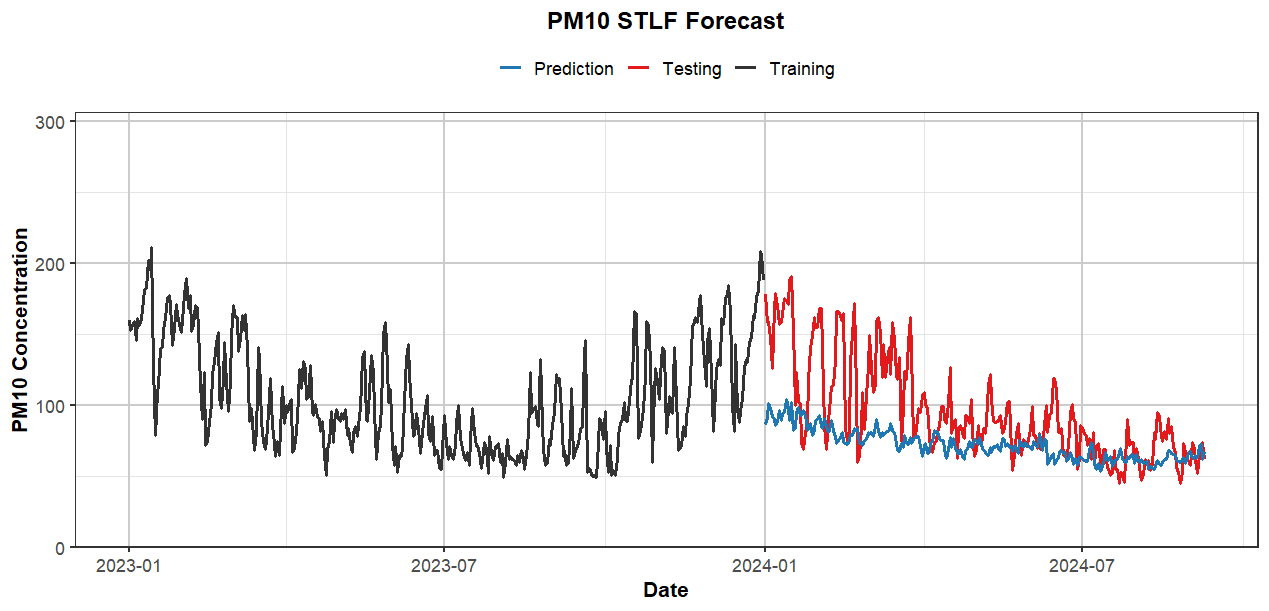
Figure 4: STLF Forecast on PM10
5. Conclusion
This study compared the performance of ARIMA and STLF models in forecasting future air quality index trends of pollutants, PM2.5 and PM10, in Chongqing, China. As previously discussed, the STLF model showed consistently lower RMSE and MAE scores for both pollutants, therefore outperforming the ARIMA model. The enhanced performance is attributed to the STLF model's capability of effectively capturing seasonal patterns and long-term trends in air pollution data. Results of the study underline the importance of appropriate model selection. Accurate forecasts of future trends in air pollutants may aid in the development of public health policies and plans in densely populated urban areas.
This research has wider implications than in Chongqing alone, as it provides information toward air quality forecasting in other urban areas with similar environmental challenges. Further studies could incorporate additional parameters such as meteorological data, industrial activities, and traffic patterns. Furthermore, in future research on air pollution forecasting, researchers could explore replacing traditional methods like ETS with advanced machine learning algorithms, including Recurrent Neural Networks and Long Short-Term Memory, after decomposing the time series using STL.
References
[1]. Sierra-Vargas, M. P., & Teran, L. M. (2012). Air pollution: impact and prevention. Respirology (Carlton, Vic.), 17(7), 1031–1038.
[2]. Hong, L. (2004). Chongqing: Opportunities and risks. The China Quarterly, 178, 448–466.
[3]. Chen, Y., Xie, S.-d., Luo, B., & Zhai, C.-z. (2017). Particulate pollution in urban Chongqing of southwest China: Historical trends of variation, chemical characteristics and source apportionment. Science of The Total Environment, 584–585, 523–534.
[4]. Ding, L., Zhu, D., Peng, D., & Zhao, Y. (2017). Air pollution and asthma attacks in children: A case-crossover analysis in the city of Chongqing, China. Environmental pollution (Barking, Essex: 1987), 220(Pt A), 348–353.
[5]. Luo, P., Wang, D., Luo, J., Li, S., Li, M.-m., Chen, H., Duan, Y., Fan, J., Cheng, Z., Zhao, M.-m., Liu, X., Wang, H., Luo, X.-y., & Zhou, L. (2022). Relationship between air pollution and childhood atopic dermatitis in Chongqing, China: A time-series analysis. Frontiers in Public Health, 10, 990464.
[6]. Gao, W., Xiao, T., Zou, L., Li, H., & Gu, S. (2024). Analysis and prediction of atmospheric environmental quality based on the autoregressive integrated moving average model (ARIMA model) in Hunan Province, China. Sustainability, 16(19), 8471.
[7]. Zhang, L., Lin, J., Qiu, R., Hu, X., Zhang, H., Chen, Q., Tan, H., Lin, D., & Wang, J. (2018). Trend analysis and forecast of PM2.5 in Fuzhou, China using the ARIMA model. Ecological Indicators, 95(Part 1), 702–710.
[8]. Zhang, H., Zhang, S., Wang, P., Qin, Y., & Wang, H. (2017). Forecasting of particulate matter time series using wavelet analysis and wavelet-ARMA/ARIMA model in Taiyuan, China. Journal of the Air & Waste Management Association, 67(7), 776–788.
[9]. Kaur, J., Singh, S., & Parmar, K. S. (2023). Forecasting of AQI (PM2.5) for the three most polluted cities in India during COVID-19 by hybrid Daubechies discrete wavelet decomposition and autoregressive (Db-DWD-ARIMA) model. Environmental Science and Pollution Research, 30(45), 101035–101052.
[10]. Ahmad, H., Yehua, S., Hashmi, M. Z., Bhatti, U. A., Hussain, A., Hameed, M., Marjan, S., Bazai, S. U., Hossain, M. A., Sahabuddin, M., Wagan, R. A., & Zha, Y. (2022). Time series analysis and forecasting of air pollutants based on Prophet forecasting model in Jiangsu Province, China. Frontiers in Environmental Science, 10, Article 945628.
[11]. Ye, Z. (2019). Air pollutants prediction in Shenzhen based on ARIMA and Prophet method. E3S Web of Conferences, 136, 05001.
Cite this article
Liu,Z. (2025). Forecasting Air Pollution in Chongqing Using Time Series Models: A Comparative Analysis of ARIMA and STLF. Advances in Economics, Management and Political Sciences,147,170-176.
Data availability
The datasets used and/or analyzed during the current study will be available from the authors upon reasonable request.
Disclaimer/Publisher's Note
The statements, opinions and data contained in all publications are solely those of the individual author(s) and contributor(s) and not of EWA Publishing and/or the editor(s). EWA Publishing and/or the editor(s) disclaim responsibility for any injury to people or property resulting from any ideas, methods, instructions or products referred to in the content.
About volume
Volume title: Proceedings of ICFTBA 2024 Workshop: Finance's Role in the Just Transition
© 2024 by the author(s). Licensee EWA Publishing, Oxford, UK. This article is an open access article distributed under the terms and
conditions of the Creative Commons Attribution (CC BY) license. Authors who
publish this series agree to the following terms:
1. Authors retain copyright and grant the series right of first publication with the work simultaneously licensed under a Creative Commons
Attribution License that allows others to share the work with an acknowledgment of the work's authorship and initial publication in this
series.
2. Authors are able to enter into separate, additional contractual arrangements for the non-exclusive distribution of the series's published
version of the work (e.g., post it to an institutional repository or publish it in a book), with an acknowledgment of its initial
publication in this series.
3. Authors are permitted and encouraged to post their work online (e.g., in institutional repositories or on their website) prior to and
during the submission process, as it can lead to productive exchanges, as well as earlier and greater citation of published work (See
Open access policy for details).
References
[1]. Sierra-Vargas, M. P., & Teran, L. M. (2012). Air pollution: impact and prevention. Respirology (Carlton, Vic.), 17(7), 1031–1038.
[2]. Hong, L. (2004). Chongqing: Opportunities and risks. The China Quarterly, 178, 448–466.
[3]. Chen, Y., Xie, S.-d., Luo, B., & Zhai, C.-z. (2017). Particulate pollution in urban Chongqing of southwest China: Historical trends of variation, chemical characteristics and source apportionment. Science of The Total Environment, 584–585, 523–534.
[4]. Ding, L., Zhu, D., Peng, D., & Zhao, Y. (2017). Air pollution and asthma attacks in children: A case-crossover analysis in the city of Chongqing, China. Environmental pollution (Barking, Essex: 1987), 220(Pt A), 348–353.
[5]. Luo, P., Wang, D., Luo, J., Li, S., Li, M.-m., Chen, H., Duan, Y., Fan, J., Cheng, Z., Zhao, M.-m., Liu, X., Wang, H., Luo, X.-y., & Zhou, L. (2022). Relationship between air pollution and childhood atopic dermatitis in Chongqing, China: A time-series analysis. Frontiers in Public Health, 10, 990464.
[6]. Gao, W., Xiao, T., Zou, L., Li, H., & Gu, S. (2024). Analysis and prediction of atmospheric environmental quality based on the autoregressive integrated moving average model (ARIMA model) in Hunan Province, China. Sustainability, 16(19), 8471.
[7]. Zhang, L., Lin, J., Qiu, R., Hu, X., Zhang, H., Chen, Q., Tan, H., Lin, D., & Wang, J. (2018). Trend analysis and forecast of PM2.5 in Fuzhou, China using the ARIMA model. Ecological Indicators, 95(Part 1), 702–710.
[8]. Zhang, H., Zhang, S., Wang, P., Qin, Y., & Wang, H. (2017). Forecasting of particulate matter time series using wavelet analysis and wavelet-ARMA/ARIMA model in Taiyuan, China. Journal of the Air & Waste Management Association, 67(7), 776–788.
[9]. Kaur, J., Singh, S., & Parmar, K. S. (2023). Forecasting of AQI (PM2.5) for the three most polluted cities in India during COVID-19 by hybrid Daubechies discrete wavelet decomposition and autoregressive (Db-DWD-ARIMA) model. Environmental Science and Pollution Research, 30(45), 101035–101052.
[10]. Ahmad, H., Yehua, S., Hashmi, M. Z., Bhatti, U. A., Hussain, A., Hameed, M., Marjan, S., Bazai, S. U., Hossain, M. A., Sahabuddin, M., Wagan, R. A., & Zha, Y. (2022). Time series analysis and forecasting of air pollutants based on Prophet forecasting model in Jiangsu Province, China. Frontiers in Environmental Science, 10, Article 945628.
[11]. Ye, Z. (2019). Air pollutants prediction in Shenzhen based on ARIMA and Prophet method. E3S Web of Conferences, 136, 05001.


