


1. Introduction
In recent years, several researchers have contributed to the fields of valuation and investment analysis. Some scholars have shown interest in the analysis and application of the Sum-of-the-Parts (SOTP) approach [1]. Other researchers expanded the Fama and French model to explore the sensitivity of excess returns of European financial institutions to changes in selected risk factors [2]. Kim, Y., Kuehn, L.-A., and Li, K. systematically estimated investment-based asset pricing models, analyzing the relationship between discount rates and companies' perceived risk exposure, as well as the implications for valuation and investment ratios [3]. Clark, Jones, and Malmquist explored the relationship between leverage (the asset-to-equity ratio) and the weighted average cost of capital in their study of abnormal returns in U.S. bank holding companies [4]. However, research in the field of investment analysis remains quite limited.
This study evaluates HSBC's operational management and investment strategy over the past three years by analyzing financial statements and ratios. It includes two sections: the first assesses HSBC's financial health through key ratios and trend analysis, while the second, which serves as the core of this study, evaluates HSBC’s risks and returns. This includes summary statistics, risk characteristic analysis, the establishment of the F-F three-factor model, and the application of the Monte Carlo model.
To visualize the relevant data in this article and conduct an in-depth analysis, qualitative and quantitative analyses will serve as the primary analytical methods. This approach will facilitate a more straightforward examination of HSBC's development from 2021 to 2024.
An excellent bank must not only adapt to the unpredictable financial market but also maintain its competitive edge and value-adding potential. Therefore, as a global financial institution that leads in wealth management, commercial, and retail banking, HSBC's practices in business strategy and risk management offer valuable insights for other financial institutions to learn from and guide their efforts.
2. Research methods
This study primarily relies on data from Yahoo Finance to compute various financial metrics, earnings, and risks related to financial statements. Additional data is sourced from the Kenneth R. French Data Library to establish the Fama and French three-factor model. In financial analysis, metrics for assessing HSBC's financial health are strictly calculated according to established formulas. In the quantitative analysis part, historical price data for HSBC is downloaded from Yahoo Finance for further examination. Initially, analytical tools are used to visually compare yields between HSBC and its international competitors based on cumulative product calculations. Subsequently, descriptive statistical analysis is applied to HSBC and its competitors. Daily data from the Kenneth R. French Data Library is utilized to build the relevant Fama and French three-factor model. Incorporating market risk, book-to-market, and size factors provides a more comprehensive explanation of asset returns than the Capital Asset Pricing Model (CAPM) alone. This approach better addresses market anomalies and provides more accurate portfolio performance evaluations. The formula given below is:
\( {R_{i}}-{R_{f}}=α+{β_{1}}({R_{m}}-{R_{f}})+{β_{2}}*SMB+{β_{3}}*HML+{ϵ_{i}} \) (1)
Where ( \( {R_{m}} -{R_{f}} \) ) is the market risk premium, \( SMB \) represents the size factors, and HML is the book-to-market factors. The coefficients \( {β_{1}} \) , \( {β_{2}} \) and \( {β_{3}} \) correspond to market risk premium, SMB and HML, respectively.
Finally, the study employs a Monte Carlo model for forecasting and sensitivity analysis of HSBC. This model is based on random sampling and probability distribution, as represented by the following formula:
\( {S_{T}}={S_{0}}*{e^{(μ-{σ^{2}}/2)*T+σ*√T*ϵ}} \) (2)
Where \( μ \) is the simple expected return per annum, \( σ \) is the volatility or annualised standard deviation of the asset. And \( ϵ \) is a standard normal random value (mean of 0 and variance of 1).
3. The Analysis of Financial Health
Financial health analysis serves as a critical tool to assess whether a company's operational decisions are sound. It evaluates aspects such as the potential for sustained profitability and stable growth, the effectiveness of senior management's strategic decisions, and the company’s capability to handle challenges from both internal and external environments. According to the research Olayinka, financial statement analysis (FSA) can aid investors, creditors, and various stakeholders in identifying essential data necessary for making informed decisions regarding funding, credit facilities, or other investments in a specific company [5]. Delen, Kuzey, and Uyar mention that the use of financial ratios to assess company performance has long been a traditional and powerful tool for decision-makers. They do not merely rely on the figures presented in financial statements; rather, they analyze the significance of these financial ratios [6]. Based on the financial ratios from 30 June 2021 to 30 June 2024, HSBC has demonstrated excellent financial health over the past three years.
3.1. Profitability Ratios
The operating profit margin has shown steady growth over the past three years, rising from 32.56% to 52.83%. The EBIT margin has displayed a rapid growth trend, increasing from 51.53% to 116.44%. The net profit margin mirrors the operating profit margin's trend, climbing from 31.89% to 45.61%. It can be inferred that HSBC's profitability has improved and that capital efficiency has increased over the past three years.
3.2. Liquidity Ratios
From 2021 to 2024, the cash ratio remained elevated but declined from 212.56% to 185.45%. This indicates a reduction in cash reserves or a decreased demand for liquidity.
3.3. Leverage Ratios
The debt-equity ratios have remained stable in recent years, fluctuating between approximately 13.65 and 14.75. Debt-to-capital ratios consistently exceeded 90% during this period, indicating a high leverage level. This suggests that the company relies heavily on debt financing, which is typical in the banking sector.
3.4. Dupont Identity
The net profit margin, asset turnover, and equity multiplier maintained a steady low growth rate from 2021 to 2024. Multiplying these factors yields the return on equity (ROE), which significantly increased from 4.87% to 10.02% over these three years. This shows that the company efficiently utilized shareholder equity to generate profits.
4. Data Analysis Results
Table 1: Summary statistics for HSBC and its competitors
Annualized ret | Annualized vol | Sharp ratio | Skewness | Kurtosis | Hist VaR | Hist CVar | VaR_normal | Max drawdown | |
Bank of America Corporation | 0.093353 | 0.477472 | 0.353403 | 0.304232 | 1.668180 | 0.027722 | 0.036202 | 0.028004 | -0.4664 |
Citigroup Inc. | -0.007182 | 0.482111 | 0.153598 | 0.690715 | 5.696080 | 0.026276 | 0.035468 | 0.028401 | -0.4295 |
HSBC Holdings plc | 1.254476 | 0.431160 | 2.023836 | -0.480494 | 3.903838 | 0.023105 | 0.037553 | 0.024350 | -0.1894 |
JPMorgan Chase & Co. | 0.487800 | 0.417740 | 1.078716 | -0.099261 | 2.670553 | 0.024540 | 0.035208 | 0.024102 | -0.3877 |
Lloyds Banking Group plc | 0.585050 | 0.468399 | 1.145904 | -0.329230 | 4.251100 | 0.024852 | 0.039684 | 0.026990 | -0.2565 |
NatWest Group plc | 0.939727 | 0.522960 | 1.465554 | -0.581047 | 4.659228 | 0.026186 | 0.046201 | 0.029922 | -0.3951 |
4.1. Summary Statistic Analysis
This summary statistics table provides performance indicators for six banks, including HSBC, over the past three years. Table 1 reflects that HSBC leads with an annualized return of 1.254476, significantly outpacing its competitors. Conversely, Citigroup Inc. ranks last with an annualized return of -0.007182, indicating a negative return over the past three years and poor performance. In terms of annualized volatility, NatWest Group plc ranks first at 0.522960, demonstrating high stock volatility and risk, while JPMorgan has the lowest annualized volatility at 0.417740, indicating lower stock volatility and minimal risk. Notably, HSBC's annualized volatility, at 0.431160, is slightly higher than JPMorgan's, leading to relatively low volatility. Moreover, HSBC boasts the highest Sharpe ratio at 2.023836, whereas Citigroup Inc. has the lowest Sharpe ratio at 0.153598, indicating that HSBC achieves the highest excess return per unit of risk, while Citigroup Inc. fails to yield substantial excess returns. Furthermore, Citigroup Inc. displays the greatest positive skewness at 0.690715, suggesting a greater likelihood of higher returns. In contrast, NatWest Group plc exhibits the largest negative skewness at -0.581047, indicating a significant risk of negative returns. Lastly, Citigroup Inc. has the highest kurtosis at 5.696080, reflecting extreme fluctuations and a greater probability of extreme returns compared to its competitors, while Bank of America Corporation shows the lowest kurtosis at 1.668180, suggesting more stable returns and a lower likelihood of extreme events.
4.2. Risk analysis
The summary statistical analysis indicates that HSBC's VaR and CVaR values are nearly among the lowest compared to competitors, measuring 0.023667 and 0.037938, respectively. The VaR value implies that within a 95% confidence interval, HSBC faces relatively minor potential losses. The CVaR further suggests that its average loss under extreme conditions remains low. Notably, the VaR value of 0.024533, which ranks among the lowest in comparison to competitors, also highlights HSBC's reduced exposure to extreme risks.
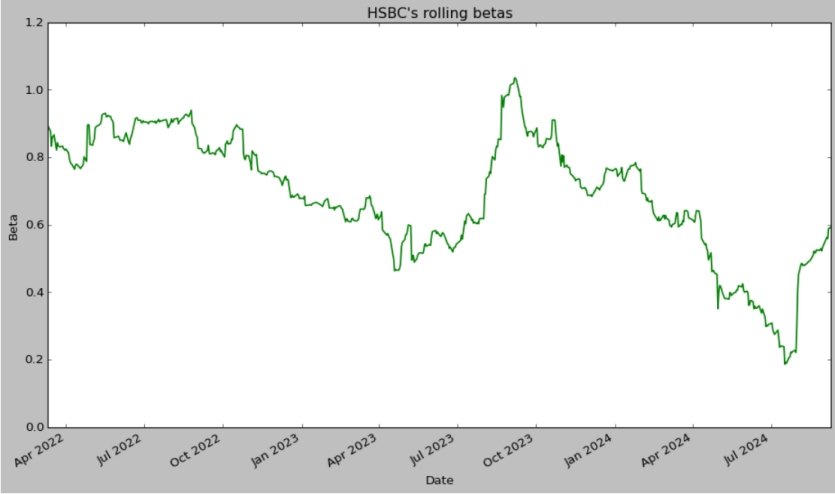
Figure 1: The rolling betas of HSBC over the past three years with windows equals126 days
In the rolling beta analysis, a 126-day (six-month) window was chosen to assess HSBC's beta variations over the three-year period. This duration was segmented into four intervals to evaluate beta volatility and correlate it with total return rates. Specifically, Period 1 ran from March 11, 2022, to April 11, 2023, with a standard deviation of 10%. Period 2 lasted from April 12, 2023, to September 20, 2023, exhibiting a standard deviation of 17%. Period 3 spanned from September 21, 2023, to July 8, 2024, also showing a standard deviation of 17%. Finally, Period 4 extended from July 9, 2024, to September 9, 2024, with a standard deviation of 14%. These findings suggest that HSBC typically exhibits lower volatility than the broader market over the past three years, except for a brief period during the transition from Period 2 to Period 3.
4.3. Fama-French Three-factor Model
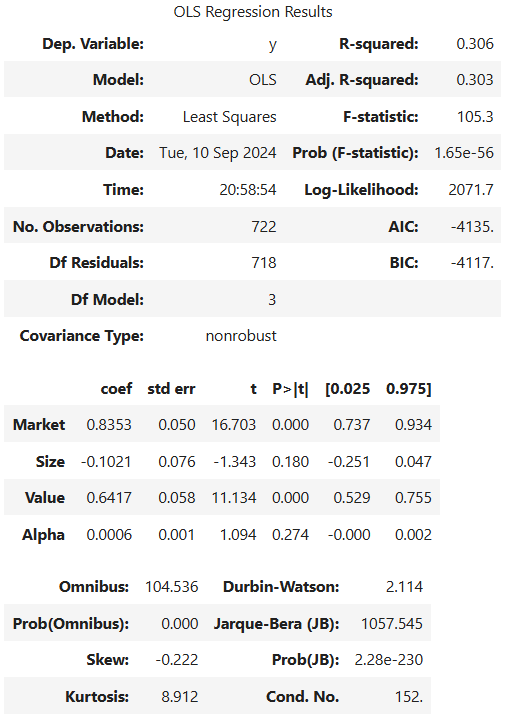
Figure 2: The result of Fama and French three factors model
The results indicate that the company exhibits a negative loading on the size factor and a positive loading on the value factor for the period from July 26, 2021, to July 26, 2024. This suggests that the company has invested in large-cap and value stocks. The factor benchmark portfolio comprises 84c in the market, 18c in the Treasury bills, short 10c on small stocks, long 10c on large stocks, long 64c on value stocks, and short 64c on growth stocks. Alpha of 6 basis points per day is economically large but statistical significance is weak.
4.4. Forecast and Sensitivity Analysis
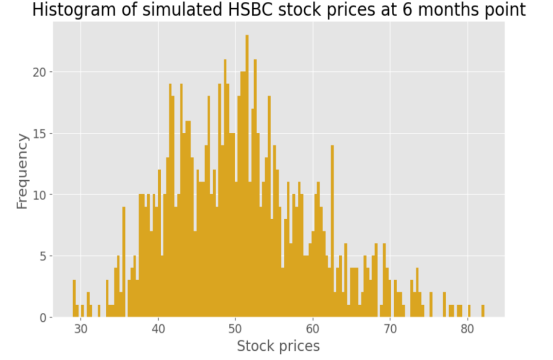
Figure 3: Histogram of simulated HSBC stock prices at a 6-month time span.
This diagram illustrates the simulated distribution of HSBC's stock price six months into the future. The simulation runs for 1,000 iterations, starting with an initial stock price of $43.09 on September 10. The mean is $0.32, and the volatility is $0.26, over 252 trading days. The results display a slightly positively skewed normal distribution, suggesting a small likelihood of extreme high values. The stock price mainly clusters between $40 and $56, with maximum and minimum values at $30 and $80, respectively, indicating considerable volatility, albeit with low frequency.
5. Conclusion
To understand HSBC's competitiveness and growth potential in the industry, this paper conducts financial health and investment analysis of HSBC. In the financial health section, HSBC’s financial statements are reviewed, summarizing the bank’s performance over the past three years. Remarkably, HSBC maintains a robust solvency ratio despite its high leverage, indicating exceptional capital efficiency. Additionally, HSBC exhibits a lower standard deviation and the highest Sharpe ratio among its competitors, indicating excellent excess return metrics. This reflects HSBC's strong risk control and stable return capabilities. Investors with lower risk tolerance seeking stable returns may consider purchasing shares. Furthermore, the Fama-French three-factor model and Monte Carlo simulations were employed to analyze the drivers of stock returns and make price forecasts. The findings indicate that HSBC's stock returns primarily stem from market and value factors, resulting in attractive excess returns. Optimistically, it is projected that HSBC’s stock price may trend upward over the next year, concentrating between $40 to $56 per share. However, the stock's volatility will likely increase over time, presenting investors with an asset that carries both risk and potential return, and investors need to implement risk management measures to address potential extreme situations.
Nonetheless, a limitation exists in Monte Carlo simulations. The random numbers that computers generate often behave as pseudo-random. Furthermore, the varying sizes of data sets complicate achieving expected values in simulation outcomes. Thus, employing variance reduction methods or utilizing machine learning techniques for forecasting might yield better results.
References
[1]. Chlomou, G., & Demirakos, E. (2020). How do financial analysts implement the Sum-of-the-Parts (SOTP) valuation framework? International Review of Financial Analysis, 70, 101514. https://doi.org/10.1016/j.irfa.2020.101514
[2]. Jareño, F., González, M. de la O., & Escolástico, A. M. (2020). Extension of the Fama and French model: A study of the largest European financial institutions. International Economics, 164, 115–139. https://doi.org/10.1016/j.inteco.2020.09.001
[3]. Kim, Y., Kuehn, L.-A., & Li, K. (2024). Learning about the consumption risk exposure of firms. Journal of Financial Economics, 152, 103759–103759. https://doi.org/10.1016/j.jfineco.2023.103759
[4]. Clark, B., Jones, J., & Malmquist, D. (2023). Leverage and the cost of capital for U.S. banks. Journal of Banking & Finance, 155, 107002–107002. https://doi.org/10.1016/j.jbankfin.2023.107002
[5]. Olayinka, A. A. (2022). Financial Statement Analysis as a Tool for Investment Decisions and Assessment of Companies’ Performance. International Journal of Financial, Accounting, and Management, 4(1), 49–66. https://doi.org/10.35912/ijfam.v4i1.852
[6]. Delen, D., Kuzey, C., & Uyar, A. (2013). Measuring firm performance using financial ratios: A decision tree approach. Expert Systems with Applications, 40(10), 3970–3983. https://doi.org/10.1016/j.eswa.2013.01.012
Cite this article
Xu,Y. (2025). Empirical Analysis of HSBC: A Comprehensive Evaluation from Investment Perspective Using Historical Data from 2021 to 2024. Advances in Economics, Management and Political Sciences,149,32-37.
Data availability
The datasets used and/or analyzed during the current study will be available from the authors upon reasonable request.
Disclaimer/Publisher's Note
The statements, opinions and data contained in all publications are solely those of the individual author(s) and contributor(s) and not of EWA Publishing and/or the editor(s). EWA Publishing and/or the editor(s) disclaim responsibility for any injury to people or property resulting from any ideas, methods, instructions or products referred to in the content.
About volume
Volume title: Proceedings of the 3rd International Conference on Financial Technology and Business Analysis
© 2024 by the author(s). Licensee EWA Publishing, Oxford, UK. This article is an open access article distributed under the terms and
conditions of the Creative Commons Attribution (CC BY) license. Authors who
publish this series agree to the following terms:
1. Authors retain copyright and grant the series right of first publication with the work simultaneously licensed under a Creative Commons
Attribution License that allows others to share the work with an acknowledgment of the work's authorship and initial publication in this
series.
2. Authors are able to enter into separate, additional contractual arrangements for the non-exclusive distribution of the series's published
version of the work (e.g., post it to an institutional repository or publish it in a book), with an acknowledgment of its initial
publication in this series.
3. Authors are permitted and encouraged to post their work online (e.g., in institutional repositories or on their website) prior to and
during the submission process, as it can lead to productive exchanges, as well as earlier and greater citation of published work (See
Open access policy for details).
References
[1]. Chlomou, G., & Demirakos, E. (2020). How do financial analysts implement the Sum-of-the-Parts (SOTP) valuation framework? International Review of Financial Analysis, 70, 101514. https://doi.org/10.1016/j.irfa.2020.101514
[2]. Jareño, F., González, M. de la O., & Escolástico, A. M. (2020). Extension of the Fama and French model: A study of the largest European financial institutions. International Economics, 164, 115–139. https://doi.org/10.1016/j.inteco.2020.09.001
[3]. Kim, Y., Kuehn, L.-A., & Li, K. (2024). Learning about the consumption risk exposure of firms. Journal of Financial Economics, 152, 103759–103759. https://doi.org/10.1016/j.jfineco.2023.103759
[4]. Clark, B., Jones, J., & Malmquist, D. (2023). Leverage and the cost of capital for U.S. banks. Journal of Banking & Finance, 155, 107002–107002. https://doi.org/10.1016/j.jbankfin.2023.107002
[5]. Olayinka, A. A. (2022). Financial Statement Analysis as a Tool for Investment Decisions and Assessment of Companies’ Performance. International Journal of Financial, Accounting, and Management, 4(1), 49–66. https://doi.org/10.35912/ijfam.v4i1.852
[6]. Delen, D., Kuzey, C., & Uyar, A. (2013). Measuring firm performance using financial ratios: A decision tree approach. Expert Systems with Applications, 40(10), 3970–3983. https://doi.org/10.1016/j.eswa.2013.01.012