


1. Introduction
Pairs trading is a market-neutral strategy that involves betting on the convergence of price paths of two assets that have historically shown a stable relationship. The approach hinges on mean reversion theory, assuming that the price ratio between two related assets will revert to its equilibrium level over time. Traditional pairs trading strategies use cointegration tests to identify pairs of assets with a long-term equilibrium relationship, allowing traders to exploit temporary price deviations by going long on one asset and short on the other [1]. This strategy relies heavily on calculating and adjusting a lookback period to smooth the price ratio data and generate timely trading signals.
Previous research has demonstrated both the potential and limitations of pairs trading across different markets and conditions. For instance, Perlin found positive performance of pairs trading in the Brazilian financial market, taking advantage of market inefficiencies [2]. Similarly, Caldeira et al. showed that cointegration-based pairs trading strategies could yield excess returns with low market correlation, underscoring the potential of cointegration as a model foundation[3]. And Do et al. observed that the strategy remained profitable during turbulent periods, such as the global financial crisis [4], indicating that certain conditions may enhance pairs trading performance.
Despite these insights, Tokat et al. [5] noted a lack of a significant relationship between cumulative returns and the strength of cointegration in pairs trading, suggesting that profit opportunities may persist even with weak cointegration. Therefore, the author points to the importance of optimizing parameters, especially the lookback window, which controls the sensitivity of signals and the balance between signal frequency and reliability. If the lookback window is too short, signals may be overly sensitive to noise; if too long, critical trading opportunities may be missed. This highlights the need for an adaptive window that can capture cyclical market behaviors and fine-tune signal generation.
Fast Fourier Transform (FFT) has often been applied in finance primarily for options and derivative pricing [6]. The discrete Fast Fourier Transform (FFT) has been used for clustering the frequency domain of time series [7]. In general, FFT analysis is especially valuable in identifying patterns or cycles within time series data, so we bring up a new application in trading application—utilizing it to decompose asset data into component waves for clearer visualization and more significant trends in the futures market. To be more specific, by decomposing the price ratios of two assets into their dominant periodic components, FFT offers a dynamic approach for defining lookback windows, effectively capturing cyclical behavior that traditional methods might miss. This enables traders to select a lookback window based on the half-length of major cycles, aligning the lookback period with the natural periodicity present in the price series.
The following sections will introduce FFT methodology and verify its effectiveness through a rigorous process of empirical testing. By applying this method to the data from the Chinese futures market from 2014 to 2022, we systematically evaluated returns across various lookback window periods. This examination reveals the relationship between the windows yielding the highest returns and the wavelength of the dominant frequencies extracted via Fourier analysis, concluding with insights on the practical implications and future directions.
2. Methodology
2.1. FFT Model Establishment
In this study, we apply Fast Fourier Transform (FFT) to analyze the price ratio series, leveraging its computational efficiency to convert time-domain data into the frequency domain and thereby extract significant periodic components. The fundamental principle of FFT is to decompose a signal into an aggregate of sine waves at various frequencies, enabling the identification of dominant frequency components that represent significant cyclical patterns in the data. Through FFT, we can swiftly calculate the amplitude of each frequency component and isolate those with higher amplitudes, indicating cycles that contribute more substantially to price fluctuations and are more representative of underlying market dynamics.
For our pairs trading strategy, we demean the raw price ratio series to remove any fixed offsets, thereby eliminating trends that might interfere with the analysis of periodicity. This preparation ensures that the data are more suitable for frequency-domain analysis. Next, we apply FFT to convert the time-series data from the time domain to the frequency domain. By calculating the amplitude of each frequency component, we identify the ones with higher amplitudes, which typically correspond to primary cycles within the price ratio. A larger amplitude signifies that the frequency is a strong contributor to the overall data variability, capturing the predominant cyclical behavior of the market. After identifying these dominant cycles, we select the half-lengths of the primary frequency components as the lookback window length for pairs trading. We expect that this half-wavelength aligns the window size with the market's inherent cyclical structure, allowing trading signals to accurately capture mean-reverting opportunities within the observed market cycles. This data-driven method replaces subjective selection with a quantitative approach based on the intrinsic periodic characteristics of the related asset prices.
In summary, FFT enables the extraction of meaningful frequency components from time-domain data, providing an empirical basis for selecting the lookback window length. Next, we will verify the effectiveness of this method with actual data.
2.2. Data Collection and Description
This study utilizes daily closing prices of Copper Futures (CU) from the Shanghai Futures Exchange and Silicon Iron Futures (SF) from the Zhengzhou Commodity Exchange, covering September 1, 2014, to September 1, 2022, with 1,947 observations for each asset.
Copper Futures (CU) had a mean price of 50,593.66 with a standard deviation of 10,589.84, ranging from a minimum of 33,510 to a maximum of 77,720, indicating substantial price volatility over the sample period. Silicon Iron Futures (SF) had a mean price of 6,294.90, with a standard deviation of 1,749.86, and a broader price range from 3,400 to 17,780, reflecting its high sensitivity to market conditions.
For daily returns, CU showed a mean of 0.0182% with a standard deviation of 1.16%, while SF exhibited a mean return of 0.0342% with a higher standard deviation of 1.91%, suggesting greater volatility. The maximum and minimum daily returns were 6.35% and -6.21% for CU, and 10.70% and -16.21% for SF, respectively.
The correlation between CU and SF prices was 0.8695, indicating a strong positive relationship. However, the daily return correlation was lower at 0.2002, suggesting limited short-term co-movement and potential for effective hedging strategies.
2.3. Empirical Analysis Mechanism
Based on the data information obtained above, the first step is to identify whether the two assets are likely to move together over short time intervals, which is inherently a forecasting process. The initial identification involves conducting stationarity tests, specifically the Augmented Dickey-Fuller (ADF) test, to determine whether the price series of the two assets exhibit mean-reverting behavior. If both price series are found to be non-stationary, it suggests the potential for price deviations between the two assets, creating possible arbitrage opportunities. Thus, if the stationarity test results indicate that copper futures (CU) and silicon iron futures (SF) are both non-stationary, this establishes the theoretical foundation for further cointegration analysis.
The cointegration test aims to determine whether there is a long-term equilibrium relationship between the two assets. The Engle-Granger method [8] is applied to test for cointegration between the log prices of the two assets. The results of this test confirm whether a cointegrated relationship exists. If cointegration is found, it implies that the price ratio between the two assets follows a mean-reverting process, providing the theoretical basis for pairs trading.
Once cointegration is confirmed, to assess the effectiveness of this approach, we compare different lookback periods in the strategy backtesting, including both traditional fixed windows and those determined by the dominant frequencies identified through Fourier analysis. The performance of the strategy is then simply evaluated based on the returns generated from these different windows.
3. Empirical Test and Results
3.1. ADF Test Results and Engle-Granger Test for CU and SF
We construct the portfolio of pairs of CU and SF. Upon completion of the ADF tests on the price time series of each asset separately, we present the following results:
Table 1: ADF Test results.
Asset | ADF Statistic | p-value |
CU | -1.0039 | 0.7518 |
SF | -2.2034 | 0.2050 |
The ADF statistics, with p-values greater than 0.05, indicate that both time series represent non-stationary. Based on this, we will proceed with the Engle-Granger cointegration test to assess the existence of a cointegration relationship between these non-stationary time series:
Table 2: ADF Test results for Engle-Granger Cointegration Residuals.
ADF Statistic | p-value |
-4.7725 | 0.0042 |
The ADF test results for Engle-Granger cointegration residuals indicate that the residual series is stationary, confirming a cointegration relationship between the two assets, which provides the necessary condition for pairs trading. As shown in the figure below, we can observe a strong cointegrated relationship between the movements of the two asset prices.
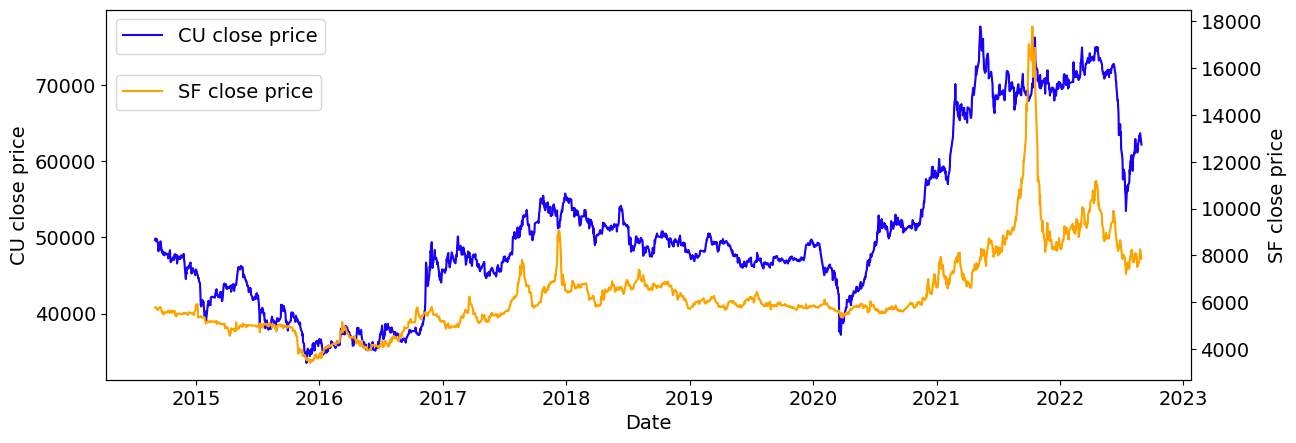
Figure 1: Price trend of copper futures (CU) and silicon iron futures (SF).
After these tests, we will compute the Z-Score of the normalized price ratio. It is essential to compute the Z-Score for a rolling time window rather than for the entire period. For example, we can calculate a Z-Score for the interval from January 1 to February 1 and use it for a trading signal on February 2. This rolling process continues by shifting the window forward daily, which emphasizes the need for careful selection of the rolling window size when implementing mean reversion strategies [9,10].
The selection of the rolling lookback window will incorporate FFT analysis.
3.2. FFT Model Execution
FFT decomposes complex waves or signals into simple sine and cosine waves. The ratio of the closing prices of CU and SF, after demeaning, will yield periodic components:
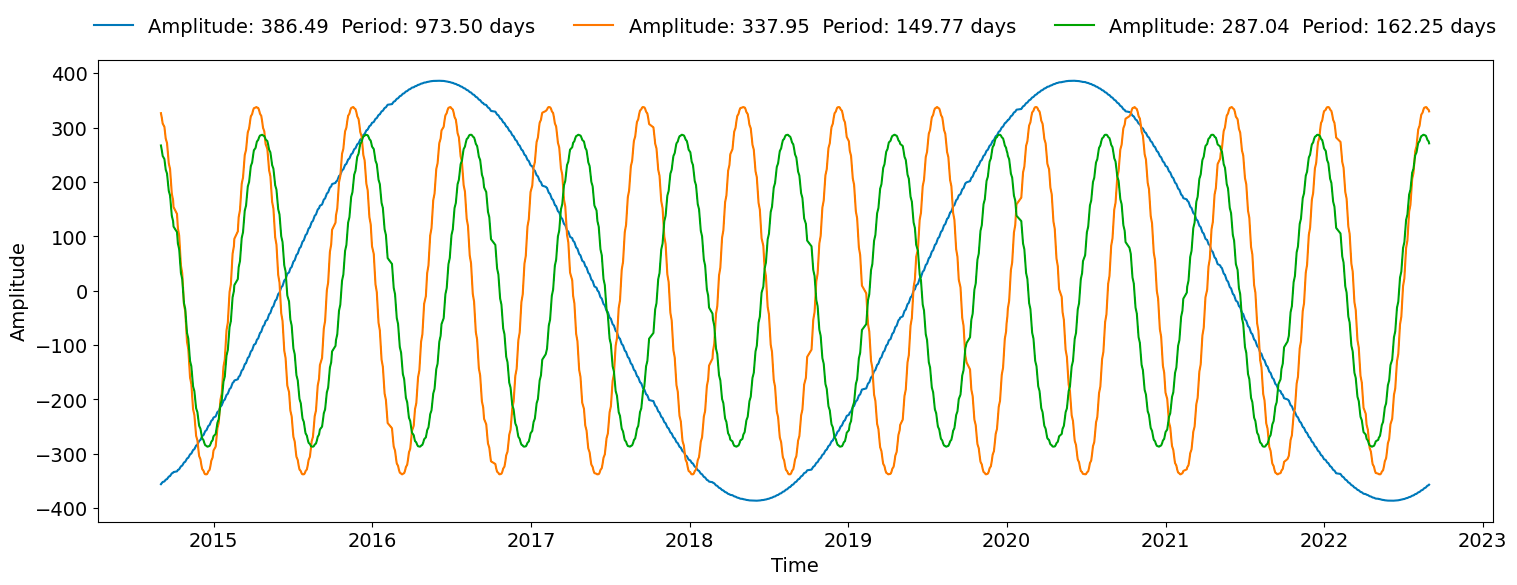
Figure 2: Three dominant amplitude components in FFT analysis of CU/SF price ratio.
As shown in the figure above, the maximum amplitude of 386.49 corresponds to the dominant cycle of 973.5 days. This cycle will be compared with lookback windows used for calculating backtesting returns in pairs trading strategy. The lookback windows range from 10 to 2000 days in 5-day intervals, and the top 5 performance results are presented in the following table:
Table 3: Top 5 profits performance with different lookback rolling windows of pairs trading.
Lookback rolling windows | Profit |
450 | 2998911.59 |
455 | 2997356.70 |
460 | 2983453.83 |
490 | 2979109.05 |
495 | 2962457.19 |
4. Conclusion
Trading simulations validate our method, as the optimal extracted cycle is 973.5 days, with the best-performing lookback windows clustering around half of this period, approximately 487 days. It can be concluded that optimal window periods align with the periodic cycles derived from application of FFT to CU and SF futures during the study time, confirming the relationship between lookback windows and extracted wave periods, as anticipated.
The application of FFT in determining the window offers several key advantages. Firstly, by decomposing price fluctuations into simpler waveforms, it captures the potential periodic patterns within the price ratios, enabling trading strategies to more sensitively identify cyclical movements and execute buy or sell orders at appropriate times. Secondly, FFT-based window selection can adapt to the frequency of price fluctuations under varying market conditions, autonomously adjusting the observation window and significantly enhancing the flexibility of the strategy. Furthermore, by automatically identifying significant periodic fluctuations in the data through FFT, reliance on parameter tuning is reduced, improving the robustness and noise resilience of the strategy.
In practice, however, there are limitations to this approach, as the prices of futures contracts are often affected by seasonal cycles, especially those related to agricultural products, energy and certain metals. These seasonal patterns are driven by fluctuations in supply and demand, weather factors and consumer habits, resulting in cyclical changes at similar times of the year. Combining seasonal ARIMA (SARIMA) models may better capture these seasonal patterns in time series data.
In addition, the choice of frequency and period during FFT process significantly impacts results. If the extracted frequencies do not align with current market conditions, the signals may fail to provide actionable insights. Furthermore, many markets exhibit complex nonlinear characteristics that exceed the analytical capabilities of FFT, leading to insufficient predictive power. In the future, to enhance strategy performance, it is crucial to integrate various technical analysis methods, conduct parameter optimization, and implement adaptive adjustments [11]. The fixed time window approach often fails to dynamically capture periodic changes in price ratios, resulting in inaccurate signals during volatile market conditions. By adjusting the rolling window based on actual market cycle characteristics, traders can optimize signal generation and improve trading frequency. In practice, machine learning algorithms can be employed to fine-tune the lookback window interval, allowing for the identification of optimal parameters, as demonstrated through methods like GPlearn. This adaptive approach may ultimately lead to more effective trading strategies in the face of complex and dynamic market environments.
References
[1]. Vidyamurthy, G. (2004). Pairs trading: Quantitative methods and analysis (Vol. 217). John Wiley & Sons.
[2]. Perlin, M. S. (2009). Evaluation of pairs-trading strategy at the Brazilian financial market. Journal of Derivatives & Hedge Funds, 15, 122-136.
[3]. Caldeira, J. F., & Moura, G. V. (2013). Selection of a portfolio of pairs based on cointegration: A statistical arbitrage strategy. Revista Brasileira de Financas, 11(1), 49-80.
[4]. Do, B., & Faff, R. (2010). Does simple pairs trading still work?. Financial Analysts Journal, 66(4), 83-95.
[5]. Tokat, E., & Hayrullahoğlu, A. C. (2022). Pairs trading: is it applicable to exchange-traded funds?. Borsa Istanbul Review, 22(4), 743-751.
[6]. Chourdakis, K. (2005). Option pricing using the fractional FFT. Journal of computational finance, 8(2), 1-18.
[7]. Durcheva, M., & Tsankov, P. (2019, November). Analysis of similarities between stock and cryptocurrency series by using graphs and spanning trees. In AIP conference proceedings (Vol. 2172, No. 1). AIP Publishing.
[8]. Engle, R. F., & Granger, C. W. (1987). Co-integration and error correction: representation, estimation, and testing. Econometrica: journal of the Econometric Society, 251-276.
[9]. Keshavarz Haddad, G., & Talebi, H. (2023). The profitability of pair trading strategy in stock markets: Evidence from Toronto stock exchange. International Journal of Finance & Economics, 28(1), 193-207.
[10]. Elliott, R. J., Van Der Hoek*, J., & Malcolm, W. P. (2005). Pairs trading. Quantitative Finance, 5(3), 271-276.
[11]. Krauss, C. (2017). Statistical arbitrage pairs trading strategies: Review and outlook. Journal of Economic Surveys, 31(2), 513-545.
Cite this article
Liu,K. (2024). Empirical Analysis of Lookback Window Optimization in Pairs Trading Using Fast Fourier Transform. Advances in Economics, Management and Political Sciences,139,137-142.
Data availability
The datasets used and/or analyzed during the current study will be available from the authors upon reasonable request.
Disclaimer/Publisher's Note
The statements, opinions and data contained in all publications are solely those of the individual author(s) and contributor(s) and not of EWA Publishing and/or the editor(s). EWA Publishing and/or the editor(s) disclaim responsibility for any injury to people or property resulting from any ideas, methods, instructions or products referred to in the content.
About volume
Volume title: Proceedings of the 3rd International Conference on Financial Technology and Business Analysis
© 2024 by the author(s). Licensee EWA Publishing, Oxford, UK. This article is an open access article distributed under the terms and
conditions of the Creative Commons Attribution (CC BY) license. Authors who
publish this series agree to the following terms:
1. Authors retain copyright and grant the series right of first publication with the work simultaneously licensed under a Creative Commons
Attribution License that allows others to share the work with an acknowledgment of the work's authorship and initial publication in this
series.
2. Authors are able to enter into separate, additional contractual arrangements for the non-exclusive distribution of the series's published
version of the work (e.g., post it to an institutional repository or publish it in a book), with an acknowledgment of its initial
publication in this series.
3. Authors are permitted and encouraged to post their work online (e.g., in institutional repositories or on their website) prior to and
during the submission process, as it can lead to productive exchanges, as well as earlier and greater citation of published work (See
Open access policy for details).
References
[1]. Vidyamurthy, G. (2004). Pairs trading: Quantitative methods and analysis (Vol. 217). John Wiley & Sons.
[2]. Perlin, M. S. (2009). Evaluation of pairs-trading strategy at the Brazilian financial market. Journal of Derivatives & Hedge Funds, 15, 122-136.
[3]. Caldeira, J. F., & Moura, G. V. (2013). Selection of a portfolio of pairs based on cointegration: A statistical arbitrage strategy. Revista Brasileira de Financas, 11(1), 49-80.
[4]. Do, B., & Faff, R. (2010). Does simple pairs trading still work?. Financial Analysts Journal, 66(4), 83-95.
[5]. Tokat, E., & Hayrullahoğlu, A. C. (2022). Pairs trading: is it applicable to exchange-traded funds?. Borsa Istanbul Review, 22(4), 743-751.
[6]. Chourdakis, K. (2005). Option pricing using the fractional FFT. Journal of computational finance, 8(2), 1-18.
[7]. Durcheva, M., & Tsankov, P. (2019, November). Analysis of similarities between stock and cryptocurrency series by using graphs and spanning trees. In AIP conference proceedings (Vol. 2172, No. 1). AIP Publishing.
[8]. Engle, R. F., & Granger, C. W. (1987). Co-integration and error correction: representation, estimation, and testing. Econometrica: journal of the Econometric Society, 251-276.
[9]. Keshavarz Haddad, G., & Talebi, H. (2023). The profitability of pair trading strategy in stock markets: Evidence from Toronto stock exchange. International Journal of Finance & Economics, 28(1), 193-207.
[10]. Elliott, R. J., Van Der Hoek*, J., & Malcolm, W. P. (2005). Pairs trading. Quantitative Finance, 5(3), 271-276.
[11]. Krauss, C. (2017). Statistical arbitrage pairs trading strategies: Review and outlook. Journal of Economic Surveys, 31(2), 513-545.