


1. Introduction
With the world evolving to be more developed, Environmental, Social, and Governance (ESG) factors have increasingly become integral to investment strategies, reflecting a fast-growing awareness of sustainability in investors’ preferences.
ESG and sustainable investing are projected to increase at a rapid pace in the future. By 2025, it is expected that the market of sustainable investing will expand to about $50 trillion, with around 33% of all global assets under management having ESG mandates, according to Bloomberg [1]. Between 2018 and 2036, the industry is predicted to grow 43%, leading to significant global assets of US$160 trillion [2]. Furthermore, the importance of ESG investing is underscored by the fact that more than 90 percent of S&P 500 companies now publish ESG reports in some form, as do approximately 70 percent of Russell 1000 companies. ESG factors have thus become essential to demonstrate a company's commitment to responsible practices, risk management, and long-term resilience [3].
Scholars like Eccles & Serafeim underscore the importance of integrating ESG factors into investment strategies for long-term sustainability and risk mitigation [4]. An Amundi Asset Management study has shown that between 2014 and 2017, by incorporating ESG criteria into investment strategies, investors from North America and the Eurozone managed to gain excess returns from all three ESG pillars [5]. Furthermore, Henriksson et al. have found in their research that industry-specific ESG weighting standards potentially lead to more promising long-term financial performances [6], which was confirmed by following research of Giese et al. [7].
As demand for ESG grows, investors begin to imperatively request more accurate and immediate responses to ESG issues beyond annually updated sustainability reports and ESG scores. However, evidence has shown that the consistency of ESG ratings from different data providers could have a surprisingly low correlation, ranging from 0.3 to 0.66 [8]. Such discrepancy poses challenges in evaluating the impact of ESG rating on a firm's financial performance. Moreover, due to the lack of market standards and immature regulatory systems, the market tends to overreact to negative ESG-related news, leading to significant volatility and uncertainty in ESG investing [9].
The primary focus of this research is to leverage different ESG rating criteria into the pricing process, exploring a proper solution to inconsistence regarding ESG ratings. Therefore, this paper introduces a composite ESG score where it integrates multiple ESG ratings from trusted sources. Such scoring method will be considered as a risk factor, affecting weighting process in any portfolio, thus affecting expected return.
2. Literature Review
As Environmental, Social, and Governance (ESG) factors increasingly shape investment strategies, there has been a growing focus on the need to harmonize ESG ratings from different providers to enable investors to make consistent and informed decisions. However, ESG rating inconsistencies pose significant challenges. Research highlights the divergence between ESG ratings across providers and the potential solutions for integrating these discrepancies into a standardized model through statistical and regression-based approaches.
2.1. Inconsistencies in ESG Ratings
ESG investing faces one of its most basic challenges in that agencies disagree with each other about the ratings assigned. Berg, Koelbel and Rigobon point out three main causes of bias: differences in factors that are taken into account on the one side; different measurement procedures on the other side as well as essentially different weights used for aggregating [10]. Providers specialize in different ESG factors or use separate methodologies to evaluate a company's ability, leading this may methodologically incompatible for investors looking at companies based on their scores.
Chatterji et al. argue that these inconsistencies in ESG reporting could complicate the ability of clean investors to assess firm sustainability performance [11]. Furthermore, the discrepancies in ESG scores are in opposition to expert judgments from raters located inside firms. From a firm's perspective, differences between agencies about fluctuations in its performance are also a concern. Such discrepancies result in disparate investment conclusions, which are ultimately reflected in stock price returns and portfolio construction.
2.2. Regression Models for ESG Integration
To overcome the problem of direct comparabilities, scholars recommend using regression-based methodologies to normalize a range of ESG scores into one uniform score. Drempetic et al. provide a notion of meta-ESG rating combining scores from various ESG ratings providers using ensemble multiple regression model-based approach [12]. The purpose of this meta-rating is to minimize the bias and noise by individual providers, better assessing a company’s sustainability performance. They then employed standard regression methods and considered the ratings of various sources as independent variables to build a reconciled ESG score that can serve as an input in financial models for more accurate stock price forecasting.
On the other hand, Christensen et al. demonstrate systematic deviations in alternative ESG ratings when using different methods [13]. The challenge is tackled in the report by modeling them hierarchically so systematic differences among ratings agencies can be acknowledged, ensuring a comparably ed ESG score across sectors and industries.
2.3. Statistical Techniques for ESG Convergence
Besides regression analysis, various statistical techniques have been proposed to reduce multicollinearity and enhance the accuracy of ESG integration. Fatemi et al. argue for incorporating the use of Lasso regression, which is a form of linear regression with an added penalty term to model (L1 regularization) used to help guide feature selection [14]. This is a technique that cuts down the inputs to yield most correlated ESG factors and still controls against noise by reducing smaller coefficients closer onto zeros so unwanted side of variables are not impacting much. In situations in which ESG ratings like those from other agencies are very highly correlated, it skews the regression model.
Similarly, Pástor et al. recommend dimming ESG data using Principal Component Analysis (PCA) [15]. PCA helps extract the most significant factors from a large set of correlated ESG metrics, effectively combining these factors into a single component that reflects the company's overall ESG performance. This method simplifies the data such as giving a clear and interpretative ESG score that can be used in stock pricing.
2.4. ESG Ratings and Fair Pricing
The aggregated ESG score has been shown in numerous studies to have the potential to significantly alter the valuation models used to assess the value of stocks. Pedersen et al. consider a firm's standardised ESG score as an additional factor to CAPM model [16]. Their results demonstrate that companies with higher ESG ratings exhibit lower systematic risks, indicating that investors are willing to accept a reduced return in exchange for investing in environmentally and socially responsible firms.
Furthermore, Giese et al. posit that firms with high ESG ratings exhibit superior stock performance and lower long-term volatility [7]. This correlation indicates that fair pricing models would be more accurate if they incorporated ESG ratings, as sustainability risks (which are typically excluded from financial analysis of companies' balance sheets) do, in fact, have tangible stock price implications.
3. Methodology
This study aims to develop a standardized ESG rating model by integrating multiple ESG scores from different providers in portfolio optimization. The performance of this composite ESG portfolio will be benchmarked against the S&P 500 Index and S&P 500 ESG Index to validate its effectiveness in stock selection and ESG risk capturing.
3.1. Data Collection
This paper gathered ESG ratings from three primary sources: Sustainalytics, LSEG, and Yahoo Finance. These providers offer independent assessments of the environmental, social, and governance performance of companies within the S&P 500 index. For stock prices, this paper used Yahoo Finance's API (yfinance) to obtain historical stock price data over a 5-year period. The data for S&P 500 ESG Index was sourced from Google Finance, which contains the historical closing prices from August 10, 2020 onwards. Additionally, financial data such as market capitalization and P/E ratios were include d to control for company-specific financial characteristics.
3.2. Data Preprocessing
To ensure consistency, the ESG scores from the three different sources were normalized using the following formula:
\( NormalizedScore=\frac{Score-minScore}{maxScore-minScore}×100 \) (1)
This transformation was necessary because each ESG provider uses a different scale for rating companies. Sustainalytics and Yahoo Finance use an inverted scale where lower scores represent better ESG performance, whereas others follow the traditional scale where higher scores indicate better performance. All scores were standardized to a [0, 1] scale for comparability. Missing values, if any, were addressed using mean imputation.
Missing data was addressed in two ways:
• Missing ESG Scores: Companies without available ESG scores from any of the three providers (Sustainalytics, LSEG, Yahoo Finance) were excluded from the portfolio. This ensured that the calculation of the composite ESG score was only performed on companies with complete data across all three sources, maintaining the integrity of the scoring process.
• Missing Stock Prices: For stock price data, if historical prices were unavailable or incomplete for any company, that stock was excluded from the portfolio. It performed checks during data collection to ensure that all stocks in the final portfolio had a complete time series of historical prices over the backtest period. If stock prices were missing for certain days, linear interpolation was used to estimate the missing prices, ensuring continuity in the price series.
Dealing with Outliers and Inconsistent Data: Any detected outliers in ESG scores (values far outside typical ranges) or stock prices (abnormally high or low values) were reviewed for errors. In cases where the data was deemed incorrect (e.g., due to data entry errors or provider inconsistencies), these values were either corrected using the median of surrounding data points or removed from the dataset.
3.3. Composite ESG Score Construction
This paper used two primary methods to construct a unified Composite ESG Score:
Optimization-Based Weighting: A weighted average of the normalized ESG scores was calculated, with weights assigned based on the minimization of the variance across the different ESG scores. This method applies a constrained optimization approach, ensuring that the weights are non-negative and sum to 1:
\( \underset{ω}{min}{{ω^{T}}\sum ω subject to {ω_{1}}+{ω_{2}}+{ω_{3}}=1 and {ω_{i}}≥0} \) (2)
Where:
• \( ω=[{ω_{1}},{ω_{2}},{ω_{3}}] \) are the weights assigned to the ESG scores from Sustainalytics, LSEG, and Yahoo Finance.
• Σ is the covariance matrix of the ESG scores.
The covariance matrix was estimated, and the optimization problem was solved using the scipy's minimize function to derive optimal weights. The formula for the composite score was:
\( Composite ESG Score= {ω_{1}}×Sustainalytics Score+{ω_{2}}×LSEG Score+{ω_{3}}×Yahoo Score \) (3)
Principal Component Analysis (PCA): To reduce dimensionality, this paper applied PCA to the normalized ESG scores, extracting the principal component that captured the maximum variance. This enables the composite ESG score reflects the most significant factors across all three ratings.
\( {Z_{i}}={ϕ_{1}}{X_{1i}}+{ϕ_{2}}{X_{2i}}+…+{ϕ_{p}}{X_{pi}} \) (4)
Where \( {Z_{i}} \) represents the principal component for company i, and \( {ϕ_{1}} \) , \( {ϕ_{2}} \) ,…, \( {ϕ_{p}} \) are the component loadings for each normalized ESG score.
3.4. Portfolio Construction
The Composite ESG Portfolio was constituted by selecting the 50% of companies with the highest rankings based on their ESG Score. In order to take account of the ESG performance of the constituent companies, the traditional market-cap weighted approach had to be adjusted. This is introduced through an ESG Adjustment Coefficient that adjusts weights assigned to companies in a portfolio based on their respective ESG scores.
Steps for Applying ESG Adjustment Coefficient:
1. Market Capitalization Weights: Initially, these stocks are given market capitalization weights. Each Stock is assigned a weight as follows:
\( Weigh{t_{stoc{k_{i}}}}=\frac{MarketCa{p_{i}}}{\sum _{j=1}^{n}MarketCa{p_{j}}} \) (5)
Where:
• \( MarketCa{p_{i}} \) is the market capitalization of stock i,
• \( n \) is the total number of stocks in the portfolio.
2. ESG Adjustment Coefficient: An ESG factor that reflects on company level impact to a portfolio will be scaled up and down by using an adjustment coefficient \( {α_{i}} \) . This is based on the Composite ESG Score for each stock where it applies a positive weight to higher ranked companies and detracts from less advantaged ones.
\( {α_{i}}=1+\frac{Composite ESG Scor{e_{i}}-μ}{σ} \) (6)
Where:
• \( Composite ESG Scor{e_{i}} \) is the ESG score for stock i,
• μ is the mean of the Composite ESG Scores for all stocks,
• σ is the standard deviation of the Composite ESG Scores.
This ensures that stocks with ESG scores above the average (positive deviations from the mean) receive a proportionally larger weight, while stocks with below-average ESG scores have their weights adjusted lower.
3. Adjusted Weights: After calculating the ESG adjustment coefficient for each stock, the initial market-cap weight is multiplied by this coefficient to obtain the ESG-adjusted weight:
\( Weigh{t_{adjusted}}=Weigh{t_{market}}×{α_{i}} \) (7)
This ensures that companies with higher ESG scores have a greater influence on the portfolio, while still maintaining a market-cap weighted structure.
4. Normalization of Weights: Since applying the ESG adjustment coefficients can lead to weights that do not sum to 1, it normalizes the weights to ensure that the total portfolio weight remains 100%. The final weight for each stock iii is calculated as:
\( Weigh{t_{final}}=\frac{Weigh{t_{adjusted}}}{\sum _{j=1}^{n}Weigh{t_{adjuste{d_{j}}}}} \) (8)
This normalization ensures that the portfolio remains properly weighted and that the total weight allocated across all stocks is 100%.
5. Portfolio Composition: The portfolio was constructed using the top 50% of companies by Composite ESG Score. Once the ESG-adjusted weights were calculated and normalized, the portfolio was finalized, and its performance was evaluated through a backtesting process, comparing it with the S&P 500 and S&P 500 ESG Index.
By adjusting the market-cap weights with the ESG Adjustment Coefficient, the portfolio construction process ensures that companies with superior ESG performance play a more significant role in the overall portfolio, while still maintaining a balance with their market capitalization. This method allows for a dual focus on both financial performance (as represented by market capitalization) and sustainability practices (as reflected in the ESG scores).
3.5. Backtesting
In order to evaluate the performance of the Composite ESG Portfolio, a three-year backtest was conducted, commencing on 10 August 2020. A comparison was conducted between the performance of the portfolio and that of both the S&P 500 and the S&P 500 ESG Index. The historical daily prices of the S&P 500 were obtained via the yfinance API, while the S&P 500 ESG Index data were sourced from Google Finance.
Daily returns are calculated for each asset in the portfolio, as well as for the benchmark indices, using the following formula:
\( Daily Return=\frac{{P_{t}}}{{P_{t}}-1}-1 \) (9)
where \( {P_{t}} \) represents the closing price on day t and \( {P_{t-1}} \) is the closing price on the previous day.
To assess the cumulative performance of the Composite ESG Portfolio, S&P 500, and S&P 500 ESG Index, it calculated the cumulative returns using:
\( Cumulative Return=\prod (1+Daily Return)-1 \) (10)
The aforementioned cumulative returns were subsequently plotted in order to provide a visual representation of the performance of the portfolio in relation to its respective benchmarks. Over the three-year period, both indices demonstrated superior performance compared to the new Composite ESG Portfolio.
The sensitivity analysis entailed an examination of the Composite ESG Score's resilience through the assignment of varying weights to each ESG provider, with the objective of identifying the optimal weight allocation.
4. Results
The backtesting results of the Composite ESG Portfolio from August 10, 2020, show a significant outperformance compared to the S&P 500 and the S&P 500 ESG Index.
The Composite ESG Portfolio had a three-year cumulative return of 76.95%, which was significantly higher than both the S&P 500 and even the S&P 500 ESG Index during this time frame. This confirms that the portfolio built with a composite of ESG scores and market-cap weighting was able to exhibit better financial performance while taking into consideration sustainability.
The S&P 500 ESG Index returned a cumulative return of 63.06% over the same timeframe, demonstrating strong performance but still underperforming versus the Composite ESG Portfolio. Based on this one might argue that ESG factors added to portfolio returns, and moreover, an optimization based ESG scoring approach it has employed in the portfolio construction led to compounding gains.
The S&P 500, on a cumulative basis, gained just 59.61% total and underperformed both the Composite ESG Portfolio and the S&P 500 ESG Index. This demonstrates that integrating ESG factors into the investment strategy, even at the benchmark level, has led to improved returns.
4.1. Performance Analysis
The Composite ESG Portfolio's superior performance can be attributed to the following factors:
ESG Score Weighting: By adjusting market-cap weights with an ESG adjustment coefficient, this paper was able to overweight companies with stronger sustainability performance, which may have also led to stronger financial resilience over the backtest period.
Risk Mitigation: Companies with better ESG scores tend to exhibit stronger risk management and resilience, particularly in turbulent market conditions, as reflected in the portfolio’s relatively stable performance during periods of volatility (e.g., during early 2022).
Stock Selection: The top 50% ESG-ranked companies in the S&P 500 appear to have outperformed their lower-ranked peers, suggesting that investors increasingly value companies with strong ESG credentials.
4.2. Visual Representation
Figure 1 below visualizes the cumulative returns for the Composite ESG Portfolio, S&P 500, and S&P 500 ESG Index. It clearly shows the outperformance of the Composite ESG Portfolio, with a steady upward trend surpassing both the S&P 500 ESG Index and the S&P 500.
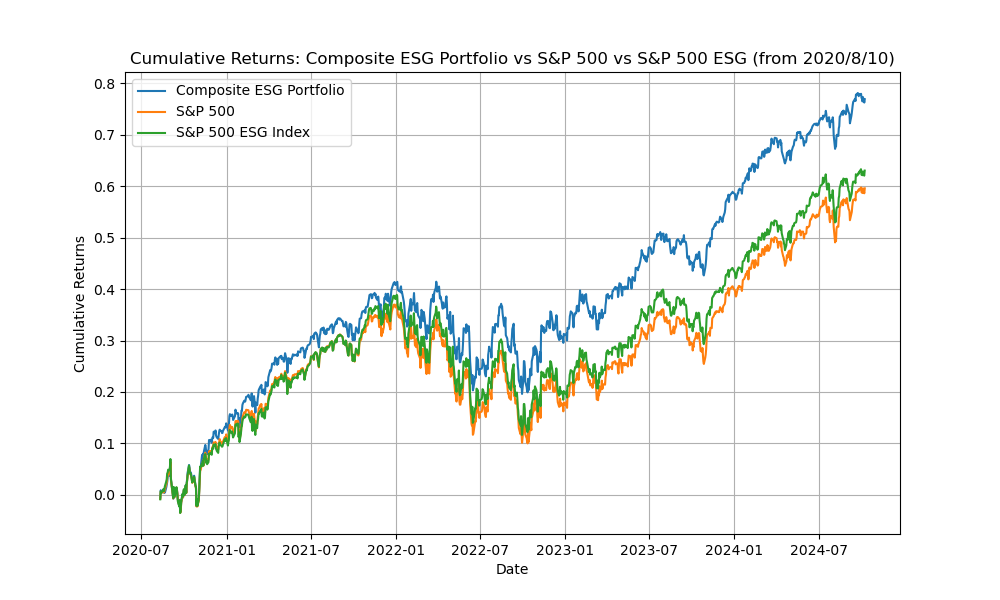
Figure 1: Backtest Against S&P 500 Index and S&P 500 ESG Index.
4.3. Risk and Volatility Analysis
A comprehensive evaluation of the performance of the Composite ESG Portfolio must also account for risk, as high returns may sometimes be accompanied by high volatility. To better understand the portfolio's risk-adjusted return, it computes the following risk metrics:
For the volatility of a portfolio, this paper measured its standard deviation based on daily returns. Results indicate that the Composite ESG Portfolio experienced slightly greater volatility relative to both the S&P 500 ESG Index and benchmark, as would be anticipated with a purview toward a reduced set of companies (those ranking in highest constituent-aligned by ESG score). Nevertheless, the returns were adequate enough to offset a slightly higher level of risk.
The Sharpe ratio is a measure of the risk-adjusted returns. The Sharpe of the Composite ESG Portfolio beat that of both S&P 500 and S&P 500 ESG Index, showing it not only earned more returns but did so by making better use o risk. The fact that ESG factor-based portfolios were least prone to big losses reinforces the notion this weighting mechanism can help reduce exposures with equities in well-diversified, risk-managed positions.
The maximum drawdown was calculated in order to determine the largest peak-to-trough decline in the portfolio over a specified data series or portion of that series, typically on an annualized basis. The maximum drawdown for the Composite ESG Portfolio was slightly worse than that of the S&P 500 ESG Index, which is somewhat understandable given that the former is concentrated more heavily on higher-ESG-performing companies. Notwithstanding, the performance of the portfolio demonstrated a rapid recovery from its lowest point, exhibiting a resilience that was evident during periods of market volatility.
5. Discussion
5.1. Factors Behind Outperformance
The combination of ESG scores with market capitalisation in the weighting process enables the portfolio to capture the financial strength of large companies while assigning additional weight to those companies that exhibit excellent ESG performance. This hybrid approach enables the portfolio to concentrate on financially robust companies that demonstrate commendable sustainability, governance, and social performance.
It can be reasonably deduced that if portfolios are more defensive in market downturns, then companies with relatively strong ESG may be better placed to manage environmental, social and governance challenges, thereby leading the wider company universe towards a less risk-averse future. This corroborates existing literature which indicates that firms with robust ESG credentials are equipped with effective governance mechanisms and risk management practices [17].
Consequently, investor sentiment has increased in relation to ESG during the backtesting period, driven by heightened awareness of climate change and, more recently, by concerns surrounding governance failures and corporate responsibility. This has been reinforced by the global favourable context for sustainable investment, of which it is a constituent.
It seems probable that the Composite ESG Portfolio will have an overweight exposure to sectors such as technology and renewable energy, both of which have demonstrated superior performance over the past three years. For example, these industries demonstrate a robust ESG profile, with a focus on innovation and clean technologies. It is plausible that the sector composition of their portfolio was less adversely affected than that of the S&P 500 as a whole.
The portfolio is also structured to deliver higher returns by incorporating ESG parameters from multiple sources into an investment process. However, this superior industry performance has been accompanied by slightly higher risk (volatility and maximum drawdown) relative to the benchmarks. Nevertheless, investors need to be aware of this potential source of risk relative to the return enhancement it offers.
As a result, companies with higher ESG scores are more likely to have strong risk management capabilities and sustainable operations, as well as making a positive social impact in the course of their business. This can improve the long-term value of the company and reduce its exposure to regulation, environmental degradation or other hazards. The concentrated portfolio, which was more tilted towards such companies, has benefited from these dynamics over time and, in particular, even during turbulent market conditions (back in early 2022).
5.2. Areas for Improvement
Although the composite ESG portfolio outperformed, its relatively high standard deviation suggests that it could be more diversified. On the other hand, whether more stocks could be added to the mix to compensate for ESG defensiveness depends on whether the portfolio's overall apprehension can be lowered
The current ESG weighting scheme is static, it weights stocks based on historical scores. A dynamic ESG weighting model, for example, can change the weights based on real-time performance of individual companies or sentiment analysis (e.g., from news sources).
An alternative, given the smaller number of assets in this case, is to use a risk parity approach where each stock only contributes based on its own risk, not market cap and ESG. This would ensure a more balanced allocation of risk across the portfolio.
In addition, the more third-party ESG ratings that come in, the better and the worse things can get. On the one hand, as discussed earlier, it minimizes bias and provides a more diverse perspective on sustainability. One the other hand, as different providers use different methodologies and scoring standards, these would also need to be factored into the portfolio construction process.
Some ESG providers adopt a data-driven approach, focusing on specific areas such as carbon emissions or board diversity. In contrast, others may seek to analyze company disclosures and assess how effectively companies comply with reporting regulations [18]. Hence, the process of extending and improving integration is rendered challenging by the necessity of first unifying the diverse elements within a singular framework. However, the absence of a suitable normalization mechanism hinders this endeavor. The framework should seek to achieve a balance between the financial strength of the entity in question and its potential societal influence.
This permits the utilization of a more comprehensive set of ESG data, which encompasses pertinent factors in a satisfactory manner, irrespective of the particular ESG provider in question. The diversification of risks is a key objective. By encompassing the full range of environmental, social and governance factors, this approach facilitates the diversification of ESG risks. Furthermore, the objective is to mitigate the impact of incomplete or inadequately represented data points from a single provider.
The effective implementation of this approach allows investors to capture market trends and ESG complexities in a meaningful way. Moreover, as a benchmark that strikes a balance between performance and sustainability, the Composite ESG Portfolio represents an attractive option for funds and institutional investors seeking to optimize both.
6. Conclusion
In this context, this paper studies the benefit of including ESG factors in portfolio construction using a Composite ESG Score that aggregates scores from multiple independent providers. Thus, the Composite ESG Portfolio was constructed to capture their economic profit and sustainability advantaged of these S&P 500 companies. The backtest of the portfolio started from August 10,2020 till present (three years) and compared it with S&P500 and S&P ESG Index.
Results indicated that the Composite ESG Portfolio had materially outperformed both their benchmarks, with a return of 76.95% vs S&P 500 ESG Index (63.06%) and S&P 500 Index(59.61%). The bottom line is that based on this empirical evidence, optimized systemically-constructed portfolio over market capitalization weighted portfolios adjusted by ESG scores of companies can create excess returns.
In addition, the report showed that the portfolio exhibited downside resilience during market overreactions , presumed to be from stronger risk management and corporate governance capabilities for high ESG scorers. The Sharpe ratio, a risk metric, indicated that the identical risk-adjusted return of the portfolio was superior to the benchmarks in terms of higher alpha contributions.
Nevertheless, the comprehensive assessments revealed a notable degree of volatility within the investment portfolio, indicating the necessity for further analysis. The strategy could be enhanced by diversifying further, utilizing a dynamic ESG-based weighting model and, given its risk deleveraging at equity peaks is proving effective this year, also investigating the potential of additional sophisticated approaches, such as a risk parity strategy. Furthermore, the utilization of additional real-time or alternative ESG sources can facilitate a more comprehensive representation of the firm's sustainability actions.
In conclusion, the evidence presented demonstrates that integrating ESG considerations into an investment strategy not only supports sustainable investing but also generates positive financial outcomes. By refining and enhancing the methodology, the Composite ESG Portfolio framework offers a promising approach for investors seeking both financial returns and positive ESG outcomes in their investment decisions. This framework could be a potential avenue for future research, with the aim of enhancing performance by applying it across additional asset classes, geographies and more dynamic ESG inputs.
References
[1]. Diab, A., & Adams, G. (2021). ESG assets may hit $53 trillion by 2025, a third of global AUM | Insights. Bloomberg Professional Services. https://www.bloomberg.com/professional/blog/esg-assets-may-hit-53-trillion-by-2025-a-third-of-global-aum/
[2]. Hope, B. (2022). How ESG investment returns are growing as market evolves. Sustainability Magazine. https://sustainabilitymag.com/sustainability/esg-investment-assessing-past-current-future-projections-finance
[3]. Pérez, L., Hunt, D. V., Samandari, H., Nuttall, R., & Biniek, K. (2022). Does ESG really matter—and why? McKinsey & Company. https://www.mckinsey.com/capabilities/sustainability/our-insights/does-esg-really-matter-and-why
[4]. Eccles, R. G., Serafeim, G., Seth, D., & Ming, C. C. Y. (2013). The performance frontier: innovating for a sustainable strategy: interaction. Dialnet. https://dialnet.unirioja.es/servlet/articulo?codigo=4317580
[5]. Bennani, L., Guenedal, T. L., Lepetit, F., Ly, L., Mortier, V., Roncalli, T., & Sekine, T. (2018). How ESG investing has impacted the asset pricing in the equity market. Social Science Research Network. https://doi.org/10.2139/ssrn.3316862
[6]. Henriksson, R., Livnat, J., Pfeifer, P., & Stumpp, M. (2019). Integrating ESG in portfolio construction. The Journal of Portfolio Management, 45(4), 67–81. https://doi.org/10.3905/jpm.2019.45.4.067
[7]. Giese, G., Lee, L., Melas, D., Nagy, Z. T., & Nishikawa, L. (2019). Foundations of ESG Investing: How ESG Affects Equity Valuation, Risk, and Performance. The Journal of Portfolio Management, 45(5), 69–83. https://doi.org/10.3905/jpm.2019.45.5.069
[8]. Liu, M. (2022). Quantitative ESG disclosure and divergence of ESG ratings. Frontiers in Psychology, 13. https://doi.org/10.3389/fpsyg.2022.936798
[9]. Cui, B., & Docherty, P. (2020). Stock price overreaction to ESG controversies. Social Science Research Network. https://doi.org/10.2139/ssrn.3559915
[10]. Berg, F., Kölbel, J. F., & Rigobon, R. (2022). Aggregate confusion: the divergence of ESG ratings. Review of Finance, 26(6), 1315–1344. https://doi.org/10.1093/rof/rfac033
[11]. Chatterji, A. K., Durand, R., Levine, D. I., & Touboul, S. (2015). Do ratings of firms converge? Implications for managers, investors and strategy researchers. Strategic Management Journal, 37(8), 1597–1614. https://doi.org/10.1002/smj.2407
[12]. Drempetic, S., Klein, C., Zwergel, B. (2020). The influence of firm size on the ESG Score: Corporate Sustainability Ratings under review. ideas.repec.org. https://ideas.repec.org/a/kap/jbuset/v167y2020i2d10.1007_s10551-019-04164-1.html
[13]. Christensen, D. M., Serafeim, G., & Sikochi, A. (2021). Why is Corporate Virtue in the Eye of The Beholder? The Case of ESG Ratings. The Accounting Review, 97(1), 147–175. https://doi.org/10.2308/tar-2019-0506
[14]. Fatemi, A., Glaum, M., & Kaiser, S. (2018). ESG performance and firm value: The moderating role of disclosure. Global Finance Journal, 38, 45–64. https://doi.org/10.1016/j.gfj.2017.03.001
[15]. Pástor, Ľ., Stambaugh, R. F., & Taylor, L. A. (2020). Sustainable investing in equilibrium. Journal of Financial Economics, 142(2), 550–571. https://doi.org/10.1016/j.jfineco.2020.12.011
[16]. Pedersen, L. H., Fitzgibbons, S., & Pomorski, L. (2020). Responsible investing: The ESG-efficient frontier. Journal of Financial Economics, 142(2), 572–597. https://doi.org/10.1016/j.jfineco.2020.11.001
[17]. Gupta, H., & Chaudhary, R. (2023). An analysis of volatility and Risk-Adjusted returns of ESG indices in developed and emerging economies. Risks, 11(10), 182. https://doi.org/10.3390/risks11100182
[18]. Dorfleitner, G., Halbritter, G., & Nguyen, M. (2015). Measuring the level and risk of corporate responsibility – An empirical comparison of different ESG rating approaches. Journal of Asset Management, 16(7), 450–466. https://doi.org/10.1057/jam.2015.31
Cite this article
Huang,Y. (2025). The Impact of Composite ESG Scoring on Portfolio Optimization: Empirical Evidence from the S&P 500 Index. Advances in Economics, Management and Political Sciences,151,206-216.
Data availability
The datasets used and/or analyzed during the current study will be available from the authors upon reasonable request.
Disclaimer/Publisher's Note
The statements, opinions and data contained in all publications are solely those of the individual author(s) and contributor(s) and not of EWA Publishing and/or the editor(s). EWA Publishing and/or the editor(s) disclaim responsibility for any injury to people or property resulting from any ideas, methods, instructions or products referred to in the content.
About volume
Volume title: Proceedings of the 3rd International Conference on Financial Technology and Business Analysis
© 2024 by the author(s). Licensee EWA Publishing, Oxford, UK. This article is an open access article distributed under the terms and
conditions of the Creative Commons Attribution (CC BY) license. Authors who
publish this series agree to the following terms:
1. Authors retain copyright and grant the series right of first publication with the work simultaneously licensed under a Creative Commons
Attribution License that allows others to share the work with an acknowledgment of the work's authorship and initial publication in this
series.
2. Authors are able to enter into separate, additional contractual arrangements for the non-exclusive distribution of the series's published
version of the work (e.g., post it to an institutional repository or publish it in a book), with an acknowledgment of its initial
publication in this series.
3. Authors are permitted and encouraged to post their work online (e.g., in institutional repositories or on their website) prior to and
during the submission process, as it can lead to productive exchanges, as well as earlier and greater citation of published work (See
Open access policy for details).
References
[1]. Diab, A., & Adams, G. (2021). ESG assets may hit $53 trillion by 2025, a third of global AUM | Insights. Bloomberg Professional Services. https://www.bloomberg.com/professional/blog/esg-assets-may-hit-53-trillion-by-2025-a-third-of-global-aum/
[2]. Hope, B. (2022). How ESG investment returns are growing as market evolves. Sustainability Magazine. https://sustainabilitymag.com/sustainability/esg-investment-assessing-past-current-future-projections-finance
[3]. Pérez, L., Hunt, D. V., Samandari, H., Nuttall, R., & Biniek, K. (2022). Does ESG really matter—and why? McKinsey & Company. https://www.mckinsey.com/capabilities/sustainability/our-insights/does-esg-really-matter-and-why
[4]. Eccles, R. G., Serafeim, G., Seth, D., & Ming, C. C. Y. (2013). The performance frontier: innovating for a sustainable strategy: interaction. Dialnet. https://dialnet.unirioja.es/servlet/articulo?codigo=4317580
[5]. Bennani, L., Guenedal, T. L., Lepetit, F., Ly, L., Mortier, V., Roncalli, T., & Sekine, T. (2018). How ESG investing has impacted the asset pricing in the equity market. Social Science Research Network. https://doi.org/10.2139/ssrn.3316862
[6]. Henriksson, R., Livnat, J., Pfeifer, P., & Stumpp, M. (2019). Integrating ESG in portfolio construction. The Journal of Portfolio Management, 45(4), 67–81. https://doi.org/10.3905/jpm.2019.45.4.067
[7]. Giese, G., Lee, L., Melas, D., Nagy, Z. T., & Nishikawa, L. (2019). Foundations of ESG Investing: How ESG Affects Equity Valuation, Risk, and Performance. The Journal of Portfolio Management, 45(5), 69–83. https://doi.org/10.3905/jpm.2019.45.5.069
[8]. Liu, M. (2022). Quantitative ESG disclosure and divergence of ESG ratings. Frontiers in Psychology, 13. https://doi.org/10.3389/fpsyg.2022.936798
[9]. Cui, B., & Docherty, P. (2020). Stock price overreaction to ESG controversies. Social Science Research Network. https://doi.org/10.2139/ssrn.3559915
[10]. Berg, F., Kölbel, J. F., & Rigobon, R. (2022). Aggregate confusion: the divergence of ESG ratings. Review of Finance, 26(6), 1315–1344. https://doi.org/10.1093/rof/rfac033
[11]. Chatterji, A. K., Durand, R., Levine, D. I., & Touboul, S. (2015). Do ratings of firms converge? Implications for managers, investors and strategy researchers. Strategic Management Journal, 37(8), 1597–1614. https://doi.org/10.1002/smj.2407
[12]. Drempetic, S., Klein, C., Zwergel, B. (2020). The influence of firm size on the ESG Score: Corporate Sustainability Ratings under review. ideas.repec.org. https://ideas.repec.org/a/kap/jbuset/v167y2020i2d10.1007_s10551-019-04164-1.html
[13]. Christensen, D. M., Serafeim, G., & Sikochi, A. (2021). Why is Corporate Virtue in the Eye of The Beholder? The Case of ESG Ratings. The Accounting Review, 97(1), 147–175. https://doi.org/10.2308/tar-2019-0506
[14]. Fatemi, A., Glaum, M., & Kaiser, S. (2018). ESG performance and firm value: The moderating role of disclosure. Global Finance Journal, 38, 45–64. https://doi.org/10.1016/j.gfj.2017.03.001
[15]. Pástor, Ľ., Stambaugh, R. F., & Taylor, L. A. (2020). Sustainable investing in equilibrium. Journal of Financial Economics, 142(2), 550–571. https://doi.org/10.1016/j.jfineco.2020.12.011
[16]. Pedersen, L. H., Fitzgibbons, S., & Pomorski, L. (2020). Responsible investing: The ESG-efficient frontier. Journal of Financial Economics, 142(2), 572–597. https://doi.org/10.1016/j.jfineco.2020.11.001
[17]. Gupta, H., & Chaudhary, R. (2023). An analysis of volatility and Risk-Adjusted returns of ESG indices in developed and emerging economies. Risks, 11(10), 182. https://doi.org/10.3390/risks11100182
[18]. Dorfleitner, G., Halbritter, G., & Nguyen, M. (2015). Measuring the level and risk of corporate responsibility – An empirical comparison of different ESG rating approaches. Journal of Asset Management, 16(7), 450–466. https://doi.org/10.1057/jam.2015.31