


1. Introduction
The rapid development of technology has dramatically changed the social media and digital advertising circumstances. Key sectors in this evolution include social media platforms, which allows global interaction, content sharing, and marketing. Using broad user data, some social media platforms no longer solely focus on communication and entertainment but are used to target marketing.
Some leading businesses in this realm include Alphabet Inc., which specializes in internet advertising and cloud computing. In a similar way Amazon has provides cloud computing and video streaming. Apple, with its impact on smartphone operating systems and AR/VR technologies. There also exist multiple fresh competitors, including Snap Inc., Byte Dance (TikTok), Twitter, Tencent, Netflix, Pinterest, Reddit, and Discord.
Meta Platforms, Inc., is one of the largest U.S. IT companies with headquarters in California. The company owns and controls Facebook, Instagram, Threads and WhatsApp. Meta Platform, Inc. was originally founded by Mark Zuckerberg and his colleagues at Harvard University, known as "The Facebook." In 2006, the platform grew rapidly and opened to the public, changed its name to Facebook, Inc. and by the end of 2012 its user base reached 1 billion usages, providing a solid and stable foundation for future growth. Facebook's initial public offering was in 2012, with a market value over $100 billion.
Meta operates mainly in several key sectors. In the field of social media, Meta provides social interaction, content sharing and advertising services to billions of users worldwide. Under the Oculus brand, Meta promotes VR and AR technologies that transform communication and entertainment experiences. And as a leading digital advertising platform, Meta exploits its wide user base and ad platform to provide targeted advertising and brand marketing services.
This paper employs a multifaceted approach, incorporating financial statement analysis, risk and return metrics, and relative valuation techniques. In this research, gross margin, operating margin, and debt-equity ratio are used to evaluate efficiency in operations and financial stability. Additionally, annual return, volatility, Sharpe ratio and beta value are used to determine risk and return. Thus, those figures provide information about stock performance stability and investor returns [1,2]. Additionally, Damodaran pointed out that multiples such as P/E and EV/EBITDA are useful in evaluating major technology companies [3]. Wahlen et al. emphasized the importance of financial variables in determining growth potential through relative valuation [4]. This research can act as a reference for people who are considering buying Meta’s stock.
2. Theoretical Framework
2.1. The Indicators Used In META’s Financial Statement
2.1.1. Gross Margin
Gross margin is the percentage of a company's revenue that's retained after direct expenses such as labor and materials have been subtracted.
\( gross margin=\frac{gross profit}{sales}=\frac{revenue-costs of good sold}{sales} \) (1)
2.1.2. Operating Margin
Operating margin, also known as return on sales, is an important profitability ratio measuring revenue after the deduction of operating expenses.
\( operating margin=\frac{operating margin}{sales}=\frac{revenue-COGS-SGA-DA}{sales} \) (2)
2.1.3. Current Ratio
Current ratio compares a firm’s current assets and current liabilities to assess whether the firm has sufficient working capital to meet its short-term needs.
\( current ratio=\frac{current asset}{current liabilities} \) (3)
2.1.4. Debt-Equity Ratio
The debt-to-equity (D/E) ratio is used to evaluate a company’s financial leverage and is calculated by dividing a company’s total liabilities by its shareholder equity. The D/E ratio is an important metric in corporate finance. It is a measure of the degree to which a company is financing its operations with debt rather than its own resources [5].
\( DE ratio=\frac{total debt}{total equity} \) (4)
2.2. The Indicators Used on The Assessment of Risk And Return
2.2.1. Annual Return
An annual return is the return that an investment provides over time. It's expressed as a time-weighted annual percentage. Sources of returns can include dividends, returns of capital and capital appreciation [6].
\( Annualized Return={(\frac{final value}{initial value})^{\frac{1}{number}of years}}-1 \) (5)
2.2.2. Volatility & Standard Deviation
Volatility (usually denoted by σ) is a statistical measure of the dispersion of returns for a given security or market index. It is often measured from either the standard deviation or variance between those returns. In most cases, the higher the volatility, the riskier the security [7].
\( σ=\sqrt[]{\frac{\sum {(xi-μ)^{2}}}{N}} \) (6)
Standard Deviation is a measure of the amount of variation of a set of values.
Annualized volatility is used to quantify the risk of an investment or a portfolio by indicating how much the value of an investment is likely to fluctuate over a year. The higher the annualized volatility, the greater the risk of the investment.
2.2.3. Sharpe Ratio
Sharpe ratio is a way to measure the performance of an investment by taking risk into account. It can be used to evaluate a single security or an entire investment portfolio. In either case, the higher the ratio, the better the investment in terms of risk-adjusted returns [8].
\( Sharpe Ratio=\frac{Rp-Rf}{σp} \) (7)
2.2.4. Beta
Beta (β) is the second letter of the Greek alphabet used in finance to denote the volatility or systematic risk of a security or portfolio compared to the market, usually the S&P 500 which has a beta of 1.0. Stocks with betas higher than 1.0 are interpreted as more volatile than the S&P 500 Beta (β) assesses a firm’s sensitivity to systematic risk and is used in the capital asset pricing model (CAPM).
\( Bi=\frac{Cov(ri,rm)}{{σ^{2}}(rm)} \) (8)
Where, Ri is the return on an individual stock, Rm=the return on the overall market, Covariance shows how changes in a stock’s returns are related to changes in the market’s returns, and variance indicates how far the market’s data points spread out from their average value.
2.3. The Method and Formula Used in Valuation
Relative Valuation. Relative Valuation is a very useful and effective tool in pricing a firm’s stock when it has comparable firms. There are several popular multiples that can be used, such as EV/Sales, EV/EBITDA, EB/EBIT and P/E ratios.
The Data Needed in Relative Valuation. Enterprise Value (EV), Sales, EBITDA(earnings before interest, taxes, depreciation and amortization), EBIT (Operating income) , share prices, EPS(earnings per share).
The formula used in relative valuation. Forward P/E is the P/E multiple computed based on its forward earnings (over the next twelve months.),while trailing P/E is based on trailing earnings (over the prior 12months). For valuation purposes, the forward P/E is generally preferred, as we are most concerned about future earnings.
\( EPS=\frac{net income}{number of shares outstanding} \) (9)
\( PE ratio=\frac{share price}{EPS}=\frac{market capitalization}{net income} \) (10)
2.3.1. Evaluation
This method is quick and easy to complete. It is suitable for generic companies with many competitors. Also, many people can easily understand. However, relative valuation requires similar companies to compare to (apples to oranges possible). It would be influenced by temporary factors and not reflect intrinsic value.
2.4. DCF model
Discounted cash flow (DCF) refers to a valuation method that estimates the enterprise value of a firm using its discounted future free cash flows.
The data needed in relative valuation. Free cash flow (FCF), present value(PV), net present value (NPV), terminal value (TV), discount rate, enterprise value (EV), equity value, net debt, share outstanding, net working capital (NWC),weighted average cost of capital (WACC).
Capital Asset Pricing Model (CAPM).
\( Ri=Rf+βi×(Rm-Rf) \) (11)
The Formula Used in DCF Model.
\( V0=\frac{FCF1}{1+rWacc}+\frac{FCF2}{{(1+rWacc)^{2}}}+…+\frac{FCFN+VN}{{(1+rWacc)^{N}}} \) (12)
\( VN=\frac{FCF(N+1)}{rWacc-gFCF}=(\frac{1+gFCF}{rWacc-gFCF})×FCFN \) (13)
Evaluation. DCF model is highly detailed, projecting all cash flows. It is suitable for companies with stable cash flows and doesn’t require comparable companies. However, the DCF model in real case is much more complicated. And it needs much more data, which might take too much time and energy. So we choose relative valuation in our report instead of DCF model.
3. Results And Discussion
3.1. Financial Statement Analysis
3.1.1. Profitability: Gross margin
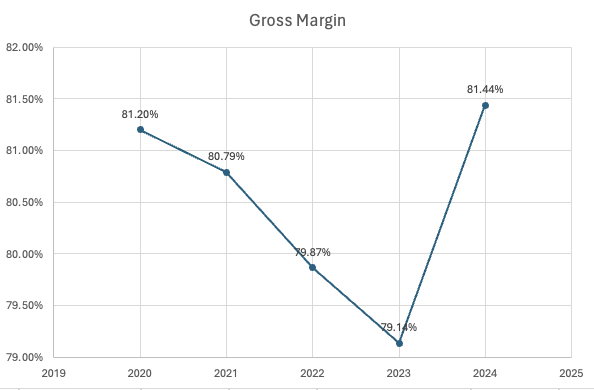
As shown in figure 1, Meta's gross profit will increase significantly from 2023 to 2024 after decreasing from 2020 to 2023. Reducing the variable costs associated with manufacturing products is a strategy to increase gross profit margins. This can be achieved by improving production efficiency or reducing raw material costs. A good technique to reduce raw material costs is to use less raw materials. If Meta purchases raw materials in bulk from its suppliers, there is a high probability that the suppliers will provide Meta with special discounts. However, if the company decides to increase prices, sales may be affected. If the company's sales decrease significantly, total revenue may not be enough to pay for operating expenses.
Figure 1: Gross margin of Meta from 2020 to 2024. |
Figure 2: Gross Margin of Meta, Apple, Amazon, and Google (Alphabet) from 2020 to 2024. |
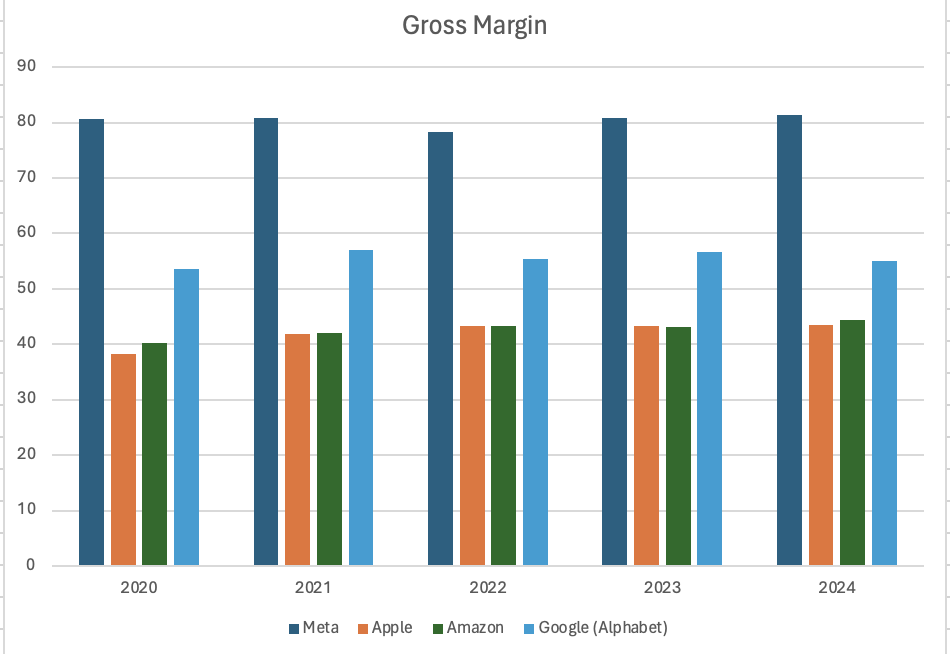
The figure 2 compares the gross margin of Meta to those of the other three comparable firms, Apple, Amazon and Google (Alphabet). From the graph provided, it is evident that Meta stands out among its competitors with the highest gross margins consistently from 2020 to 2024. Meta’s gross margins hover around 80% to 82%, indicating a strong cost efficiency and ability to convert sales into substantial profits.
This performance surpasses that of Google (Alphabet), which averages between 53% to 56%. Apple and Amazon, on the other hand, show similar trends with gross margins around 40% to 44% and remains significantly lower than Meta’s and Google’s. Overall, Meta's ability to maintain such high gross margins consistently places it in a leading position in terms of profitability, demonstrating its strong market strategy and operational efficiency.
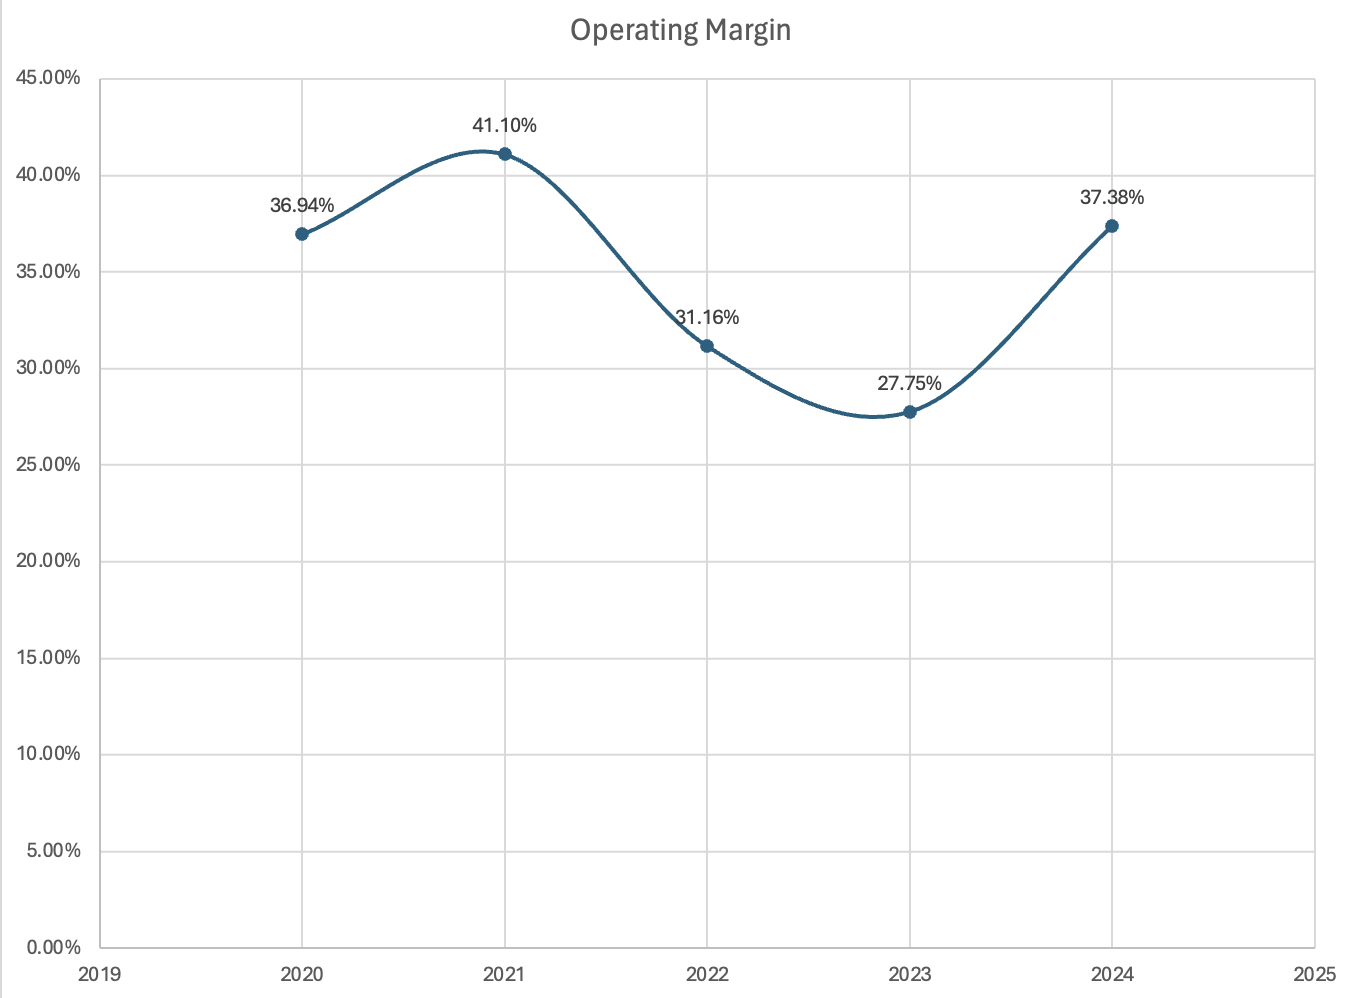
The figure 3 shows Meta's operating margin from 2020 to 2024. Meta's operating rate has risen from 36.94% in 2020 to 41.10% in 2021, a sign that operating efficiency has improved. But in 2022 and 2023, there was a remarkable drop to 31.16% and 27.75%, respectively, possibly due to lower sales or higher operating costs. Operating interest rates rose to 37.38% by 2024, suggesting better revenue growth or spending control. This model shows how inconsistent Meta's performance has been over the years.
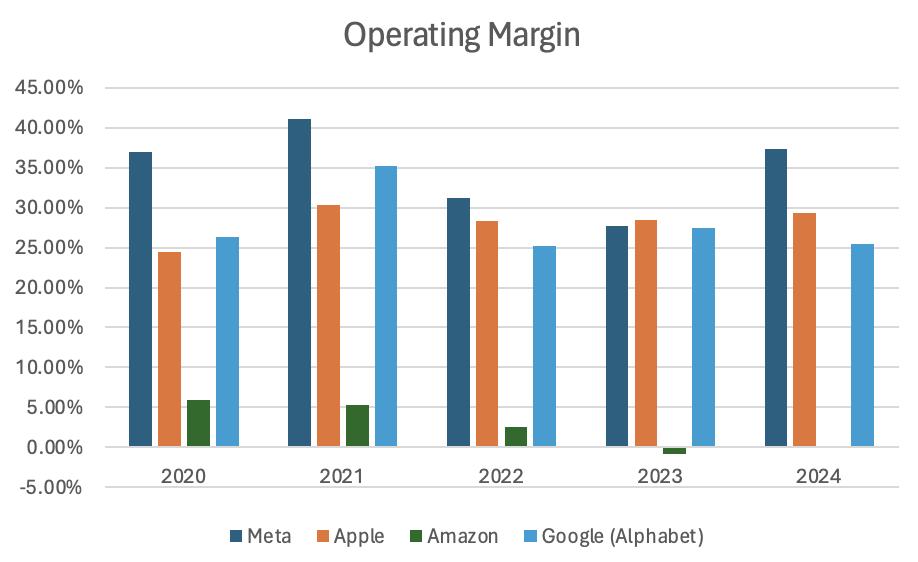
The operating margins of Meta, Apple, Amazon, and Google (Alphabet) are shown in the figure 4, from 2020 to 2024. Meta has demonstrated a robust operating margin, reaching a high of 40.75% in 2021 and continuing to do so, even after a decline in 2022 and 2023 to 36.18% in 2024. Apple has demonstrated steady performance as well, with margins rising from 24.48% in 2020 to 29.30% in 2024. Google's operating margin reached its highest point in 2021 (35.22%), fluctuated a little but remained strong in 2024 (25.49%). Amazon's margins, on the other hand, exhibit notable fluctuation; they begin at 5.93% in 2020, fall to -0.84% in 2023, and then marginally recover to -0.10% in 2024. This comparison demonstrates the consistency and effectiveness of Apple and Meta in preserving large operating margins.
Figure 3: Operating Margin of Meta from 2020 to 2024. |
Figure 4: Operating margin of Meta, Apple, Amazon, and Google (Alphabet) from 2020 to 2024 |
3.1.2. Leverage: Debt-equity Ratio
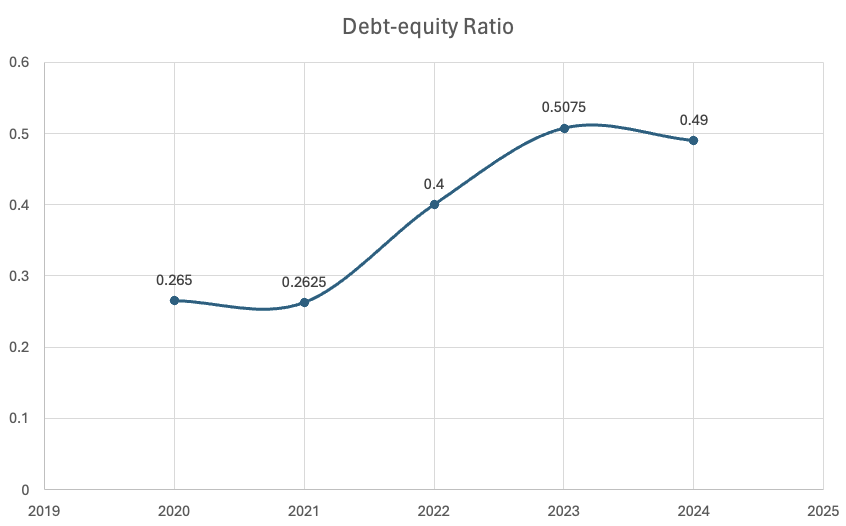
The figure 5 shows the debt-equity ratio of the meta for the period 2020-2024 and shows an increasing trend during this period. The ratio was 0.265 in 2020, and slightly decreased to 0.2625 in 2021. There has been significant growth since 2021, rising to 0.4 per cent in 2022 and 0.5075 per cent in 2023. This ratio has been slightly reduced to 0.49 by 2024. This trend indicates that Meta is increasing its use of debt and stocks, reaching its peak in 2023. A slight decrease in 2024 indicates that the debt level has stabilized or decreased. Overall, Meta's financial returns have grown significantly over the years.
Figure 5: Debt-equity ratio of Meta from 2020 to 2024 |
Figure 6: Debt-equity ratio of Meta, Apple, Amazon and Google (Alphabet) from 2020 to 2024 |
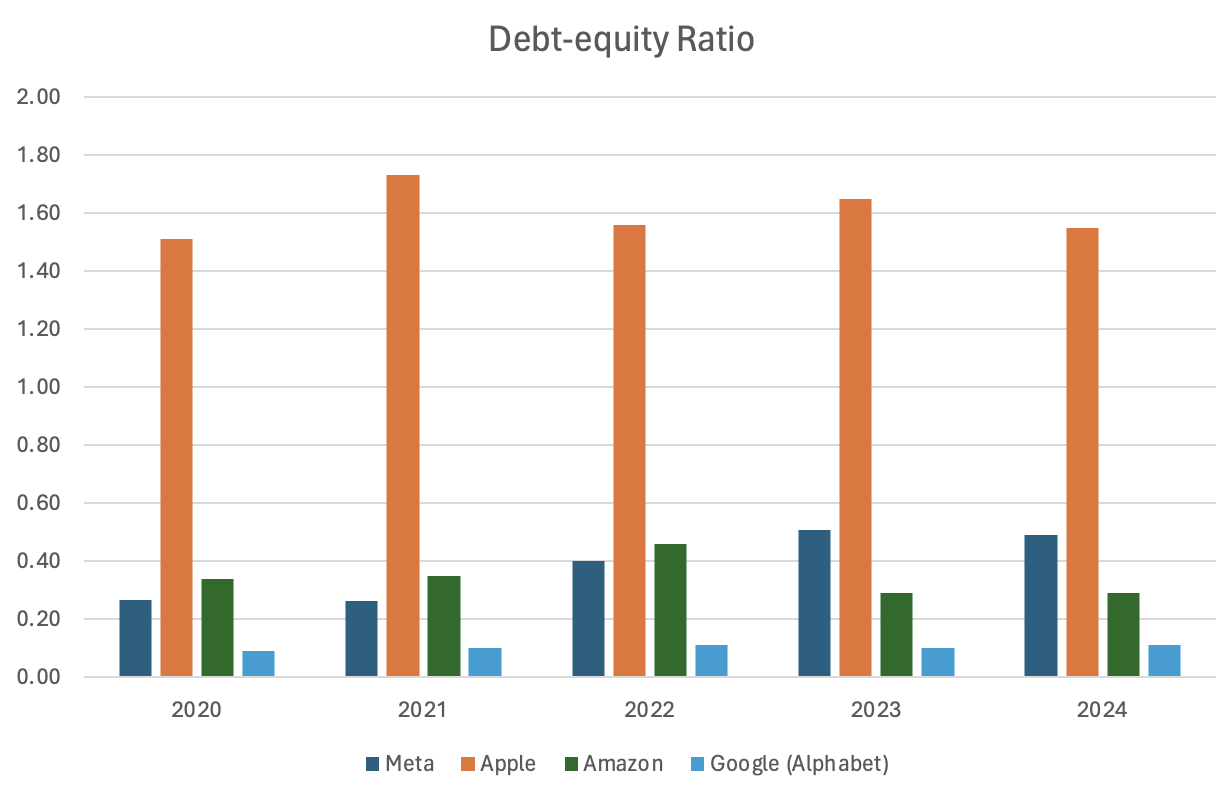
The credit ratio of Google, Apple, Amazon, and Meta between 2020 and 2024 is mentioned in the chart. With a rate ranging from 1.4 to 1.7, Apple had the highest, a sign of its excessive reliance on debt. The range of Amazon's prices, which represent the approach of balancing debt and equity, is 0.3 to 0.4. Google dropped below 0.1 during that time, but Meta rose from 0.2 to 0.4. More than Meta and Google, but less than Apple, are associated with low-risk, conservative financial tactics. Apple is associated with larger financial risks but also with bigger potential rewards. Amazon is positioned in the middle, with balanced finance and low risk (figure 6).
3.1.3. Liquidity-Current Ratio
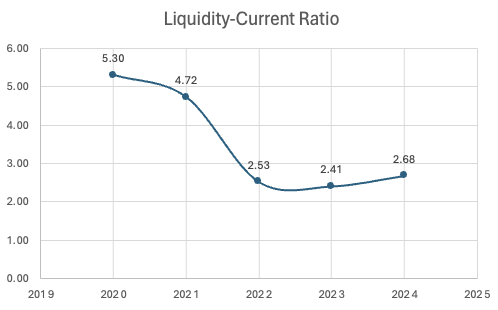
This figure 7 illustrates the liquidity-current ratio from 2020 to 2024. Starting at a high of 5.30 in 2020, the ratio indicates a strong liquidity position. However, a significant downward trend is observed, with the ratio dropping to 4.72 in 2021, 2.53 in 2022, and reaching a low of 2.41 in 2023. This decline suggests that the company's ability to cover its short-term liabilities with its short-term assets has weakened over these years. In 2024, there is a slight improvement, with the ratio rising to 2.68, indicating a modest recovery in liquidity. Overall, the graph shows a concerning decrease in liquidity, with a minor uptick towards the end.
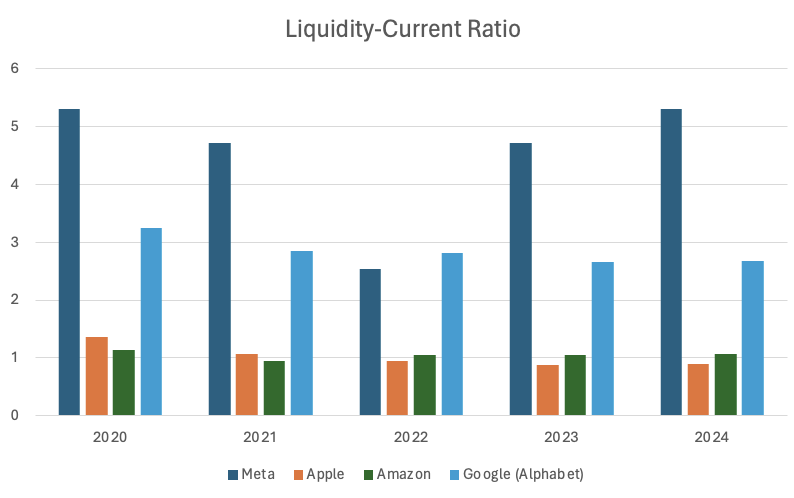
Figure 8 compares the liquidity-current ratios of Meta, Apple, Amazon, and Google from 2020 to 2024. Meta consistently demonstrates the highest liquidity among the four companies, with a peak ratio of 5.30 in 2020, though it declines to 2.82 by 2024. This indicates a strong initial ability to cover short-term obligations, despite a decreasing trend. Overall, Meta stands out with the highest liquidity, followed by Google, while Apple and Amazon lag behind, indicating more constrained liquidity positions.
Figure 7: Liquidity-current ratio of Meta from 2020 to 2024 |
Figure 8: Liquidity-current ratio of Meta, Apple, Amazon, and Google (Alphabet) from 2020 to 2024 |
3.2. Risk and Return
3.2.1. Annualized Return
The figure 9 shows that the annualized returns for Meta, Apple, Google , and Amazon. Meta experienced significant fluctuations in 2022, but began to recover in 2023, reflecting the recovery after encountering challenges. Apple’s returns are relatively stable, despite market fluctuations in 2022. Google’s strong performance in advertising and cloud has driven to a significant increase in its returns. Amazon’s revenue fell after 2020, mainly due to increased competition and investment pressure. Overall, these companies’ profit trends highlight different reactions to market conditions and strategic changes.
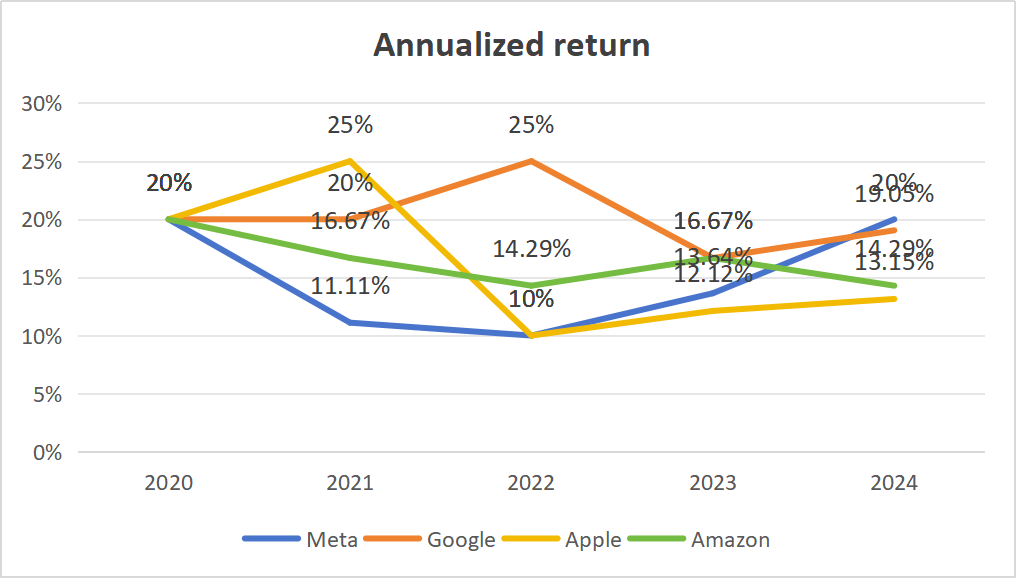
Figure 9: Annualized return of Meta from 2020 to 2024
3.2.2. Annualized Volatility
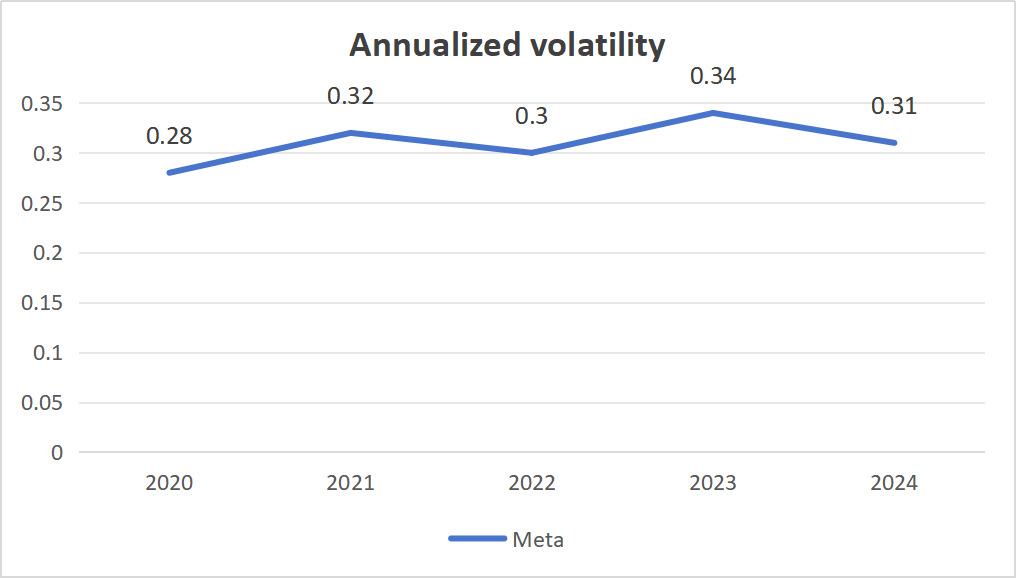
According to the figure 10, the annualized volatility, which measures risk, fluctuated continuously. Meta's volatility shows a notable increase from 0.28 in 2020 to a peak of 0.34 in 2023, before slightly decreasing to 0.31 in 2024. This indicates that Meta experienced heightened price fluctuations during this period, possibly due to market reactions to their business pivots and external factors affecting the tech industry.
Meta's volatility peaked in 2023, reflecting significant market uncertainty and reaction to company-specific developments. And the decrease in volatility from 2023 to 2024 suggests that Meta's strategic initiatives began to yield more predictable results, and investor confidence stabilized.
Figure 10: Annualized volatility of Meta from 2020 to 2024 |
Figure 11: Annualized volatility of Meta, Apple, Amazon and Google (Alphabet) from 2020 to 2024 |
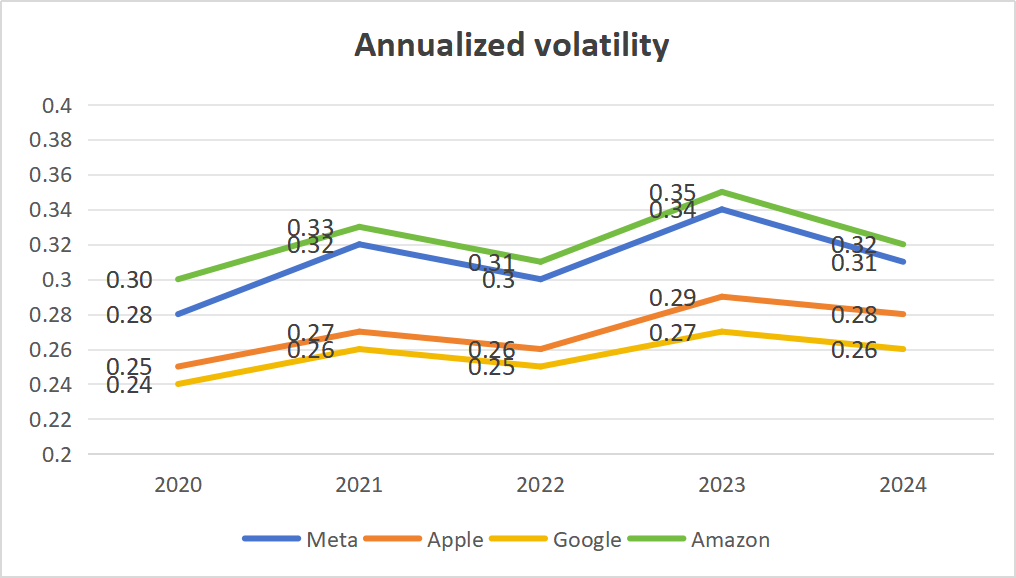
As shown in figure 11. the annualized volatility data for Meta, Apple, Google, and Amazon from 2020 to 2024 is visualized in the line chart above. Volatility is a measure of the price fluctuations of a company's stock and is an indicator of risk. Meta's volatility shows a notable increase from 0.28 in 2020 to a peak of 0.34 in 2023, before slightly decreasing to 0.31 in 2024. This indicates that Meta experienced heightened price fluctuations during this period, possibly due to market reactions to their business pivots and external factors affecting the tech industry.
All companies except Google will experience high volatility in 2023. This could lead to global financial uncertainty, market changes or certain corporate events. Google has the lowest volatility, is more stable, and shows risk management and market flexibility. Meta and Amazon confirmed a fall in share prices, confirming price sensitivity to market conditions and company prospects.
3.2.3. Sharpe Ratio
Meta's Sharpe Ratio performed best in 2020, followed by year-on-year declines, especially in 2022.This indicates that the company faced significant market pressure during the year. And the Sharpe Ratio has recovered in 2023 and 2024 but is still below the 2020 level (figure 12). This indicates that the company's risk adjustment returns have fluctuated in recent years.
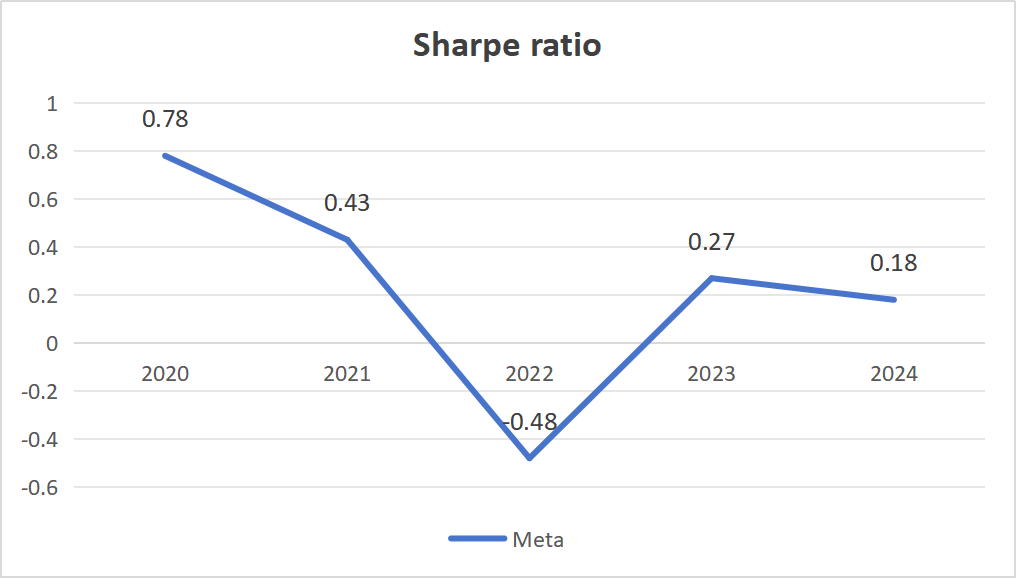
Figure 12: Sharpe ratio of Meta from 2020 to 2024
3.2.4. Beta
Beta measures the sensitivity of companies to systemic risk, while Meta Beta, larger than 1.0, shows that stocks are more volatile than the wider market. Meta has a Beta 1.15, which means that any stock with a Bitcoin higher than 1.0 should have a higher risk, but a higher return potential. And a beta less than 0, indicates an inverse relation to the market, which is an investment that tends to increase in price when the general market price falls.
3.3. Relative Valuation
The relative valuation method compares the implicit share price of Meta with the actual share price. According to the chart above, Meta is currently undervalued based on multiplier relative valuation using the EV/Sales, EV/EBITDA, and P/E ratios. The shareholders were of the view that the shareholder's position might be below the level it should. However, as one of the world's largest social media companies, there is no doubt that Meta has broad growth prospects. The shareholder's irrational negative will underestimate the share price. It is noteworthy that the above pricing method restricts the price of Meta's shares, as it covers a wide range of industries and therefore holds an irreplaceable position among social media companies.
Table 1: EV/Sales, EV/EBITDA, and P/E ratios for Meta’s peer groups
Peer Group | EV/sales | EV/EBITDA | P/E |
Apple | 9.1 | 26.8 | 35.2 |
Google (Alphabet) | 6.9 | 19.9 | 27.9 |
Amazon | 3.51 | 21.17 | 51.51 |
Mean | 6.50 | 22.62 | 38.20 |
Table 2: Valuation of Meta
Implied META Enterprise Value | $877.95 billion | $1312.15 billion | $1489.93 illion |
Net Debt | $18.39 billion | $18.39 billion | $18.39 billion |
Implied META Equity Value | $859.56 billion | $1293.76 billion | $1471.54 billion |
Share price | $299 | ||
Implied META Share Price | 326.9532141 | 492.1110688 | 559.7337391 |
Is META overvalued based on comps? | No | No | No |
4. Conclusion
With a sample period lasting from 2020 to 2024, this project was initiated with the goal of assessing META's financial performance in 2024. Based on this study analysis, META is underrated.
Firstly, reviewing financial documents, META's gross profit margin increased between 2023 and 2024 after dropping from 2020 and 2023. Additionally, the operating margin continues to move upward, illustrating that the business has been more profitable as well as effective in its operations throughout the past several years. Over the last five years, META's leverage has decreased, and its Debt-Equity ratio has remained much lower, suggesting that the firm has been less debt-reliant. Additionally, the company's current ratio has declined since 2019, suggesting an ongoing fall in the capital liquidity.
Regarding assessing the firm’s risk and return, the annualized return of META experienced significant fluctuations in 2022 but began to recover in 2023.The annualized volatility of META fluctuated very little, indicating that the volatility of META's stock is relatively stable. Moreover, META’s Sharpe ratio has also fallen significantly during 2020 to 2022, and it has recovered in 2023 and 2024, which means the return of META investors can get is becoming lower and lower for each unit of risk they bear.
Finally, with relative valuation, the actual share price of META is much lower than the implied price, which suggests that META is undervalued based on comps. And this may be due to factors such as negative market sentiment, operational challenges, or economic conditions that diverge from optimistic valuation assumptions.
However, there were some limitations in this study, such as the sample years is not large, and assumptions are required, and terminal value is difficult to determine in DCF model. In the future study, it can be further improved to value the company.
References
[1]. Sharpe, W. F. (1994). Risk and return analysis: A comprehensive approach. Financial Analysts Journal, 50(2), 56-67.
[2]. Graham, J. R., & Harvey, C. R. (2001). The theory and practice of corporate finance: Evidence from the field. Journal of Financial Economics, 60(2-3), 187-243.
[3]. Damodaran, A. (2006). Valuation using multiple valuation models. Journal of Finance, 61(4), 1755-1790.
[4]. Wahlen, J. M., Baginski, S. P., & Bradshaw, M. T. (2017). Financial Reporting, Financial Statement Analysis and Valuation: A Strategic Perspective (9th ed.). Cengage Learning.
[5]. Fernando, Jason. “Debt-to-Equity (D/E) Ratio Formula and How to Interpret It.” Investopedia, 6 Mar. 2024, www.investopedia.com/terms/d/debtequityratio.asp.
[6]. Chen, James. “What Is Annual Return? Definition and Example Calculation.” Investopedia, 2 Dec. 2023, www.investopedia.com/terms/a/annual-return.asp.
[7]. Hayes, Adam. “Volatility: Meaning in Finance and How It Works With Stocks.” Investopedia, 3 July 2024, www.investopedia.com/terms/v/volatility.asp.
[8]. Baldridge, Rebecca. “Understanding the Sharpe Ratio.” Forbes Advisor, 27 Feb.
Cite this article
Wang,S. (2025). Research on the Investment Value of META Based on Financial Analysis, Risk and Return Analysis, Valuation Method. Advances in Economics, Management and Political Sciences,152,188-197.
Data availability
The datasets used and/or analyzed during the current study will be available from the authors upon reasonable request.
Disclaimer/Publisher's Note
The statements, opinions and data contained in all publications are solely those of the individual author(s) and contributor(s) and not of EWA Publishing and/or the editor(s). EWA Publishing and/or the editor(s) disclaim responsibility for any injury to people or property resulting from any ideas, methods, instructions or products referred to in the content.
About volume
Volume title: Proceedings of the 3rd International Conference on Financial Technology and Business Analysis
© 2024 by the author(s). Licensee EWA Publishing, Oxford, UK. This article is an open access article distributed under the terms and
conditions of the Creative Commons Attribution (CC BY) license. Authors who
publish this series agree to the following terms:
1. Authors retain copyright and grant the series right of first publication with the work simultaneously licensed under a Creative Commons
Attribution License that allows others to share the work with an acknowledgment of the work's authorship and initial publication in this
series.
2. Authors are able to enter into separate, additional contractual arrangements for the non-exclusive distribution of the series's published
version of the work (e.g., post it to an institutional repository or publish it in a book), with an acknowledgment of its initial
publication in this series.
3. Authors are permitted and encouraged to post their work online (e.g., in institutional repositories or on their website) prior to and
during the submission process, as it can lead to productive exchanges, as well as earlier and greater citation of published work (See
Open access policy for details).
References
[1]. Sharpe, W. F. (1994). Risk and return analysis: A comprehensive approach. Financial Analysts Journal, 50(2), 56-67.
[2]. Graham, J. R., & Harvey, C. R. (2001). The theory and practice of corporate finance: Evidence from the field. Journal of Financial Economics, 60(2-3), 187-243.
[3]. Damodaran, A. (2006). Valuation using multiple valuation models. Journal of Finance, 61(4), 1755-1790.
[4]. Wahlen, J. M., Baginski, S. P., & Bradshaw, M. T. (2017). Financial Reporting, Financial Statement Analysis and Valuation: A Strategic Perspective (9th ed.). Cengage Learning.
[5]. Fernando, Jason. “Debt-to-Equity (D/E) Ratio Formula and How to Interpret It.” Investopedia, 6 Mar. 2024, www.investopedia.com/terms/d/debtequityratio.asp.
[6]. Chen, James. “What Is Annual Return? Definition and Example Calculation.” Investopedia, 2 Dec. 2023, www.investopedia.com/terms/a/annual-return.asp.
[7]. Hayes, Adam. “Volatility: Meaning in Finance and How It Works With Stocks.” Investopedia, 3 July 2024, www.investopedia.com/terms/v/volatility.asp.
[8]. Baldridge, Rebecca. “Understanding the Sharpe Ratio.” Forbes Advisor, 27 Feb.