


1. Introduction
Supply chain performance can be significantly affected by problems like fraudulent orders and late deliveries, which lead to inefficiencies and higher costs. Identifying and predicting these risks is crucial for effective supply chain management.
In recent years, artificial intelligence (AI) and machine learning (ML) have opened up new ways to address these issues. These technologies help identify patterns and predict risks, allowing supply chain managers to act before problems get worse. Decision trees, in particular, are especially useful because they provide a clear and easy-to-understand approach to decision-making. They help uncover key factors contributing to fraud or delivery delays. Also, decision trees are great at handling complex, non-linear relationships within the data, which is important given how complex supply chains can be. As supply chains become more data-driven, decision trees can quickly adapt to new risks or changing patterns, allowing companies to make better, real-time decisions.
All risk sources (supply chain risk observed variables) affect organizational performance significantly.[1] Fraudulent orders and late deliveries have been ongoing challenges for supply chains. Many studies have examined their negative impact, showing how they can cause significant financial losses and disrupt operations. For instance, fraudulent activities can undermine the overall stability of the supply chain [2]. Delayed deliveries disrupt production schedules, drive up costs, and damage customer satisfaction [3]. Historically, companies have relied on manual reviews or rule-based systems to detect fraud, but these approaches struggle to handle the complexity of today’s supply chains. These traditional methods often fail when dealing with large datasets and rapidly shifting circumstances [4]. Likewise, older methods for managing late deliveries often can’t respond quickly enough to disruptions as they happen. Machine learning offers better flexibility and higher accuracy in detecting these risks. Furthermore, machine learning can process large volumes of data at a speed and scale unattainable by manual methods, enabling proactive and real-time monitoring. For instance, Aljohani et al. demonstrated that machine learning models, when integrated with predictive analytics for real-time supply chain risk management, achieved a 30% improvement in detection accuracy over traditional methods. This approach supports early risk identification, enhancing supply chain agility and minimizing response delays due to manual processes [5].
This study aims to apply machine learning, specifically decision tree models, to detect and predict fraudulent orders and late deliveries. Dataco supply chain context will be used as an experimental example. This analysis demonstrates how AI can improve risk management within supply chains, helping not only to mitigate risks but also to enhance operational efficiency.
2. Materials and Methods
2.1. Dataset
The dataset used in this study comes from DataCo Smart Supply Chain For Big Data Analysis. It was collected by researchers Fabian Constante and others and is available through the Mendeley database. This dataset contains 180435 transactions in a global supply chain and captures key information, including variables about customer, product, payment, sales, shipment, and delivery status. These variables offer valuable insights into supply chain management and are highly useful for tasks like predicting risks and detecting fraud or late deliveries using machine learning.
The dataset’s credibility comes from its wide usage in academic research and commercial projects. Its detailed coverage makes it ideal for real-world applications. This study uses it to detect and predict supply chain risks—like fraudulent orders and delayed deliveries—through a decision tree model. The goal is to improve supply chain management by identifying potential risks and providing smarter, data-driven solutions.
2.2. Machine Learning Model
The decision tree is a basic classification and regression method, which belongs to supervised learning. The decision tree algorithm uses recursive partitioning to systematically select features that maximize information gain at each node [6]. It is a tree structure and each internal node represents a judgment on an attribute. Each branch represents the output of a judgment result, and finally, each leaf node represents a classification result. Its essence is a tree composed of multiple judgment nodes.
The first step of the decision tree algorithm is feature selection. Feature selection will screen out features with a high correlation with the classification result, that is, features with strong classification ability for judgment. This ability is available to do feature importance. Then, after selecting features, it will calculate the entropy of every feature from the base node. Entropy is used to measure the uncertainty or disorder within a dataset, and it is defined as follows:
\( H(D)=-\sum _{i=1}^{n}{p_{i}}{log_{2}}{p_{i }} \) (1)
Here, \( H(D) \) is the entropy of data \( D \) , \( {p_{i}} \) is the proportion of class \( i \) in the dataset, and \( n \) is the total number of classes.
Higher entropy indicates more disorder, while lower entropy indicates more uniformity in the data. To build the tree, we aim to find the feature that leads to the greatest reduction in entropy. This reduction is quantified using information gain. For any feature A, information gain is defined as follows:
\( IG(D,A)=H(D)-\sum _{v∈Values(A)}\frac{|{D_{v}}|}{|D|}H({D_{v}}) \) (2)
Here, \( IG(D,A) \) is the information gain achieved by splitting dataset \( D \) based on feature \( A \) . \( {D_{v}} \) represents the subset of \( D \) where feature \( A \) has value \( v \) .
The features having the highest information gain will be the node features. Child nodes will create based on them. The last step is decision tree pruning which aims to decrease the risk of overfitting. By recursively executing the above process, a decision tree can be created.
2.3. Performance Evaluation
Accuracy is the proportion of correctly predicted samples to the total samples, calculated as:
\( Accuracy=\frac{True Positives+True Negatives}{Total Samples}=\frac{TP+TN}{TP+TN+FP+FN} \) (3)
Here, True Positives (TP) refer to the samples correctly predicted as positive, True Negatives (TN) are the samples correctly predicted as negative, False Positives (FP) are the negative samples incorrectly predicted as positive, and False Negatives (FN) are the positive samples incorrectly predicted as negative.
Precision indicates the ratio of actual positive samples among all predicted positive samples, calculated as:
\( Precision=\frac{TP}{TP+FP} \) (4)
Recall measures the proportion of correctly predicted positive samples among all actual positive samples, calculated as:
\( Recall=\frac{TP}{TP+FN} \) (5)
F1-score is the harmonic mean of precision and recall, providing a balance between the two metrics, calculated as:
\( F1-score=2×\frac{Precision×Recall}{Precision+Recall} \) (6)
AUC-ROC is a method used to evaluate the effectiveness of binary classification models. The AUC score serves as a single metric that combines all performance information while adjusting for class imbalances in datasets [7]. In this evaluation, the threshold is the key value that determines the classification of each sample, assigning it to one class or another. The ROC curve then plots model performance across varying thresholds, with the x-axis representing the false positive (FP) rate and the y-axis representing the true positive (TP) rate. The AUC score, or the area under the ROC curve, quantifies the model's capacity to distinguish between classes. A score closer to 1 indicates that the model is highly effective at distinguishing between positive and negative samples.
3. Results
3.1. Data Preprocessing
There are some missing records in the dataco smart supply chain, so the first step is to drop null values. Then, because the supply chain information is dispersive and complex to some extent, do integration and simplification are needed. So an exploratory phase is conducted to select and engineer potential features that can act as useful predictors of disruptions [8]. Scattered information is integrated and new target variables are created. In the simplification process, a subset of relevant columns is selected for further analysis, focusing on essential features like customer details, product information, and order status. A heatmap is generated to visualize the correlation between the variables, which helps in identifying potential relationships and key predictors for fraud and delivery delays in advance.
To prepare the data for machine learning models, feature engineering steps are applied. Fields demonstrate dates are converted to a datetime format and a new field is created to capture the difference in days between order placement and shipping. Other categorical variables are encoded using a LabelEncoder to convert them into numeric form.
3.2. Risk Factors Analysis
Perform feature importance analysis for the ‘fraud’ variable using a decision tree model can detect significant factors that cause fraudulent orders. The importance value for each feature can be calculated by summarizing the gains contributed by that feature across all splits in the tree. The scores for all features can be organized into a ranking, helping to identify which features play a crucial role in the model.
Based on the examination of Figure 1, it can be concluded that factors about customer identity, shipment days, and payment type are highly associated with fraud status relatively.
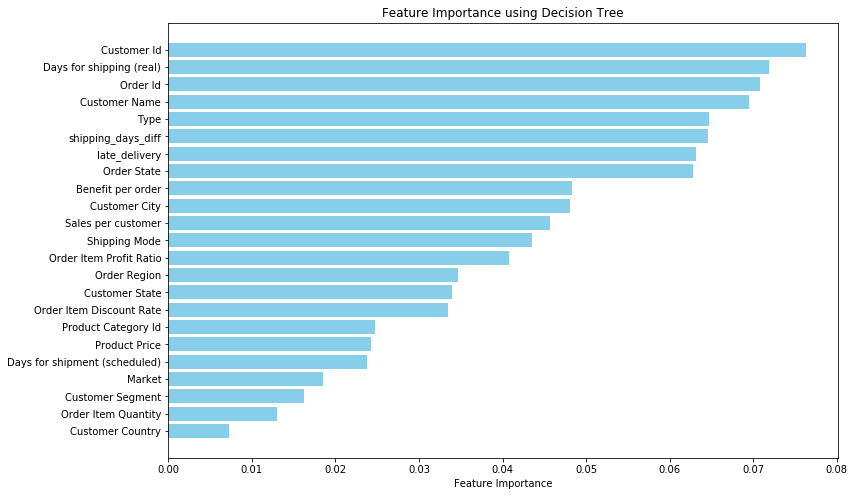
Figure 1: Feature importance for fraud orders (Picture credit: Original)
By visualizing and analyzing these important factors of fraudulent risks, it can be found that several customers cause the majority of fraudulent orders. In the electronic market, the production and loss of speed of products in the line are rapid. At the same time, the role of suppliers and consumers of products is difficult to identify [9]. This means that there is the possibility that these customers are intended to make profits by engaging in disruptive behavior, such ast ordering a large number of non-paid orders.
During the whole operation of the supply chain, these abnormal situations failed to be recognized. If the customer does not pay the order in time after placing the order, the order may be delayed. This will be reflected in Days for shipping (real), so it is also a factor that needs to be pay attention to. Besides, according to the analysis of payment type, all the fraudulent orders are paid by transfer method. Companies should focus on the transfer-paid order during the inspection.
Performing feature importance analysis for the delayed delivery can detect significant factors that cause late delivery orders.
Based on the examination of Figure2, it can be concluded that factors about shipment days and shipping mode are highly associated with late delivery. This phenomenon accords with daily experience. When the shipping time becomes later and shipment days last longer, the risk of late delivery will be higher.
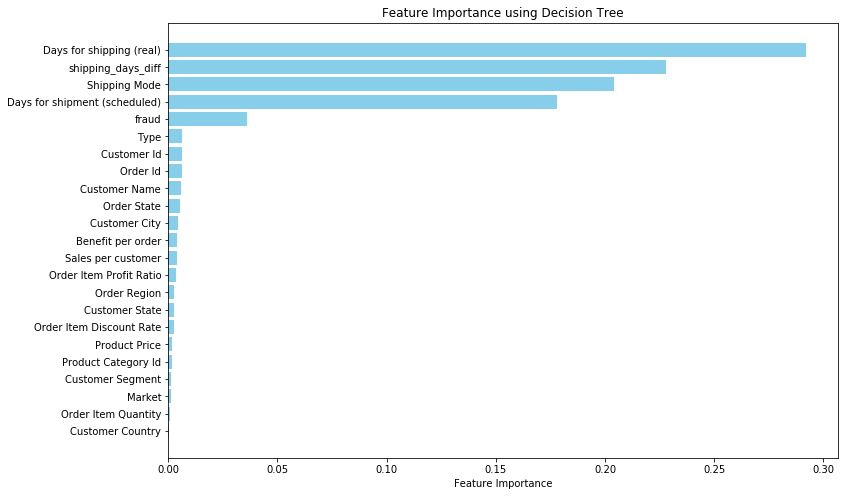
Figure 2: Feature importance for late delivered order (Picture credit: Original)
3.3. Model Building
Based on the feature importance analysis, feature selection can be done to reduce the dataset's dimensionality. By keeping only the most relevant features, can improve model performance and interpretability in the following model-building process. This research decides to retain 10 features except for target values (fraud and late_delivery). The features are customer ID, days for shipping(real), days for shipment (scheduled), order ID, type, shipping_days_diff, order state, benefit per order, sales per customer and shipping mode.
Create random training and test data sets, dividing the data into 70% training set and 30% test set. Use the above 2 target variables with the 10 attribute variables to build a decision tree model respectively.
3.4. Model Evaluation
Verify the prediction of the fraud-detect model in the test set to test the accuracy of the model and obtain the following confusion matrix in Table 1.
Table 1: Decision tree performance for fraud detection
Metrics | 0 | 1 | Macro Avy | Weighted Avg |
Precision | 1.00 | 0.82 | 0.91 | 0.99 |
Recall | 1.00 | 0.83 | 0.91 | 0.99 |
F-1-score | 1.00 | 0.82 | 0.91 | 0.99 |
Support | 50724 | 1157 | — | — |
Accuracy | 0.9921 |
The overall accuracy of the model is 0.9874, indicating strong predictive performance. This is because the number of non-fraud orders (50724) in the dataset is much larger than the number of fraud orders (1157). This imbalance makes the model tend to predict more non-fraud orders, resulting in a higher accuracy rate. AUC-ROC provides an unbiased evaluation across various score thresholds and is better suited for highly skewed datasets.[10] So AUC score is needed to evaluate performance and the ROC curve is shown in Figure3.
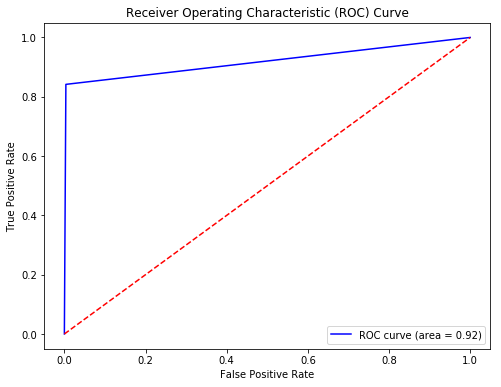
Figure 3: ROC curve for fraud detect decision tree model (Picture credit: Original)
The AUC score values 0.919053 means shows that decision tree model performs quite well in detecting fraudulent orders and can distinguish between fraudulent and non-fraudulent orders. And the result is consistent with the accuracy score, indicating that the model works well.
Verify the prediction of the late delivery-detect model in the test set to test the accuracy of the model and obtain the following confusion matrix in Table 2.
Table 2: Decision tree performance for late-delivered detection
Metrics | 0 | 1 | Macro Avy | Weighted Avg |
Precision | 0.83 | 0.85 | 0.84 | 0.84 |
Recall | 0.82 | 0.86 | 0.84 | 0.84 |
F-1-score | 0.82 | 0.85 | 0.84 | 0.84 |
Support | 23507 | 28374 | — | — |
Accuracy | 0.8404 |
The delivery-detect model is evaluated using the accuracy results, with an accuracy of 0.8404. It means the model works well.
4. Conclusion
Based on the example of Dataco smart supply chain, this study finds that fraud orders relate to specific customer identities with transfer payment method. Factors about shipment days and shipping mode are highly associated with late delivery phenomenon. This process of feature importance is analyzed using decision tree and the performances of the detection models are very well. The results show that decision tree model is a suitable artificial intelligence and machine learning model in detecting risks for supply chain because it is easy to understand and explain even though the information of supply chain is always very complicated.
Also, during the whole supply chain operation, many information are not transparent so there must be many missing values in the data. However, decision tree model is not sensitive to missing values. These findings could impact future research by showing how machine learning models, like decision trees, work well for risk detection in complex supply chains. Future studies could build on this by adapting the model to focus on specific industries or regions, where fraud or delivery delays might follow unique patterns. Additionally, researchers could test larger datasets with more diverse features or try hybrid models that combine decision trees with other algorithms to boost accuracy and reliability. Another area to explore could be the use of real-time data, like tracking information, to make fraud and delay predictions faster and more precise. Overall, this study opens up opportunities to apply artificial intelligence in deeper and more tailored ways in supply chain risk management.
References
[1]. Bavarsad, B., Boshagh, M.R., & Kayedian, A. (2014). A Study on Supply Chain Risk Factors and Their Impact on Organizational Performance.
[2]. Tang, C.S., & Musa, S.N. (2011). Identifying risk issues and research advancements in supply chain risk management. International Journal of Production Economics, 133(1), 25-34.
[3]. Hopp, W.J., & Spearman, M.L. (2008). Factory physics. Waveland Press.
[4]. Kumar, S., & Kshetri, N. (2016). Big data and its implications for supply chain management. Supply Chain Forum: An International Journal, 17(3), 156-162.
[5]. Aljohani, A. (2023). Predictive Analytics and Machine Learning for Real-Time Supply Chain Risk Mitigation and Agility. Sustainability, 15, 15088.
[6]. Quinlan, J. R. (1986). Induction of Decision Trees. Machine Learning, 1(1), 81–106.
[7]. Bradley, Andrew P. The use of the area under the ROC curve in the evaluation of machine learning algorithms. Pattern Recognit. 30 (1997): 1145-1159.
[8]. Brintrup, A., Pak, J., Ratiney, D., Pearce, T., Wichmann, P., Woodall, P., & McFarlane, D. (2019). Supply chain data analytics for predicting supplier disruptions: a case study in complex asset manufacturing. International Journal of Production Research, 58(11), 3330–3341.
[9]. Yang Jin. (2016). Research on Fraud Identification Model Based on Data Mining in E-commerc. Nanjing University.
[10]. McDermott, M., Zhang, H., Hansen, L., Angelotti, G., & Gallifant, J. (2020). A Closer Look at AUROC and AUPRC under Class Imbalance. In Advances in Neural Information Processing Systems (NeurIPS).
Cite this article
Liang,Y. (2025). Detecting and Predicting Supply Chain Risks: Fraud and Late Delivery Based on Decision Tree Models. Advances in Economics, Management and Political Sciences,153,40-46.
Data availability
The datasets used and/or analyzed during the current study will be available from the authors upon reasonable request.
Disclaimer/Publisher's Note
The statements, opinions and data contained in all publications are solely those of the individual author(s) and contributor(s) and not of EWA Publishing and/or the editor(s). EWA Publishing and/or the editor(s) disclaim responsibility for any injury to people or property resulting from any ideas, methods, instructions or products referred to in the content.
About volume
Volume title: Proceedings of the 3rd International Conference on Financial Technology and Business Analysis
© 2024 by the author(s). Licensee EWA Publishing, Oxford, UK. This article is an open access article distributed under the terms and
conditions of the Creative Commons Attribution (CC BY) license. Authors who
publish this series agree to the following terms:
1. Authors retain copyright and grant the series right of first publication with the work simultaneously licensed under a Creative Commons
Attribution License that allows others to share the work with an acknowledgment of the work's authorship and initial publication in this
series.
2. Authors are able to enter into separate, additional contractual arrangements for the non-exclusive distribution of the series's published
version of the work (e.g., post it to an institutional repository or publish it in a book), with an acknowledgment of its initial
publication in this series.
3. Authors are permitted and encouraged to post their work online (e.g., in institutional repositories or on their website) prior to and
during the submission process, as it can lead to productive exchanges, as well as earlier and greater citation of published work (See
Open access policy for details).
References
[1]. Bavarsad, B., Boshagh, M.R., & Kayedian, A. (2014). A Study on Supply Chain Risk Factors and Their Impact on Organizational Performance.
[2]. Tang, C.S., & Musa, S.N. (2011). Identifying risk issues and research advancements in supply chain risk management. International Journal of Production Economics, 133(1), 25-34.
[3]. Hopp, W.J., & Spearman, M.L. (2008). Factory physics. Waveland Press.
[4]. Kumar, S., & Kshetri, N. (2016). Big data and its implications for supply chain management. Supply Chain Forum: An International Journal, 17(3), 156-162.
[5]. Aljohani, A. (2023). Predictive Analytics and Machine Learning for Real-Time Supply Chain Risk Mitigation and Agility. Sustainability, 15, 15088.
[6]. Quinlan, J. R. (1986). Induction of Decision Trees. Machine Learning, 1(1), 81–106.
[7]. Bradley, Andrew P. The use of the area under the ROC curve in the evaluation of machine learning algorithms. Pattern Recognit. 30 (1997): 1145-1159.
[8]. Brintrup, A., Pak, J., Ratiney, D., Pearce, T., Wichmann, P., Woodall, P., & McFarlane, D. (2019). Supply chain data analytics for predicting supplier disruptions: a case study in complex asset manufacturing. International Journal of Production Research, 58(11), 3330–3341.
[9]. Yang Jin. (2016). Research on Fraud Identification Model Based on Data Mining in E-commerc. Nanjing University.
[10]. McDermott, M., Zhang, H., Hansen, L., Angelotti, G., & Gallifant, J. (2020). A Closer Look at AUROC and AUPRC under Class Imbalance. In Advances in Neural Information Processing Systems (NeurIPS).