


1. Introduction
As the e-commerce landscape rapidly progresses, customer retention has become a pivotal element for businesses seeking to maintain their growth trajectory and stay competitive. As Berson pointed out, customer attrition can incur much more expensive costs for businesses compared to the expenses associated with customer retention [1]. With the proliferation of online shopping platforms and the intensifying market competition, e-commerce companies are frequently confronted with the challenge of customer loss, also known as churn. While losing customers is an inevitable aspect of most businesses, Rudd suggests that churn can be managed at acceptable levels by strategically investing in customers who are at risk of leaving [2].
To address this pressing issue, e-commerce firms should devise an effective strategy to predict and prevent customer attrition. By forecasting potential churn behaviors, companies can proactively take measures to retain those valuable customers.
Numerous previous research endeavors have concentrated on leveraging Machine Learning (ML) for churn prediction, especially for the customer churn of telecommunication companies, demonstrating its outstanding performance in this area. Umayaparvathi compared the performance of Artificial Neural Networks (ANN) and decision trees on the telco churn prediction and reveal that the decision tree-based approach outperforms the neural network-based approach in terms of accuracy [3]. Another study proposed a hybrid approach for churn prediction that combined an existing tree induction algorithm with genetic programming to derive classification rules based on customer behavior, which shows an improved performance [4]. And in another separate study for churn prediction, Philip introduced several ML models, and the Minimum-Redundancy Maximum-Relevancy (MRMR) feature selection technique. In summary, research in the field of customer churn prediction encompasses a wide variety of techniques and methods, aiming to enhance prediction accuracy and provide support for companies to formulate effective customer retention strategies. Building on this foundation, this study will further explore the selection of optimal models in specific environments and their application effects [5].
The study selects a dataset on e-commerce customer churn and constructs several models, including Logistical Regression (LR), Random Forest (RF), Gradient Boosting Decision Tree (GBDT) and a stacking model based on Extreme Gradient Boosting (XGBoosting) combining three models have been developed. Through comparative analysis, this study aims to provide a comprehensive analysis and prediction model for customer churn behavior for e-commerce companies.
2. Dataset
This research utilizes the “E-commerce Customer Churn” dataset From Kaggle, which contains a wealth of customer information pertinent to analyzing and predicting customer churn in an e-commerce setting. The dataset comprises 3,941 records, each representing a unique customer profile. Although some of the features exhibit a minor degree of missing data, the overall dataset is of high quality and encompasses rich information such as customer tenure, satisfaction levels, order preferences, complaint history, and more. This information is crucial for gaining insights into customer behavior and assessing the risk of churn (Figure 1).
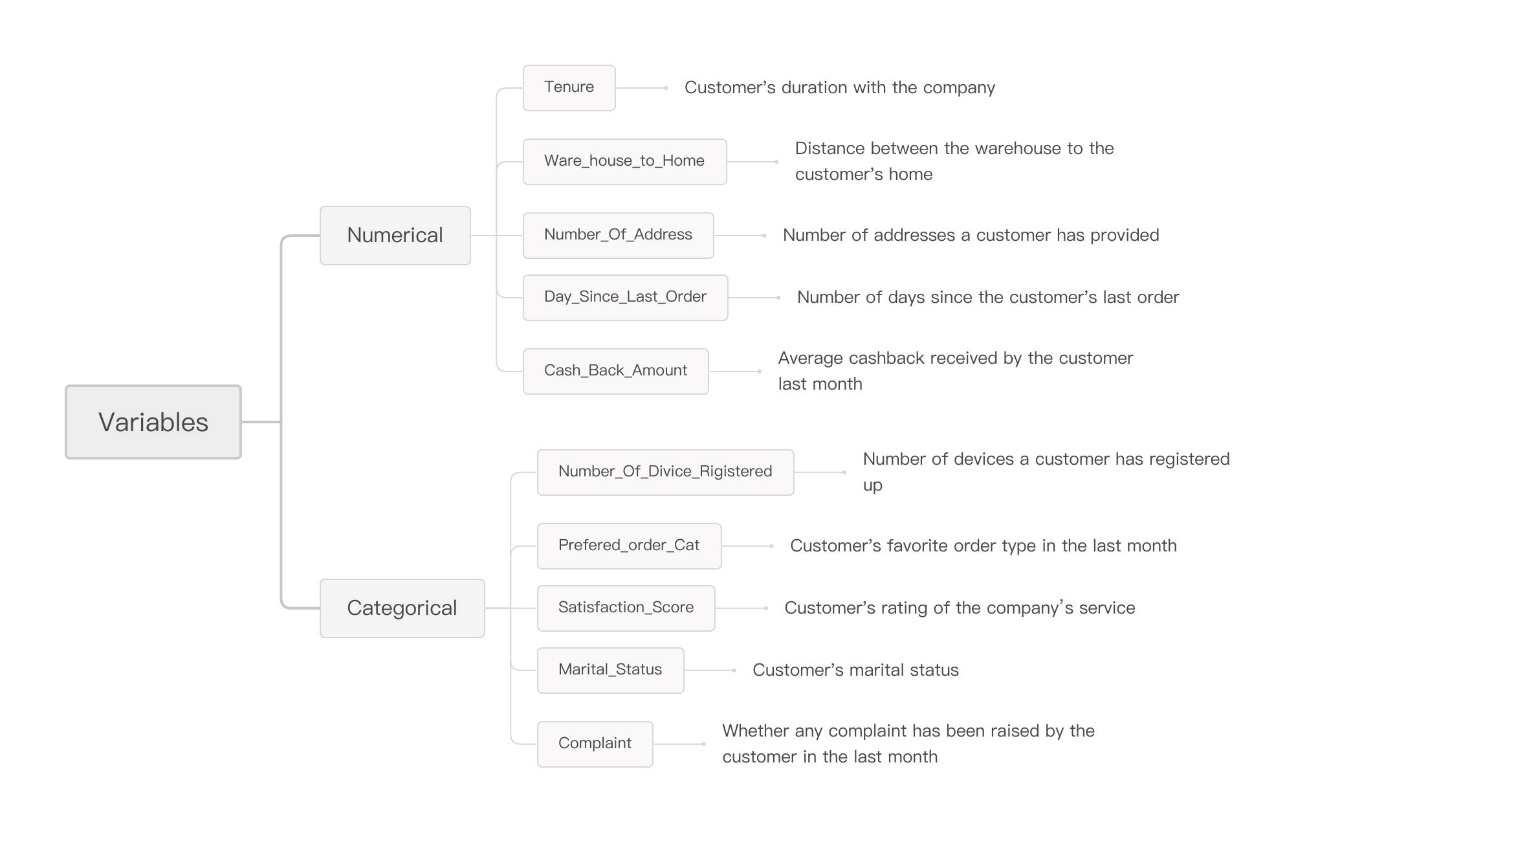
Figure 1: E-commerce data format (Photo/Picture credit: Original).
3. Method
3.1. Prediction Model
3.1.1. LR
Logistic regression is a widely applied technique for binary classification, which estimates outcome probabilities using a logistic function to map linear predictions to the (0,1) interval. Its simplicity, interpretability, and computational efficiency are notable advantages. However, the assumption of linearity between input features and log odds can limit its performance in complex or non-linear datasets, potentially leading to underfitting or overfitting. Despite these limitations, logistic regression remains popular for its reliability in diverse classification tasks.
3.1.2. RF
The RF algorithm, which combines several randomized decision trees and aggregates their predictions by averaging, has shown excellent performance in settings where the number of variables is much larger than the number of observations [6]. It is first proposed by L. Breiman in 2001 and is now performed in several fields, including classification, regression, and even feature selection tasks [7].
3.1.3. GBDT
Boosting algorithms combine weak learners into strong learner in an iterative way [8]. The algorithm improves its overall performance by enabling each weak learner to learn from the residuals of its predecessors. Gradient Boosting Tree (GBDT) which combines decision trees as its base estimators is noted for its high accuracy and robustness but it necessitates meticulous parameter tuning to prevent overfitting.
3.1.4. XGBoost
The XGBoost algorithm is set as the meta-learner of the stacking model, harmonizing outputs from LR, RF, and GBDT. XGBoost is a cutting-edge ensemble learning framework rooted in gradient-boosted trees, introduced by Che of the University of Washington in 2016 [9]. This method stands out due to its high interpretability, robustness, and exceptional performance, making it a widely adopted technique in ML in recent years. By integrating these diverse yet powerful models, our stacking approach aims to enhance the reliability of customer churn predictions in the e-commerce industry.
3.2. Data Preprocessing
Upon initial inspection of the raw dataset, it was observed that the features “Tenure”, “Where home house”, and “Day since last order” had a few missing values, with counts of 194, 196, and 213 respectively. To ensure the quality of the data, these data containing missing values are dropped out.
Subsequently, a more smoothed target encoding method is introduced to preprocess the categorical features within the dataset. The method is as follows:
The global average target value, denoted as 𝑦𝑎𝑣𝑔, is determined by taking the sum of the target variable values (in this case, Churn) across all instances in the training set and subsequently dividing that sum by the total count of instances, N.
\( {y_{avg}}= \sum _{i=1}^{N}{y_{i}} \) (1)
For each category k of the categorical variable, the average target value, denoted as \( {y_{cat\_avg}}(k) \) , is computed by summing the target variable values for all samples belonging to that category and dividing by the number of samples in that category \( {n_{k}} \) .
\( {y_{cat\_avg}}(k)=\frac{1}{{n_{k}}}\sum _{i∈category k}{y_{i}} \) (2)
For each category k of the categorical variable, the sample count, denoted as \( {n_{k}} \) , is simply the number of samples that belong to that category.
\( {n_{k}}=count(i|{x_{i}}=k) \) (3)
The smoothed target encoding value, denoted as \( smoothe{d_{{y_{avg}}}}(k) \) , for each category k is a weighted average of the global average target value and the category-specific average target value. The weighting is determined by a smoothing function that depends on the sample count for the category \( {n_{k}} \) and two smoothing parameters \( {n_{mid}} \) and c. Default \( {n_{mid}} \) and c are set as 20 and 4 in this case.
\( smoothe{d_{{y_{avg}}}}(k)= {y_{avg}}+ \frac{{y_{ca{t_{avg}}}}(k)-{y_{avg}}}{1+{e^{-(\frac{{n_{k}}- {n_{mid}}}{c})}}} \) (4)
This technique transforms categorical variables into numerical values by replacing each category with \( smoothe{d_{{y_{avg}}}}(k) \) , effectively capturing the connection between the categorical attribute and the target while minimizing overfitting risks.
To further refine the feature set, the Kolmogorov-Smirnov (KS) test is employed, which is a widely recognized and effective method for assessing differences in cumulative distribution functions, particularly for one-dimensional continuous data [10]. The KS value, which measures the maximum absolute difference between the cumulative distribution functions of the positive and negative classes, was computed for each feature in the training set to the target. This approach is advantageous as it is distribution-free, utilizes every data point in the samples, and is independent of the ordering direction of the data [10]. Serving as an indicator of feature importance features with a KS value less than 0.1 were deemed less informative and subsequently filtered out. Conversely, the remaining features, demonstrating stronger associations with the target, were retained for the subsequent model training process.
4. Result
Table 1: Model performance on training set through cross validation
models | KS | AUC | accuracy |
LR | 0.668 | 0.880 | 0.890 |
GBDT | 0.701 | 0.910 | 0.899 |
RF | 0.766 | 0.927 | 0.907 |
Stacking model | 0.744 | 0.927 | 0.912 |
Table 1 presents an overview of the performance metrics for various models on the training dataset, where cross-validation was employed to reduce the likelihood of overfitting and ensure a more robust assessment of model effectiveness. From Table 1, it can be observed that the RF and Stacking Model exhibited the highest accuracy, both achieving over 90% accuracy. In terms of AUC, both the RF and Stacking Model also performed exceptionally well, with an AUC of 0.927. The KS statistic, which measures the discriminatory power of the model, was highest for the RF (0.766), indicating its superior ability to distinguish between churners and non-churners.
Table 2: Model performance on hold-out set
models | KS | AUC | accuracy |
LR | 0.640 | 0.870 | 0.886 |
GBDT | 0.718 | 0.921 | 0.903 |
RF | 0.772 | 0.937 | 0.910 |
Stacking model | 0.779 | 0.940 | 0.928 |
Table 2 presents the performance metrics of the models on the hold-out set, which was used to assess the models' ability to generalize to unseen data. As shown in Table 2, the Stacking Model outperformed all other models on the hold-out set, achieving the highest accuracy (92.8%), AUC (0.940), and KS statistic (0.779), indicating that the Stacking Model can generalize better to the unseen data compared to the individual models.
The RF also demonstrates strong performance on the hold-out set, with an accuracy of 91.0%, AUC of 0.937, and KS statistic of 0.772. These results suggest that ensemble methods, such as RF and Stacking Models, are effective in predicting customer churn on the e-commerce platform.
Table 3: The ranked list of the importance of customer-related information
Rank | Customer Information | Description |
1 | Tenure | Customer's duration with the company |
2 | Complaint | Whether any complaint has been raised by the customer in the last month |
3 | Cash_back_Amount | Average cashback received by the customer last month |
4 | Day_Since_Last_Order | Number of days since the customer's last order |
5 | Satisfaction_Score | Customer's rating of the company’s service |
From Table 3, it is clear that 'Tenure' is the most important factor in predicting customer churn, followed by 'Complaint', 'Cashback Amount', 'Day Since Last Order', and 'Satisfaction Score'. These results imply that long-tenured customers, those without recent complaints, and individuals receiving higher cashback are at a lower risk of churning. Furthermore, customers who have made recent purchases and reported higher satisfaction levels are also less prone to leaving.
In summary, the Stacking Model demonstrated the most impressive overall performance, excelling both in cross-validation on the training set and the hold-out set. This robust and generalizable performance aligns with the research conclusions presented by Kalagotla in 2021 [11]. However, as mentioned in Džeroski's research, stacking models may not perform as well as a single model due to factors such as the increase in metadata dimensionality or the complexity of algorithm selection (various combinations of base classifiers and meta-learning algorithms). Additionally, stacking models can lead to higher computational complexity, making them unsuitable for application to large-scale datasets [12]. Additionally, the RF model also exhibited notably promising results, particularly when applied to the hold-out set. This underscores the significant potential of ensemble methods, such as RF, in accurately predicting customer churn, while being less computationally intensive than the stacking model. These findings emphasize the potential of ML in forecasting customer churn and provide valuable insights for developing efficient retention strategies in e-commerce.
5. Conclusion
The research utilized the "E-commerce Customer Churn" dataset, which offered a wealth of customer information. To ensure the data’s quality, the paper initially performed data cleaning. Subsequently, feature engineering was conducted to preprocess the dataset, paving the way for the construction of multiple ML models. Three primary models were developed: LR, RF, and GBDT. Additionally, with a Meta-leaner as XGBoost was constructed to exploit the benefits of diverse base models.
Through comparative analysis, the stacking emerged as the optimal model in this specific environment. Its performance on both the training set through cross-validation and the hold-out set was exceptional, achieving the highest accuracy, AUC, and KS statistic. This indicates that the stacking model, which aggregates the outputs of several base models, was able to generalize better to unseen data in this field compared to the individual models
The RF also demonstrated strong performance, particularly on the hold-out set. These results suggest that ensemble methods, such as RF and Stacking Model, are effective in predicting customer churn on the e-commerce platform. The findings of this study highlight the potential of ensemble methods in addressing the challenge of customer attrition and provide valuable insights for developing effective retention strategies.
However, the limitations of this study must be acknowledged. Specifically, the dataset used in this research has its constraints. Some e-commerce companies may possess a greater variety or fewer types of customer information, which could affect the direct applicability of the models developed in this study.
By accurately predicting potential churn behaviors, e-commerce companies can proactively take measures to retain valuable customers. The ranked list of the importance of customer-related information offered by this study can further guide companies in prioritizing their retention efforts. Overall, while recognizing the limitations of the dataset used, the research contributes to the ongoing efforts to manage customer churn and enhance customer retention in the competitive e-commerce industry.
References
[1]. Berson, A., Smith, S. J., & Thearling, K. (1999). Building Data Mining Applications for CRM McGraw-Hill.
[2]. Hason Rudd, D., Huo, H., & Xu, G. (2022). Improved churn causal analysis through restrained high-dimensional feature space effects in financial institutions. Human-Centric Intelligent Systems, 2(3), 70-80.
[3]. Umayaparvathi, V., & Iyakutti, K. (2012). Applications of data mining techniques in telecom churn prediction. International Journal of Computer Applications, 42(20), 5-9.
[4]. Yeshwanth, V., Raj, V. V., & Saravanan, M. (2011, March). Evolutionary churn prediction in mobile networks using hybrid learning. In Twenty-fourth international FLAIRS conference.
[5]. Philip, K. (1994). Marketing management: analysis planning implementation and control.
[6]. Biau, G., & Scornet, E. (2016). A random forest guided tour. Test, 25, 197-227.
[7]. Huang, W., Chen, T. Q., Fang, K., Zeng, Z. C., Ye, H., & Chen, Y. Q. (2021). N6-methyladenosine methyltransferases: functions, regulation, and clinical potential. Journal of Hematology & Oncology, 14, 1-19.
[8]. Freund, Y., Schapire, R., & Abe, N. (1999). A short introduction to boosting. Journal-Japanese Society For Artificial Intelligence, 14(771-780), 1612.
[9]. Chen, T., & Guestrin, C. (2016, August). Xgboost: A scalable tree boosting system. In Proceedings of the 22nd ACM Sigkdd International Conference on Knowledge Discovery and Data Mining (pp. 785-794).
[10]. Lopes, R. H., Reid, I. D., & Hobson, P. R. (2007). The two-dimensional Kolmogorov-Smirnov test.
[11]. Kalagotla, S. K., Gangashetty, S. V., & Giridhar, K. (2021). A novel stacking technique for prediction of diabetes. Computers in Biology and Medicine, 135, 104554.
[12]. Džeroski, S., & Ženko, B. (2004). Is combining classifiers with stacking better than selecting the best one?. Machine learning, 54, 255-273.
Cite this article
Ren,H. (2025). Machine Learning-Based Prediction of Customer Churn Risk in E-commerce. Advances in Economics, Management and Political Sciences,153,47-52.
Data availability
The datasets used and/or analyzed during the current study will be available from the authors upon reasonable request.
Disclaimer/Publisher's Note
The statements, opinions and data contained in all publications are solely those of the individual author(s) and contributor(s) and not of EWA Publishing and/or the editor(s). EWA Publishing and/or the editor(s) disclaim responsibility for any injury to people or property resulting from any ideas, methods, instructions or products referred to in the content.
About volume
Volume title: Proceedings of the 3rd International Conference on Financial Technology and Business Analysis
© 2024 by the author(s). Licensee EWA Publishing, Oxford, UK. This article is an open access article distributed under the terms and
conditions of the Creative Commons Attribution (CC BY) license. Authors who
publish this series agree to the following terms:
1. Authors retain copyright and grant the series right of first publication with the work simultaneously licensed under a Creative Commons
Attribution License that allows others to share the work with an acknowledgment of the work's authorship and initial publication in this
series.
2. Authors are able to enter into separate, additional contractual arrangements for the non-exclusive distribution of the series's published
version of the work (e.g., post it to an institutional repository or publish it in a book), with an acknowledgment of its initial
publication in this series.
3. Authors are permitted and encouraged to post their work online (e.g., in institutional repositories or on their website) prior to and
during the submission process, as it can lead to productive exchanges, as well as earlier and greater citation of published work (See
Open access policy for details).
References
[1]. Berson, A., Smith, S. J., & Thearling, K. (1999). Building Data Mining Applications for CRM McGraw-Hill.
[2]. Hason Rudd, D., Huo, H., & Xu, G. (2022). Improved churn causal analysis through restrained high-dimensional feature space effects in financial institutions. Human-Centric Intelligent Systems, 2(3), 70-80.
[3]. Umayaparvathi, V., & Iyakutti, K. (2012). Applications of data mining techniques in telecom churn prediction. International Journal of Computer Applications, 42(20), 5-9.
[4]. Yeshwanth, V., Raj, V. V., & Saravanan, M. (2011, March). Evolutionary churn prediction in mobile networks using hybrid learning. In Twenty-fourth international FLAIRS conference.
[5]. Philip, K. (1994). Marketing management: analysis planning implementation and control.
[6]. Biau, G., & Scornet, E. (2016). A random forest guided tour. Test, 25, 197-227.
[7]. Huang, W., Chen, T. Q., Fang, K., Zeng, Z. C., Ye, H., & Chen, Y. Q. (2021). N6-methyladenosine methyltransferases: functions, regulation, and clinical potential. Journal of Hematology & Oncology, 14, 1-19.
[8]. Freund, Y., Schapire, R., & Abe, N. (1999). A short introduction to boosting. Journal-Japanese Society For Artificial Intelligence, 14(771-780), 1612.
[9]. Chen, T., & Guestrin, C. (2016, August). Xgboost: A scalable tree boosting system. In Proceedings of the 22nd ACM Sigkdd International Conference on Knowledge Discovery and Data Mining (pp. 785-794).
[10]. Lopes, R. H., Reid, I. D., & Hobson, P. R. (2007). The two-dimensional Kolmogorov-Smirnov test.
[11]. Kalagotla, S. K., Gangashetty, S. V., & Giridhar, K. (2021). A novel stacking technique for prediction of diabetes. Computers in Biology and Medicine, 135, 104554.
[12]. Džeroski, S., & Ženko, B. (2004). Is combining classifiers with stacking better than selecting the best one?. Machine learning, 54, 255-273.