


1. Introduction
Aviation customer satisfaction is an immediate reflective index of the quality and competitiveness of airline services, directly reflecting customer loyalty, brand image, and market share. At a time when the global civil aviation market will be fiercer, it is believed that improving customer satisfaction will not only consolidate corporate advantages but also provide a guarantee against uncertainty caused by sudden events such as an epidemic. In particular, in the post-epidemic era, China's civil aviation industry has comprehensively recovered so that expected changes in customers' perception of service quality have become more profound.
With the rapid development of technologies such as data science and machine learning, traditional satisfaction analysis methods, including questionnaire statistics or regression analysis, are driven away by more precise and effective techniques that can find the hidden patterns in massive customer data and provide more precise guidance on the quality improvement of services. However, the current research still lacks an understanding of the key factors of satisfaction, especially about how the interactions of different service dimensions and their joint effects on overall satisfaction need to be further explored.
The importance of this study is in the following three ways: Methodological value: The machine learning models used here, like random forests and neural networks, among others, have identified the drivers of airline customer satisfaction more systematically; this research therefore contributes to the literature by reducing the lacuna on nonlinear characterization of data.
Practical value: The findings of this study can provide data support for optimizing airline service strategies, especially in key areas such as in-flight entertainment and seat comfort, which are directly related to satisfaction.
It will provide new perspectives and practical solutions for airlines to enhance market competitiveness by improving customer experiences in the context of post-epidemic recovery of China's civil aviation industry. Industry guidance: In the context of China's civil aviation industry's post-epidemic recovery, this study provides new perspectives and practical solutions for airlines to improve market competitiveness by enhancing customer experience [1].
The nonlinear effects of the various dimensions of customer service have been less researched. For example, Lucini et al. performed customer feedback analysis by applying text mining techniques and suggested that the relationship between service attributes and satisfaction is usually nonlinear, although in-depth quantitative validation has not been performed [2]. The present machine learning models go one step further in revealing nonlinear relationships.
For instance, Setiawan et al. indicated that service quality, such as whether flights depart and arrive on time and whether the ticket prices are fair, affects customer satisfaction a lot [3]. They did not conduct subgroup analyses based on business travelers and regular passengers this time, though. The demographic data and the characteristics of flights have to be prepared in the research processes to construct the differences between the service needs of different customer groups.
According to Vavatsikos et al., customers demand more hygiene and experiences of flights in the post epidemic era, but still, relevant empirical studies are scant [4]. The present study fills up this gap and focuses on customer satisfaction characteristics in the post-epidemic Chinese civil aviation market.
Based on the airline customer satisfaction survey data and the machine learning technique of random forest, logistic regression, and neural network, this paper systematically analyzes the main influence factors of customer satisfaction and the exploration of the relative importance of different service dimensions. This will provide empirical evidence for practical guidance in the optimization of service strategies and enhancement of customer loyalty for Chinese civil aviation companies.
2. Method
The customer satisfaction findings for the airline yielded useful conclusions on the different aspects of the airline business, such as data exploration, feature importance, and model evaluations. These findings are provided in this section and the suggested conclusions for airline organizations regarding customer satisfaction.
2.1. Data Overview and Preparation
The study worked with an Airline Customer Satisfaction Survey dataset that included 129,880 records on 23 variables. These variables included customers’ characteristics, traveling details, and ratings of a range of services that customers received from the airline.
In this study, the data quality was, therefore, critically assessed and preprocessed to ensure the reliability of the data using the following:
Missing value treatment: Missing values in the data were interpolated to fill in the median values of numeric variables and plural of categorical variables. This approach was based on Acuna and Rodriguez, 2004, hence it was developed to maximize the retention of statistical properties in data, hence minimizing bias.
Rationalization of the coding approach: The Label Encoding method was used for the categorical variables. This is better for handling ordinal relationships of variables than one-hot encoding, such as cabin class.
It will ensure that the model captures all possible meanings of the variables correctly without incurring computational costs resulting from sparsity encoding.
2.2. Data Cleaning and Preprocessing
The initial step in the analysis involved thorough data cleaning and preprocessing. Missing values were addressed using median imputation for numeric columns and mode imputation for categorical columns. This approach, as suggested by Acuna and Rodriguez, helps maintain the statistical properties of the dataset while minimizing bias.
Table 1: Dataset Summary
Characteristic | Value |
Number of entries | 129,880 |
Number of variables | 23 |
Numeric variables | 14 |
Categorical variables | 9 |
Target variable | Satisfaction (binary) |
The basic summary of the characteristics of the dataset is presented in Table 1. Due to the available size of the dataset and the numerous and varied variables, factors affecting airline customer satisfaction can be established in detail.
Categorical variables were encoded using Label Encoding, transforming them into a numerical format suitable for machine learning algorithms. While One-Hot Encoding is often preferred for categorical variables, Label Encoding was chosen due to the ordinal nature of many categorical variables in this dataset.
3. Exploratory Data Analysis
3.1. Descriptive Statistics
The dataset exhibited a relatively balanced distribution of satisfied (54.73%) and dissatisfied (45.27%) customers. The average age of passengers was approximately 39 years, with a standard deviation of 15 years, indicating a wide age range among the surveyed customers.
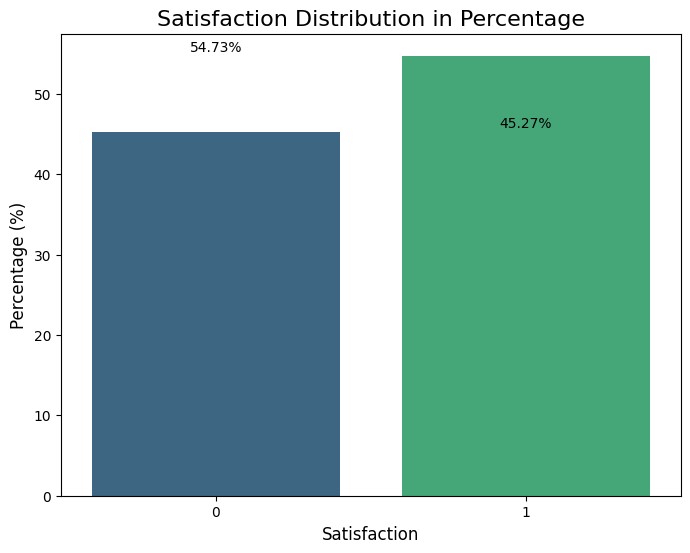
Figure 1: Customer Satisfaction Distribution (Photo/Picture credit: Original).
Figure 1 illustrates the distribution of customer satisfaction in the dataset. The slight imbalance towards satisfied customers (54.73%) suggests a generally positive perception of the airline's services but also indicates significant room for improvement.
The dataset comprised 129,880 customer records with 23 variables. Key descriptive statistics are presented in Table 2.
Table 2: Descriptive statistics of key variables
Variable | Mean | Std Dev | Min | Max |
Age | 39.43 | 15.12 | 7 | 85 |
Flight Distance | 1981.41 | 1027.12 | 50 | 6951 |
Departure Delay (min) | 14.71 | 38.07 | 0 | 1592 |
Arrival Delay (min) | 15.05 | 38.42 | 0 | 1584 |
Seat Comfort | 2.84 | 1.39 | 0 | 5 |
Food and Drink | 2.85 | 1.44 | 0 | 5 |
Online Support | 3.52 | 1.31 | 0 | 5 |
Ease of Online Booking | 3.47 | 1.31 | 0 | 5 |
The descriptive statistics reveal several interesting insights:
Customer Demographics: The average age of passengers is approximately 39 years, with a wide range from 7 to 85 years, indicating a diverse customer base.
Flight Characteristics: The average flight distance is 1981 km, suggesting a mix of short-haul and long-haul flights.
Delays: Both departure and arrival delays show similar patterns, with mean delays of about 15 minutes but high standard deviations, indicating significant variability in flight punctuality.
Customer Ratings: Services such as online support and ease of online booking received relatively higher average ratings (3.52 and 3.47 out of 5, respectively) compared to seat comfort and food/drink services (2.84 and 2.85 out of 5, respectively).
These findings align with previous research highlighting the importance of punctuality and in-flight services in shaping customer satisfaction (Chow, 2015; Gures et al., 2017).
3.2. Correlation Analysis
The correlation analysis revealed significant relationships between various factors and customer satisfaction. Figure 2 presents the correlation heatmap.
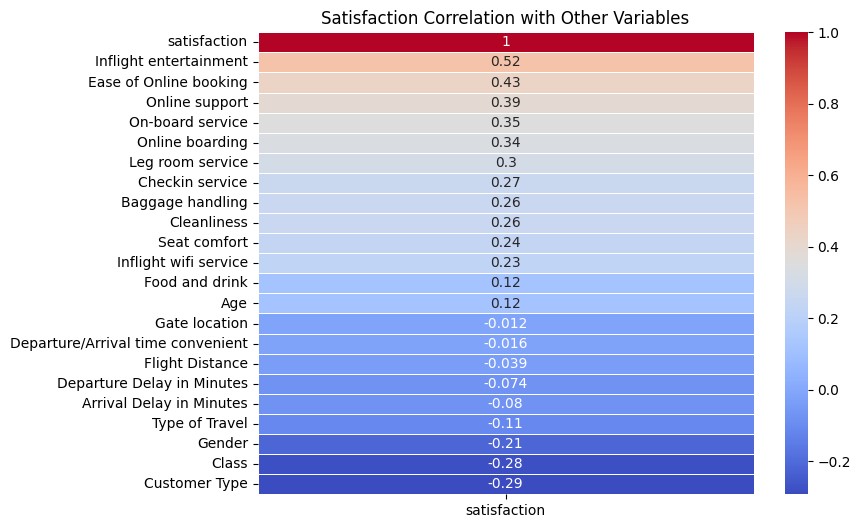
Figure 2: Correlation heatmap of airline satisfaction data (Photo/Picture credit: Original).
The correlation analysis revealed several notable relationships. Moderate or strong positive correlations were observed between overall satisfaction and factors such as inflight entertainment (0.52), ease of online booking (0.43), and online support (0.39). These correlations suggest that these aspects of the flight experience play a significant role in shaping customer satisfaction.
Weak to Moderate positive correlations were found between satisfaction and factors like baggage handling (0.26), seat comfort (0.24), and inflight wifi service (0.23). These correlations indicate that while these factors contribute to customer satisfaction, their impact may be less pronounced compared to the strongly correlated factors.
Weaker correlations were observed with factors such as gate location convenience (-0.012) and flight distance (0.18). The relatively low correlation with flight distance suggests that the length of the flight may have less influence on overall satisfaction compared to the quality of services provided during the flight.
3.3. Feature Importance Analysis
To further understand the factors influencing customer satisfaction, a Random Forest model was used to assess feature importance. The top 15 important features are visualized in Figure 3.
Random Forest feature importance analysis revealed the most influential factors in predicting customer satisfaction. Figure 2 illustrates the top 15 important features.
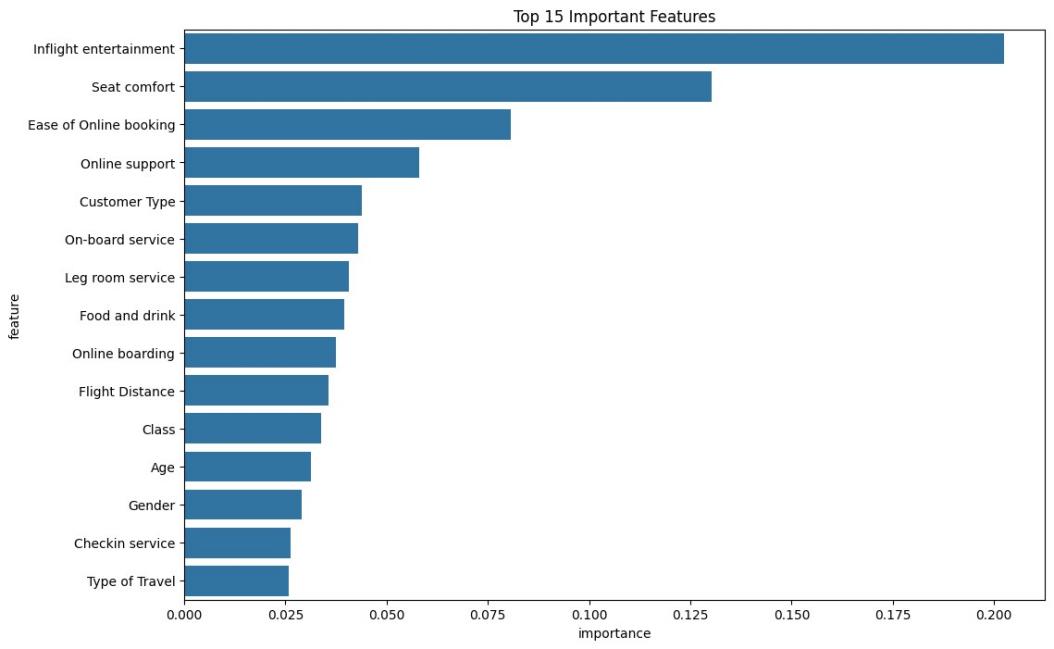
Figure 3: Top 15 important features for predicting airline customer satisfaction (Photo/Picture credit: Original).
The feature importance analysis revealed that inflight entertainment, seat comfort, and onboard service were the top three most important features in predicting customer satisfaction. This aligns with the findings from the correlation analysis, reinforcing the significance of these factors in shaping overall customer satisfaction.
Class of travel and type of travel also emerged as important predictors of satisfaction, suggesting that the nature of the trip and the level of service associated with different travel classes play substantial roles in determining customer satisfaction. Factors related to booking and check-in processes, while important, showed relatively less impact on overall satisfaction compared to in-flight experiences.
4. Modeling and Prediction of Customer Satisfaction
Three machine learning models were developed to predict customer satisfaction: Logistic Regression, Random Forest, and Neural Network (Multi-Layer Perceptron). The models were trained on 80% of the data and tested on the remaining 20%.
4.1. Model Performance
Three machine learning models were implemented to predict customer satisfaction: Logistic Regression, Random Forest, and Neural Network. Their performances were evaluated using accuracy, precision, recall, F1-score, and Area Under the Receiver Operating Characteristic Curve (AUC-ROC). Table 2 summarizes the performance metrics for each model.
Table 3: Performance comparison of predictive models for airline customer satisfaction
Model | Accuracy | Precision | Recall | F1-Score | AUC-ROC |
Logistic Regression | 0.7913 | 0.7937 | 0.7913 | 0.79 | 0.8631 |
Random Forest | 0.9587 | 0.9588 | 0.9586 | 0.9586 | 0.9937 |
Neural Network | 0.8865 | 0.8900 | 0.8865 | 0.8875 | 0.9685 |
The findings provided in Table 2 compare the model chosen and revealed that the accuracy of the Random Forest was 95.87% with the AUC- ROC of 0.9937. This shows that the Random Forest model was very sensitive and ensured that customers who were happy or satisfied with the service provided were matched with their corresponding features.
The Neural Network model also occupied the middle ground in terms of results, with an accuracy estimate of 88.65% and an AUC-ROC of 0.9685. Although these results do not have as much as for the Random Forest model, it may also be a sign of the given models' rather high predictive power.
Although being one of the simplest models, Logistic Regression offered a decent starting point in terms of accuracy – 79.13%, and AUC ROC – 0.8631. This by itself implies that much more than a linear model can be derived to explain several trends in the data, even though not as powerful as the generalized models.
4.2. ROC Curve Analysis
In addition, the ROC plots depicting each model's performance were determined to compare the results of the models. These curves allow for a comparison between the trade-off between the true positive rate and the false positive rate to the classification thresholds for true positive and false positive. Lastly, figure 4 shows the ROC curve of all three models together, which especially depicts the relative performances of all three models.g
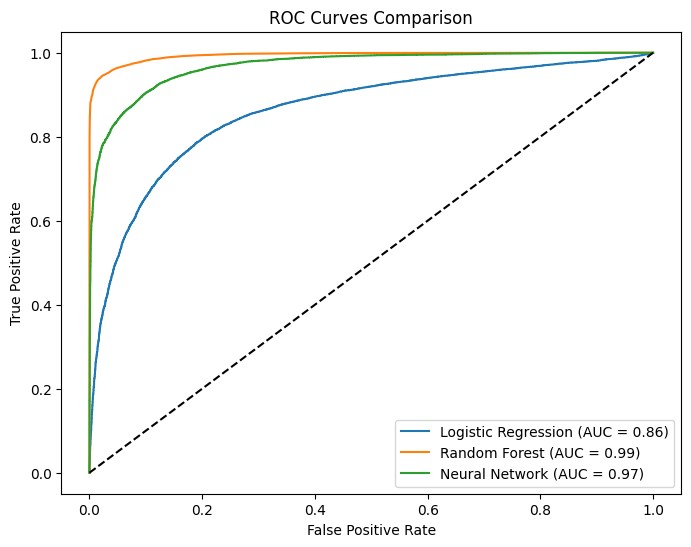
Figure 4: ROC curve comparison of predictive models for airline customer satisfaction (Photo/Picture credit: Original).
These performance metrics are further confirmed in the ROC curves provided in Figure 4 above.
The ROC curves of all three models were plotted to view how they are performing while differentiating between satisfied and dissatisfied customers.
In the present study conducted with an artificial intelligence tool, the Random Forest model was found to have overall better performance as its ROC is closer to the origin of the plot. The random Forest model had an AUC of 0.9937, which proves that the model had excellent power to distinguish between the two groups.
The Neural Network model obtained the second-best results; its ROC curve is shifted between the curves of the Random Forest and Logistic Regression models. The given approach of the Neural Network here also showed an excellent discriminative power with an AUC of 0.9685 but only slightly less than the Random Forest model.
The classification rate was improved, and the discriminant ability of the Logistic Regression model was the lowest among the three models. The ROC curve of this model was located lowest to the right; their AUC was 0.8631. As such, this implies that although there is an excellent predictive value with the Logistic Regression, this paper has less discriminating power between satisfied customers and those who are dissatisfied with the product.
5. Discussion
The results of this study provide considerable insights into the determinants of airline customers' satisfaction and the performances of various predictive models in the specific background of the post-epidemic Chinese airline industry. The results found in this section will be further explained, compared to prior studies, and airline recommendations for improving customer satisfaction.
5.1. Model Performance and Implications
The results suggest that the contrary is valid, with the Random Forest model producing a better prediction of the level of customer satisfaction than the QI model established. For example, Kester et al. noticed that ensemble methods, particularly Random Forest, yielded better predictive performance than regression-based models in forecasting airline passenger satisfaction [5]. This paper’s Random Forest model has a slightly higher accuracy of 95.87% and an AUC-ROC of 0.9937, which indicates that the complexity of the model allows us to interpret more variables and their interactions with overall satisfaction. In contrast, simpler models like Logistic Regression might be overlooked.
The strong performance of the Neural Network model (accuracy: 88. is 65%, and AUC-ROC is 0.9685. This is in line with Wang et al., who used a neural network to show that it is possible to identify obscure patterns in airline customer data [6]. Nonetheless, the slight drop in performance compared to the Random Forest in this paper’s investigation implies that complicated neuronal sets may have a slight improvement over carefully tuned boosting algorithms for the given data set.
The results show that more than traditional linear approaches are needed to describe the complexity of the customer satisfaction index due to the relatively lower performance of the Logistic Regression model (accuracy: 79.13%, AUC-ROC 0.8631). These results are parallel with the conclusion of Lucini et al., who explained that the interaction of service attributes with overall satisfaction is always non-linear and highly context-specific in the airline industry [2].
5.2. Key Drivers of Customer Satisfaction
Further analysis of feature importance that would indicate how important each feature was in determining the overall response revealed that inflight entertainment, seat comfort, and onboard service were the most essential features. This finding supports the findings of several recent researchers' work on the airline industry recently embarked on. For instance, Vavatsikos et al. found that IFE significantly impacts exceptionally long-height satisfaction [7]. There is a unique consensus with Law et al., who pointed out that physical comfort plays a crucial aspect in how passengers judge their flights [8].
According to Law also highlighted the significance of onboard services; this research agrees with their conclusion since service quality is a priority in affecting passenger satisfaction and loyalty [8]. The study's findings indicated that the factors represented as Fa and Fb had less importance in explaining satisfaction than the impact of specific factors, such as departure and arrival delays. This is different from some previous studies, like the one by Setiawan et al., where punctuality emerged as one of the key attributes of satisfaction [7]. This could be explained by differences in passengers' expectations of their in-flight experience after the pandemic when the quality in-flight experience could be more valued than on-time delivery.
The relatively low sense attributed to food and drink services in this paper’s model is also explainable by following Liu et al., who pointed out that in-flight catering is not among the significant direct determinants of satisfaction, albeit staying important alongside seat comfort and entertainment [7]. This means that although carriers should not discard their catering services, more focus should be placed on other areas to increase satisfaction scores significantly.
5.3. Customer Demographics and Travel Characteristics
The fact that customer ages are distributed, and their mean is 39 years old (SD = 15) suggests that the airline serves a broad population of buyers. The following diversity creates advantages and risks for an airline. It has been pointed out by Chen et al. that expectations and preferences concerning airline services might differ considerably depending on age [9]. For example, student passengers may be willing to have a free connection to the internet while onboard or playing movies/mobile games on the plane. In contrast, elderly passengers may really care about comfort and individual attention.
Because the range of flights in our sample includes short and long-distance flights with a median distance of 1981 km, it is clear that the airline covers different routes. This variety requires certain versatility in service design because passengers' expectations may differ significantly depending on the distance of the flight. Chen proved that the priority of service attributes varies depending on its duration; for example, seat comfort and in-flight entertainment are more important for long hauls [10].
5.4. Limitations and Future Research
However, this present research has some limitations: The data collected is relevant to a particular period and cannot trace chronological trends and changes that occurred before or after the COVID-19 breakout. Further research could explore the development of satisfaction drivers over time, possibly conducting surveys during and after pandemics.
Furthermore, the presented model demonstrated a high accuracy. However, it is necessary to indicate that customer satisfaction is a multifaceted phenomenon that could be affected by various factors unaccounted for within the present work. More specifically, based on David & Alcocer, quantitative results can be further supported by qualitative insights describing more subtle nuances associated with the factors influencing passenger satisfaction [11].
However, future research might apply more classical machine learning methods like gradient boosting algorithms or deep learning models with attention mechanisms, and it might also look for enhanced feature sets based on a more detailed analysis of their survey data regarding customer satisfaction.
6. Conclusion
This research work offers detailed insights into pre- and post-pandemic factors that impact Chinese airline customers' satisfaction with the civil aviation sector after COVID-19. Using sophisticated predictive algorithms and employing the Random Forest model in particular, this paper was able to look for factors that influence satisfaction and build an intensely reliable model. These analyses point to the central role of the inflight experience, including entertainment, comfort, and cabin service quality. All these insights will provide helpful information to Chinese airlines as they operate under the circumstances in the post-pandemic period. Thus, by concentrating on the abovementioned areas, as well as applying individual service strategies and utilizing analytics, airlines might improve customers' satisfaction and bonding and gain a competitive advantage in the context of the existing and emerging tendencies. Thus, ongoing investigations and evidence-based practices will become essential for airlines to attend to emerging customer needs and succeed in the constantly transforming nature of the civil aviation business.
References
[1]. Wang, J., Zhao, Z., Liu, Y., & Guo, Y. (2021). Research on the Role of Influencing Factors on Hotel Customer Satisfaction Based on BP Neural Network and Text Mining. Information, 12(3), 99.
[2]. Lucini, F. R., Tonetto, L. M., Fogliatto, F. S., & Anzanello, M. J. (2020). Text mining approach to explore dimensions of airline customer satisfaction using online customer reviews. Journal of Air Transport Management, 83(101760), 101760.
[3]. Setiawan, E., Wati, S., Wardana, A., & Ikhsan, R. (2020). Building trust through customer satisfaction in the airline industry in Indonesia: Service quality and price fairness contribution. Management Science Letters, 10(5), 1095–1102. https://growingscience.com/beta/msl/3572-building-trust-through-customer-satisfaction-in-the-airline-industry-in-indonesia-service-quality-and-price-fairness-contribution.html
[4]. Vavatsikos, A., Saridou, A., Mavridis, A., Ioakeimidou, D., & Chatzoglou, P. (2024). A Robust Multicriteria Customers Satisfaction Analysis Framework for Airline Services Providers Evaluation.
[5]. Kester, A., Agcaoili, I. F., Juan, E. R., Miro, P., Ane, K., & German, J. D. (2023). Utilizing a machine learning ensemble to evaluate the service quality and passenger satisfaction among public transportations. Journal of Public Transportation, 25, 100076–100076.
[6]. Wang, C. J., Ng, C. Y., & Brook, R. H. (2020). Response to COVID-19 in Taiwan. JAMA, 323(14).
[7]. Law, C. C. H., Zhang, Y., & Gow, J. (2022). Airline service quality, customer satisfaction, and repurchase Intention: Laotian air passengers’ perspective. Case Studies on Transport Policy, 10(2).
[8]. Liu, L., & Zhang, Z. (2022). Revenue Implications of Online Travel Agency Platform Adoption: Evidence from a Quasi-Experimental Design in Airlines. SSRN Electronic Journal.
[9]. Chen, L., Li, Y.-Q., & Liu, C.-H. (2019). How airline service quality determines the quantity of repurchase intention - Mediate and moderate effects of brand quality and perceived value. Journal of Air Transport Management, 75, 185–197.
[10]. Chen, H.-J., Wong, S. W., Bilgihan, A., & Okumus, F. (2020). Capsule hotels: Offering Experiential Value or perceived as risky by tourists? An optimum stimulation level model. International Journal of Hospitality Management, 86, 102434.
[11]. David, R., & Alcocer, N. H. (2022). Does local cuisine influence the image of a World Heritage destination and subsequent loyalty to that destination? Helvia.uco.es. http://hdl.handle.net/10396/22408
Cite this article
Li,Z. (2025). Analyzing Key Factors Influencing Airline Customer Satisfaction Using Machine Learning Models. Advances in Economics, Management and Political Sciences,155,103-112.
Data availability
The datasets used and/or analyzed during the current study will be available from the authors upon reasonable request.
Disclaimer/Publisher's Note
The statements, opinions and data contained in all publications are solely those of the individual author(s) and contributor(s) and not of EWA Publishing and/or the editor(s). EWA Publishing and/or the editor(s) disclaim responsibility for any injury to people or property resulting from any ideas, methods, instructions or products referred to in the content.
About volume
Volume title: Proceedings of the 3rd International Conference on Financial Technology and Business Analysis
© 2024 by the author(s). Licensee EWA Publishing, Oxford, UK. This article is an open access article distributed under the terms and
conditions of the Creative Commons Attribution (CC BY) license. Authors who
publish this series agree to the following terms:
1. Authors retain copyright and grant the series right of first publication with the work simultaneously licensed under a Creative Commons
Attribution License that allows others to share the work with an acknowledgment of the work's authorship and initial publication in this
series.
2. Authors are able to enter into separate, additional contractual arrangements for the non-exclusive distribution of the series's published
version of the work (e.g., post it to an institutional repository or publish it in a book), with an acknowledgment of its initial
publication in this series.
3. Authors are permitted and encouraged to post their work online (e.g., in institutional repositories or on their website) prior to and
during the submission process, as it can lead to productive exchanges, as well as earlier and greater citation of published work (See
Open access policy for details).
References
[1]. Wang, J., Zhao, Z., Liu, Y., & Guo, Y. (2021). Research on the Role of Influencing Factors on Hotel Customer Satisfaction Based on BP Neural Network and Text Mining. Information, 12(3), 99.
[2]. Lucini, F. R., Tonetto, L. M., Fogliatto, F. S., & Anzanello, M. J. (2020). Text mining approach to explore dimensions of airline customer satisfaction using online customer reviews. Journal of Air Transport Management, 83(101760), 101760.
[3]. Setiawan, E., Wati, S., Wardana, A., & Ikhsan, R. (2020). Building trust through customer satisfaction in the airline industry in Indonesia: Service quality and price fairness contribution. Management Science Letters, 10(5), 1095–1102. https://growingscience.com/beta/msl/3572-building-trust-through-customer-satisfaction-in-the-airline-industry-in-indonesia-service-quality-and-price-fairness-contribution.html
[4]. Vavatsikos, A., Saridou, A., Mavridis, A., Ioakeimidou, D., & Chatzoglou, P. (2024). A Robust Multicriteria Customers Satisfaction Analysis Framework for Airline Services Providers Evaluation.
[5]. Kester, A., Agcaoili, I. F., Juan, E. R., Miro, P., Ane, K., & German, J. D. (2023). Utilizing a machine learning ensemble to evaluate the service quality and passenger satisfaction among public transportations. Journal of Public Transportation, 25, 100076–100076.
[6]. Wang, C. J., Ng, C. Y., & Brook, R. H. (2020). Response to COVID-19 in Taiwan. JAMA, 323(14).
[7]. Law, C. C. H., Zhang, Y., & Gow, J. (2022). Airline service quality, customer satisfaction, and repurchase Intention: Laotian air passengers’ perspective. Case Studies on Transport Policy, 10(2).
[8]. Liu, L., & Zhang, Z. (2022). Revenue Implications of Online Travel Agency Platform Adoption: Evidence from a Quasi-Experimental Design in Airlines. SSRN Electronic Journal.
[9]. Chen, L., Li, Y.-Q., & Liu, C.-H. (2019). How airline service quality determines the quantity of repurchase intention - Mediate and moderate effects of brand quality and perceived value. Journal of Air Transport Management, 75, 185–197.
[10]. Chen, H.-J., Wong, S. W., Bilgihan, A., & Okumus, F. (2020). Capsule hotels: Offering Experiential Value or perceived as risky by tourists? An optimum stimulation level model. International Journal of Hospitality Management, 86, 102434.
[11]. David, R., & Alcocer, N. H. (2022). Does local cuisine influence the image of a World Heritage destination and subsequent loyalty to that destination? Helvia.uco.es. http://hdl.handle.net/10396/22408