


1. .Introduction
1.1. Research Background
Zhang Yong, deputy director of the Legal Affairs Committee of the Standing Committee of the National People's Congress, reported that on the morning of September 13, the 11th meeting of the Standing Committee of the 14th National People’s Congress voted to adopt the “Proposal of the Standing Committee of the National People’s Congress on the Gradual Delay of the Statutory Retirement Age” decision. This decision includes the main text, the Measures of the State Council on the Gradual Postponement of the Statutory Retirement Age and the four annexes. This decision will come into force on January 1, 2025. The provisions on the retirement age in the “Two Interim Measures” approved by the Standing Committee of the National People’s Congress in 1978 will no longer be in force. With respect to the main tasks of gradually extending the statutory retirement age, Wang Xiaoping introduced that, first, gradually extending the statutory retirement age. From January 1, 2025, for male employees with the original statutory retirement age of 60 years, the statutory retirement age will be extended by one month every four months, gradually extending to 63 years old. Age will increase by 1 month every 4 months, gradually extending to 58 years old. For female employees who are 50 years old, the statutory retirement age will increase by 1 month every 2 months, gradually extending to 55 years old[1]. As the degree of aging in China continues to deepen, its impact on socioeconomic structure, individual quality of life, and the old-age security system has become increasingly prominent. As of the end of 2023, China's elderly population of 60 years and over has reached 297 million, accounting for 21.1% of the total population, while the population of 65 years and over exceeds 217 million, accounting for 15.4%. According to the forecast of the United Nations, by 2050, the proportion of China’s population at the age of 60 and over will rise significantly to 39.8%, and the aging speed is significantly faster than the world average, showing a significant pattern of “getting old before getting rich”. This trend not only exacerbates the mismatch between socioeconomic development and the aging process but also poses severe challenges to economic growth, wealth accumulation, and the sustainability of the old-age security system.
Against the background of aggravated population aging, the economic security of the elderly has become a topic of widespread concern in all sectors of society. Elderly individuals generally face relatively low disposable income, and the risk of poverty increases significantly as they age. As one of the main sources of income for elderly individuals, the stability and sustainability of pensions are directly related to their quality of life. Although China has preliminarily established a pension security system covering three pillars, it still faces many challenges in actual operation. In particular, consumer risk assessment of the individual pension system urgently needs further improvement and optimization[2].
In addition, the frequent fluctuations in the global and domestic financial markets in recent years have further highlighted the importance of risk assessment for financial consumers. For example, the collateral crisis triggered by market turmoil in the UK pension system and the “net-breaking wave” and “redemption wave” in China’s bank wealth management product market had negative effects on investor confidence and market stability. This also further emphasizes the urgency of strengthening the risk assessment of individual pension consumers.
1.2. Research purpose
The purpose of this paper is to investigate in depth the status, problems and economic impact mechanism of personal pension consumer risk assessment in China and to provide theoretical support and suggestions for the personal pension system. The specific research purposes include comprehensively sorting the framework, indicators and implementation effects of personal pension consumer risk assessment to identify the main problems in the current assessment system; analyzing how risk assessment affects the behavioral decision-making of investors and the market performance of personal pension products; and ensuring the stability of the entire pension security system. On the basis of the research results, targeted policy recommendations are proposed to optimize the risk assessment framework, enhance the level of assessment technology, and strengthen the education of financial consumers, thereby enhancing the stability and sustainability of the individual pension system and better protecting the economic security and quality of life of elderly individuals.
1.3. Research questions and hypotheses
With respect to the suitability management mechanism for financial consumers, other countries also have relevant regulations. According to international experience, consumers' financial literacy levels vary widely. If the tolerance level of consumers cannot precisely match the risk level of financial products, it will be unfavorable for the maintenance of consumers' trust in the financial market and long-term financial stability. Personal financial information belongs to the category of privacy, and leakage or disclosure without consent constitutes a tort; second, it is derived from the implied obligation in the contract law, and the financial services contractual relationship implies the requirement to keep client information confidential; third, it is based on fiduciary obligation theory, especially in the situation of conflicts of interest, such as in the consulting services between the bank and the client, and the financial industry operators need to ensure that the interests of the client are not harmed, which inherently requires the confidentiality of sensitive information[3]. In the United States, the “Rule 2111” issued by the Financial Industry Regulatory Authority mentions that it is necessary for financial institutions to understand the financial status, tax status, investment experience, investment horizon, liquidity needs and risk tolerance of consumers. Article 25 of the Markets in Financial Instruments Directive launched by the European Securities and Markets Authority also puts forward corresponding requirements for financial institutions and consumers, stressing that financial institutions should focus on consumers’ risk tolerance and ability to bear losses. Notably, as the global population aging trend becomes more evident, an increasing number of countries have begun to attach importance to the financial consumer protection of elderly people and the appropriate management of personal pension products[4].
H1: Consumers’ risk-taking ability is an influencing factor that affects the consumption ability of personal pension financial products.
In recent years, with the development of China's financial market, the impact of financial literacy on the financial market participation, investment behavior and retirement planning of families or residents has received increasing attention. Research shows that households with greater financial literacy are more likely to participate in the stock market and tend to allocate more risky assets. In addition to its influence on investment behavior, financial literacy is also closely related to the depth and breadth of family financial planning. The research of Hu and Zang shows that when families with higher levels of financial literacy engage in financial planning, they not only choose products and services that are more suitable for their own conditions but also set more long-term planning goals. Qin reported that improved financial literacy can also promote the purchase of commercial insurance by residents, thus providing families with additional risk protection. With respect to the relationship between educational background and financial literacy, Wu revealed a positive correlation between educational background and financial literacy and noted that improving financial literacy helps avoid the problem of excessive debt[5]. This means that by improving financial literacy, households can better manage their financial status and avoid unnecessary debt risk. In terms of retirement planning, households with high levels of financial literacy are more likely to have a retirement savings plan[6]. Therefore, the second research hypothesis in this paper is as follows:
H2: The fluctuation of financial literacy relates to the purchase rate of personal pension investment products. However, because of the special characteristics of the sample region, it may not be completely positive, but negative.
2. Overview of pension finance
2.1. Definition and scope of pension finance
Most residents in China rely on the first pillar of basic pension insurance, that is, social pensions, but the security level is low, and it is difficult to meet the future needs of high-quality pensions. Reasonably guiding residents in retirement planning and increasing their wealth reserves for the elderly is highly important for promoting the high-quality development of elderly care undertakings in China. The long-term investment philosophy of personal pensions is based on the motivation of individuals to smooth their income to maximize the consumption utility of the individual’s lifetime. Under this goal, the consumption and savings in different periods should be rationally allocated from the perspective of the overall life course.
2.2. Analysis of the status quo and trend of pension financing
At present, the awareness of the Chinese people in retirement planning is still insufficient. According to the “2023 China Retirement Wealth Reserves Survey Report”, as many as 19.6% of the respondents admitted that they had never thought about pension planning, and another 55% of the respondents had had such considerations but had not yet turned it into one. However, only 6% of the respondents said that they had developed detailed pension plans and had started to implement them. In terms of pension fund preparation, there are three main channels: social pensions, family pensions and personal pensions. Specifically, social pensions rely on the basic pension insurance provided by the government to support retirement; family pensions rely on the financial assistance of children, spouses, or other family members; personal pensions are through personal savings and investment behaviors, such as the purchase of commercial pension insurance, which comes from the self-accumulation of pension funds. Notably, when individuals choose different pension models, they are deeply affected by their economic status and family composition characteristics[5]. With socioeconomic development, China's birth rate has been decreasing, which has led to a reduction in family size. As a result, the traditional culture of “caring for the elderly with children” and the family model of providing for the elderly face unprecedented challenges. Moreover, population aging also poses risks and challenges to the fiscal sustainability of the basic pension insurance system.
3. Analysis
3.1. Pension financial products and market analysis
3.1.1. Commercial pension insurance and annuity products
As a supplementary way of providing insurance for elderly individuals, commercial pension insurance has gradually received increasing attention in China. Compared with traditional social pension insurance, commercial pension insurance has the characteristics of high flexibility and a wide range of choices. The common commercial pension insurance products in the market include the following:
- Life annuity: After the policyholder reaches the agreed-upon age, the insurance company pays a fixed amount regularly until the death of the policyholder.
- Term annuity: The insurance company pays a fixed amount at regular intervals during the agreed-upon period.
- Deferred annuity: The insured pays the premium one time or in installments and starts to receive annuity after reaching the agreed-upon age.
3.1.2. Analysis of investment-type pension products
In addition to traditional commercial pension insurance, some pension financial products with investment attributes, such as pension target funds and pension trusts, have appeared in the market. These products usually invest funds in financial instruments such as stocks and bonds and aim to provide consumers with higher retirement income through capital appreciation. The characteristics of investment-type pension products include the following:
- Higher expected returns: Compared with traditional insurance products, investment products may provide higher potential returns.
- Coexistence of risk and return: A high return is accompanied by high market risk.
- Flexible investment strategy: Provide diversified investment programs according to the different risk appetites of investors.
3.1.3. Size and structure of the pension market
In recent years, with the worsening of population aging and the increasing demand for elderly care, the scale of China’s pension market has been continuously expanding. According to relevant data, as of the end of 2022, the total size of pensions nationwide will reach several trillion yuan. Structurally, the pension market mainly includes the following parts:
- The first pillar: basic pension insurance, which is led by the government and has wide coverage but a relatively low level of protection.
The second pillar, the enterprise annuity and the individual occupational annuity, are jointly funded by enterprises and individuals to supplement the first pillar.
- The third pillar: personal pensions, including commercial pension insurance and pension target funds, are completely selected and invested in by individuals.
3.2. Model analysis
Our data come from a large-scale socioeconomic survey[7], which collected basic information, such as age, gender, educational background, and risk appetite score, from the respondents. These scores are obtained through a series of standardized questions about investment choices, insurance purchase willingness and other aspects to form a comprehensive risk-taking ability score.
3.2.1. Weights scoring&Linear regression
The weighted scoring method was used in the analysis process; the answers of each category of respondents were assigned different weighted points to balance the influence of different SES. The specific weight distributions are shown in the following table:
Table 1: Weights assignments.
Weights | Description of loss tolerance |
0 | No loss is allowed at any time |
1 | Can bear a loss of less than 10% periodically |
2 | Can bear 10-30% of the losses periodically |
3 | Can bear a loss of more than 30% periodically |
The total weight score is obtained by multiplying the loss tolerance percentage matrix by the weight vector, and the comparison of this number is analogous to the comparison of the risk-bearing ability of the samples. Next, the maximum value of the total weighted points is found and used as the maximum possible weighted points. Finally, the risk-taking index of the group in each category (income range or age range) is calculated by dividing the total weighted score for each individual by its maximum possible weighted score.
For the model, we assume a linear relationship between risk capacity and the pension contribution rate. Therefore, a simple linear regression equation of the following form was established:
\( P={β_{0}}+{β_{1}}R+ε (1) \)
Table 2: Interpretation of the meaning of mathematical symbols.
P | represents the pension contribution rate |
R | Indicates risk-taking ability |
| the intercept term and slope parameter, respectively. |
| the random error term |


Another validation experiment was conducted to evaluate the relationship between risk-taking ability and consumption intention across different age groups. To this end, we quantified the loss-bearing ability of each age group. We then used these data to calculate the risk-taking index for each age group. Next, we define a set of age values and corresponding risk-taking ability values, as well as a set of consumption intention values. We used these data to calculate the correlation coefficient between the two variables. If the absolute value of the correlation coefficient was greater than or equal to 0.7, we considered that there was a high degree of linear correlation between these two variables; if the absolute value of the correlation coefficient was less than 0.7 but greater than 0.3, it was considered that there was a certain linear correlation between them; otherwise, we considered that there was no significant linear correlation between them.
3.2.2. Non-parametric regression&Cross-validation
Table 3: Investigation of financial literacy factors.
Years | Simple Interest | Compound Interest | Inflation | Investment Risk | Fraud Probability | Consumption Probability |
2021 | 58.82% | 63.51% | 49.22% | 66.30% | 15.60% | 23.04% |
2022 | 62.69% | 68.67% | 49.95% | 63.56% | 11.45% | 23.32% |
2023 | 62.98% | 63.83% | 50.64% | 77.00% | 14.14% | 22.07% |
In the second study, we attempted to analyze the relationship between financial literacy indicators (SimpleInterest, CompoundInterest, Inflation, InvestmentRisk, FraudProbability) and consumption probability using multiple linear regression. Nevertheless, the results of the multiple linear regression were unsatisfactory for several reasons. Firstly, the standard errors SE for all predictors except x2 and x4 are reported as zero, leading to undefined t-statistics and p-values, which indicates potential issues with model estimation, possibly due to multicollinearity or perfect prediction by some variables. Secondly, the infinite t-statistics for the intercept, x2, and x4 suggest that these parameters are not reliably estimated within the context of a linear model. Lastly, the presence of null values for p-values implies that statistical significance cannot be assessed for most coefficients. Given these limitations, it was concluded that the data do not meet the assumptions required for reliable multiple linear regression analysis. Specifically, the assumption of linearity may not hold, and the small sample size exacerbates the challenges in estimating parameters accurately.
To address the shortcomings of the multiple linear regression approach, we opted to employ non-parametric regression methods. Non-parametric regression does not rely on strict distributional assumptions or linearity between predictors and the response variable[8]. Instead, it allows the models to match the potential structure of the data so that possibly to figure out more complex and variable relationships. Given the small sample capacity and potential non-linearities in the data, non-parametric methods such as kernel regression are better suited to capture the underlying patterns without imposing strong parametric constraints.
After that, there is a cross-validation to check the MAE and RMSE between prediction and actual consumption probability. In k-times cross-validation, the data set is randomly divided into k equally-sized folds. For each of the k iterations, one fold is reserved as the validation set while the remaining k-minus-1 folds are used as the training set. The model is trained on the training set and validated on the validation set. This process is repeated k times, with each fold serving once as the validation set. The performance metrics, for example, accuracy, mean squared error, from each iteration are averaged to produce an overall estimate of model performance.
3.3. Empirical analysis and discussion of the results
3.3.1. Data collection and processing
According to the survey samples in the “CAFF50: 2023 China Pension Finance Survey Report”, in terms of gender, men accounted for 51.24%, and women accounted for 48.76%; the distribution of age groups was relatively even, with 18–29, 30–39, and 40–49 years aged 50–59 and over 60 years accounting for 20.01%, 20.49%, 19.19%, 19.50% and 20.81%, respectively; in terms of education level, primary school and below accounted for 4.60%, junior high school accounted for 11.65%, and high school/secondary technical school/vocational high school accounted for 4.60%. College students accounted for 31.58%, college students accounted for 17.81%, and college students and above accounted for 34.37%. In terms of the number of children, no children accounted for 19.02%, having one child accounted for 27.02%, having two children accounted for 35.04%, and having three or more children accounted for 18.92%. In terms of marital status, 19.28% had no spouse, and 80.72% had a spouse. In terms of monthly after-tax income, 12.63% had a monthly after-tax income of 3,000 yuan and below, 21.02% had between 3,001 and 5,000 yuan, 27.01% had between 5001 and 10,000 yuan, 10001–RGB 15,000 accounted for 18.80%, and RMB 15,001 and above accounted for 20.54%. In terms of the number of properties, 0 sets accounted for 10.48%, 1 set accounted for 63.34%, 2 sets accounted for 23.78%, and 3 sets and above accounted for 2.40%. The survey sample's residential distribution reveals notable differences across geographical regions. Specifically, the Eastern Region accounts for 50.73% of the sample, indicating a substantial concentration in this area. In contrast, the Central Region comprises 29.68% of the sample, suggesting a more moderate presence. Meanwhile, the Western Region holds the smallest share at 19.59%. When comparing the Central and Eastern Regions, it is apparent that the Eastern Region is relatively more affluent, as evidenced by its higher percentage representation[7]. These percentages reflect the relative prosperity within the surveyed areas. The image data and text data in the report were reorganized into tabular form. For example, three methods are used to calculate the correct rate of financial answers, and the histogram of each algorithm for each year can be converted into an independent percentage. Since the data are complete but not large, the decimal point is moved back to make the values more accurate.
3.3.2. Results of H1 experiment
After data cleaning and preliminary testing, we substituted all valid observations into the above models for estimation. The results show that there is a positive linear relationship between risk-taking ability and the pension contribution rate. Specifically, as risk-taking ability increases, individuals tend to increase their pension contribution proportion. The resulting output is directly determined via the IF function, and the image is as follows:
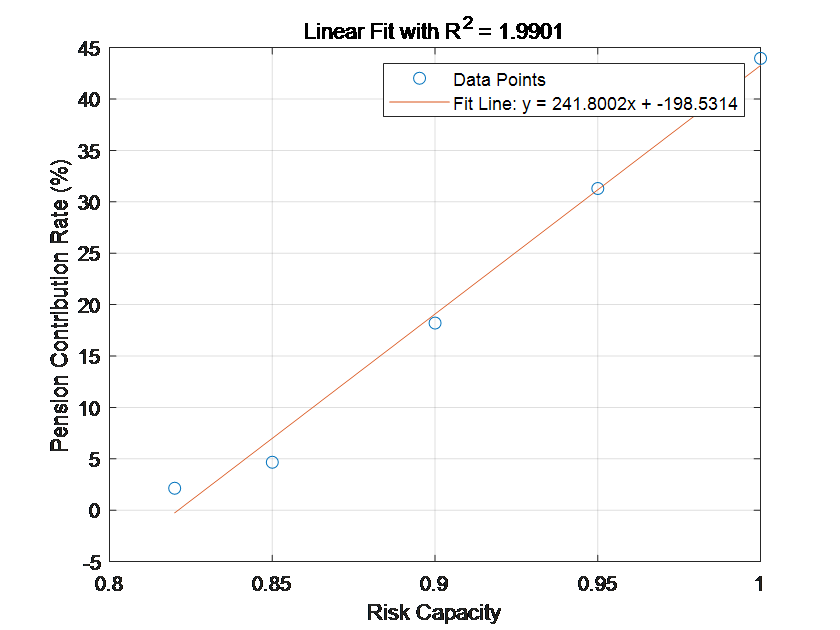
Figure 1: Risk capacity.
Originally plotted with the matlab software
To test the robustness of this finding, we also calculate the coefficient of determination  ,with a value of 0.99, which means that the model can explain approximately 99% of the variation in the dependent variable. In addition, we draw a scatter plot and its corresponding fitting curve (see the figure 1). The distribution of each point was relatively concentrated, and the trend significantly increased, which further supported our theoretical hypothesis.
Despite the positive conclusions of our study, several limitations should be noted. First, due to the limitations of the data collection methods, there may be certain biases, such as insufficient sample coverage. Second, considering that many factors affect the behavior of pension contributions, fully revealing the complex mechanisms behind this phenomenon on the basis of a single dimension of risk preference is difficult. Future studies can try to include more control variables, such as occupation and marital status, to gain a more in-depth understanding. However, in view of the shortcomings of the current study, the interval classification was changed, the samples were divided into groups according to different age intervals, and the above experimental process was repeated. The linear correlation coefficient of the output results was 0.7542, which is greater than 0.7. Therefore, the experiment concluded that comprehensive risk-taking ability and consumption intention were highly linearly correlated.
In summary, the present study shows that an individual’s risk-taking ability has an important effect on his pension contribution rate. This finding not only helps policy-makers better design incentives to encourage people to actively participate in the pension savings plan but also reminds financial institutions to provide differentiated products and services on the basis of the risk appetite of different customers.
3.3.3. Results of the H2 experiment
After calculated the Pearson Correlation Coefficient and the Spearman Rank Correlation Coefficient between the financial literacy indicators and consumption probability[9]. The results of the Pearson Correlation Coefficient revealed that four out of the five financial literacy indicators (Simple Interest Counting, Inflation Counting, Investment Risk, and Fraud Probability Perception) exhibited a negative correlation with consumption probability. Only one indicator, Compound Interest Counting, demonstrated a positive correlation with consumption probability but the absolute values of these correlation coefficients were generally low, suggesting that the correlations were not strong. The results of the Spearman Rank Correlation Coefficient were similar to those of the Pearson Correlation Coefficient, indicating that most financial literacy indicators were negatively correlated with consumption probability, albeit not strongly. Specifically, the Pearson Correlation Coefficients were -0.3625, 0.6314, -0.7283, -0.9998, and -0.3751 for the five financial literacy indicators, respectively. Similarly, the Spearman Rank Correlation Coefficients were -0.5000, 0.5000, -0.5000, -1.0000, and -0.5000. To verify whether these correlation coefficients were significantly different from zero, we conducted t-tests. However, it should be noted that directly conducting a t-test on a correlation coefficient is statistically invalid due to its nature as a single statistic rather than a sample data set. Therefore, the t-test results presented here are for reference only and do not strictly validate the significance of the correlation coefficients. Finally, when analyzing the correlation between each financial literacy indicator and consumption probability individually, we found that, regardless of whether the Pearson Correlation Coefficient or the Spearman Rank Correlation Coefficient was used, the negative correlations were observed for Simple Interest Counting, Inflation Counting, Investment Risk, and Fraud Probability Perception, with coefficients ranging from -0.3625 to -0.9998 for Pearson and -0.5000 to -1.0000 for Spearman. In contrast, Compound Interest Counting demonstrated a positive correlation with consumption probability, with a Pearson coefficient of 0.6314 and a Spearman coefficient of 0.5000. These findings suggest that certain aspects of financial literacy may have a certain impact on consumption probability.
4. Conclusions
Empirical analysis reveals that consumers' risk-taking ability has a significant effect on their ability to consume personal pension financial products. This means that when designing and promoting pension financial products, financial institutions need to fully consider consumers’ individual differences and provide personalized consulting services to help consumers better understand and choose products that suit them. Nevertheless, individuals with higher financial literacy tend to adopt a more cautious approach towards existing pension financial products in the present market, and are thus less likely to readily consume them. This may be related to the location of the selected sample source. Beyond financial literacy, factors such as family income and expenditure, preference, information filtering ability, long-term planning, as well as practical transparency in financial products, all play significant roles in affecting people's willingness and decisions to invest in pension financial products[7]. People tasked with promoting pension financial products ought to prioritize the following aspects: first, enhancing transparency and honesty in disclosure, ensuring clarity in fee structures, expected returns, and risk levels, thereby reducing the likelihood of deception, which correlates positively with information asymmetry during purchasing decisions; second, offering personalized customized services tailored to consumers' household incomes, expenses, and long-term planning objectives. Furthermore, based on collected data and analytical results, it is evident that consumption probability positively correlates with the risk of deception, indicating that frequent buyers may be more fragile suffering deceptions. Hence, there is a need to strengthen education and guidance through financial literacy institutions and online seminars, empowering consumers with risk identification skills, fostering rational product evaluation, and enabling informed investment decisions, ultimately mitigating potential losses from impulsive purchasing.
References
[1]. China Daily (2024). Raise the legal retirement age in a prudent and steady manner. [online] www.npc.gov.cn. Available at: http://www.npc.gov.cn/ [Accessed 27 Oct. 2024].
[2]. Haoge, L. and Guiqin, Z. (2024). How can the pension insurance system be sustainable?— Based on the perspective of the coordinated development of basic endowment insurance and personal pension. Economic science , 4(F840.6). doi:https://doi.org/10.%2012088/PKU.jkxx.
[3]. Ying, H. (2017). Financial privacy protection in the context of data sharing. Social Science Ⅱ; Social Science I, [online] 19(1671-511X), pp.85-91+144. Available at: https://link.cnki.net/doi/10.13916/j.cnki.issn1671-511x.2017.01.011 [Accessed 27 Oct. 2024].
[4]. Heng, Z. and Yan, Z. (2024). Economic interpretation of personal pension consumer risk assessment — The theoretical research on the big article of pension finance. [online] Cnki.net. Available at: http://kns.cnki.net/kcms/detail/44.1696.F.20240912.1140.006.html. [Accessed 30 Oct. 2024].
[5]. Haoran, P. and Xiyu, L. (2024). The influence of financial literacy on the retirement planning decision and pension model choice of Chinese residents. Southern finance, [online] 05(1007-9041), pp.17–31. Available at: https://link.cnki.net/urlid/44.1479.F.20240815.1409.004 [Accessed 30 Oct. 2024].
[6]. Hongwei, H. and Jiayi, W. (2024). Development of personal pension: system positioning and realistic path. Rural financial research, 08(F832.2), pp.16–29. doi:https://doi.org/10.16127/j.cnki.issn1003-1812.2024.08.002.
[7]. China Insurance and Pension Research Center, Pudaokou School of Finance, Tsinghua University (2024). China Insurance and Pension Finance Research Center. [online] Tsinghua.edu.cn. Available at: https://ciprc.pbcsf.tsinghua.edu.cn [Accessed 31 Oct. 2023].
[8]. Peter, E. and Rossi (2014). Bayesian non- and semi-parametric methods and applications. Princeton: Princeton University Press.
[9]. Headrick, T.C. (2016). A Note on the Relationship between the Pearson Product-Moment and the Spearman Rank-Based Coefficients of Correlation. Open Journal of Statistics, 06(06), pp.1025–1027. doi:https://doi.org/10.4236/ojs.2016.66082.
Cite this article
Wang,S. (2025). Impact of Financial Literacy on Personal Pension Investment. Advances in Economics, Management and Political Sciences,163,33-42.
Data availability
The datasets used and/or analyzed during the current study will be available from the authors upon reasonable request.
Disclaimer/Publisher's Note
The statements, opinions and data contained in all publications are solely those of the individual author(s) and contributor(s) and not of EWA Publishing and/or the editor(s). EWA Publishing and/or the editor(s) disclaim responsibility for any injury to people or property resulting from any ideas, methods, instructions or products referred to in the content.
About volume
Volume title: Proceedings of the 4th International Conference on Business and Policy Studies
© 2024 by the author(s). Licensee EWA Publishing, Oxford, UK. This article is an open access article distributed under the terms and
conditions of the Creative Commons Attribution (CC BY) license. Authors who
publish this series agree to the following terms:
1. Authors retain copyright and grant the series right of first publication with the work simultaneously licensed under a Creative Commons
Attribution License that allows others to share the work with an acknowledgment of the work's authorship and initial publication in this
series.
2. Authors are able to enter into separate, additional contractual arrangements for the non-exclusive distribution of the series's published
version of the work (e.g., post it to an institutional repository or publish it in a book), with an acknowledgment of its initial
publication in this series.
3. Authors are permitted and encouraged to post their work online (e.g., in institutional repositories or on their website) prior to and
during the submission process, as it can lead to productive exchanges, as well as earlier and greater citation of published work (See
Open access policy for details).
References
[1]. China Daily (2024). Raise the legal retirement age in a prudent and steady manner. [online] www.npc.gov.cn. Available at: http://www.npc.gov.cn/ [Accessed 27 Oct. 2024].
[2]. Haoge, L. and Guiqin, Z. (2024). How can the pension insurance system be sustainable?— Based on the perspective of the coordinated development of basic endowment insurance and personal pension. Economic science , 4(F840.6). doi:https://doi.org/10.%2012088/PKU.jkxx.
[3]. Ying, H. (2017). Financial privacy protection in the context of data sharing. Social Science Ⅱ; Social Science I, [online] 19(1671-511X), pp.85-91+144. Available at: https://link.cnki.net/doi/10.13916/j.cnki.issn1671-511x.2017.01.011 [Accessed 27 Oct. 2024].
[4]. Heng, Z. and Yan, Z. (2024). Economic interpretation of personal pension consumer risk assessment — The theoretical research on the big article of pension finance. [online] Cnki.net. Available at: http://kns.cnki.net/kcms/detail/44.1696.F.20240912.1140.006.html. [Accessed 30 Oct. 2024].
[5]. Haoran, P. and Xiyu, L. (2024). The influence of financial literacy on the retirement planning decision and pension model choice of Chinese residents. Southern finance, [online] 05(1007-9041), pp.17–31. Available at: https://link.cnki.net/urlid/44.1479.F.20240815.1409.004 [Accessed 30 Oct. 2024].
[6]. Hongwei, H. and Jiayi, W. (2024). Development of personal pension: system positioning and realistic path. Rural financial research, 08(F832.2), pp.16–29. doi:https://doi.org/10.16127/j.cnki.issn1003-1812.2024.08.002.
[7]. China Insurance and Pension Research Center, Pudaokou School of Finance, Tsinghua University (2024). China Insurance and Pension Finance Research Center. [online] Tsinghua.edu.cn. Available at: https://ciprc.pbcsf.tsinghua.edu.cn [Accessed 31 Oct. 2023].
[8]. Peter, E. and Rossi (2014). Bayesian non- and semi-parametric methods and applications. Princeton: Princeton University Press.
[9]. Headrick, T.C. (2016). A Note on the Relationship between the Pearson Product-Moment and the Spearman Rank-Based Coefficients of Correlation. Open Journal of Statistics, 06(06), pp.1025–1027. doi:https://doi.org/10.4236/ojs.2016.66082.