


1. Introduction
Recently, due to the increasing aging phenomenon, negative population growth, and financial burden, China’s government has published a series of China’s retirement policies to meet the challenges. China’s retirement policy (CRP) is a welfare system that employees can enjoy the financial grants, health care and other supports after working for a certain year [1]. China’ s government decided to delay the age of retirement and drawing the pension and set up an individual pension system to release the financial pressure [2,3,4]. However, it has been questioned whether the rationality and scientific nature of the CRP.
The policy modeling research consistency index (PMC-AE index) model refers to a quantitative analysis tool to analyze strengths or weaknesses points of policies and provide reference to formulate follow-up policies [5]. For example, Chenrui used it to evaluate China’s Carbon Neutrality Policies and advise the government to provide technical assistance to industrial enterprises [6]. More recently, analyzed the advantages nad disadvantages of traditional Chinese medicine development planning through PMC-AE index model, and provided theoretical reference for further research [7]. However, although PMC-AE index model was demonstrated to be effective in previous policy evaluation, little attention has been paid to the selection of CRP.
This paper will be the first to introduce PMC-AE index model to quantitatively evaluate 1950-2022 China's retirement policies. On the basis of the model, it sets nine major variables, including policy level, policy duration, policy nature, target population, release body, policy evaluation, policy input, policy implementation, and policy impact. This combination of autoencoding technology and visualization can directly evaluate the scientific validity and rationality of CRP and provide reference for the government to work out the following policies.
2. Literature Review
China’s retirement policy is one of the basic national policies, and its misregulation will lead to social instability, increasing unemployment rates, and even the decrease of life expectancy[8,9]. Therefore, the evaluation of retirement policies is essential.
In 1958 America, Margery [10] released the first retirement policy evaluation by semi-structured interview and Retirement Planning Inventory, for 281 participants. It aims to learn people’s attitude towards retirement policy and motivate retirement policy implementation. In 1961, Juanita [11] first mentioned to ensure the variables in retirement policy evaluation by a case study, for example the scale of the company. In 1985, Hausman and Wise [12] used proportional hazard model formulations to analyze the retirement policy, more recently, Benjamin[13] clarified the feasibility of machine learning for policy evaluation, which set a new direction for policy evaluation. These studies gradually shifted from the participants’ subjective feelings to more objective and multidimensional assessments of the policy itself.
However, it seems to late to conduct retirement policy evaluation in China. Research in China is mainly about the evaluation of a single policy, but on the basis of foreign research, study methods are more diverse, for example, cohort study (see, e.g.,Yi[14]), interview (see, e.g., Qi Wang[15] ), and literature review (see, e.g., Wei Huang[16]). They focus on the individual economic situation (see, e.g., Hongbin [17]), physical health (see, e.g., Yi[14]) and social stability(see, e.g.,Yikun[18]). However, so far, no research has systematically evaluated the consistency of the series of policies issued by China's retirement system and pointed out the advantages and disadvantages of the current retirement policies there.
PMC-AE index model is an index model for financial analysis proposed by Ruiz Estrada in 2010 and then improved for policy analysis [5]. Yuanxin[19] used PMC-AE index model to evaluate the industrialization policy in China at first. Then, an increasing number of scholars tried to use it in various policy evaluations, for example, China’s cultivated land protection policies (Bing [20].), China's disaster relief policies (Zhenhua [21]).
3. Method
3.1. Selection sample strategy
The policy text was retrieved from the Peking University Law and Regulation database with the subject of "retirement" or/and "Retirement Policy". They need to meet the following conditions: (1) China's retirement policy; (2) Policies issued from 1949 to 2022; (3) Policies issued by the Chinese government (national or provincial); (4) the term is more than 1 year; (5) Full text. Finally, it had 69 strategies that met the included criteria. According to disparities in levels of economic development, and differences in religious beliefs, at last, it maintained 14 policies. Twelve policies are national, and two policies are provincial. Among them, 5 full employees retired, 2 government employees retired, 2 cadres' policies, 3 employee's policies, and 2 professionals' policies. (Table 1)
Table 1: Sample polices
Code | Year | Policy Name |
P1 | 1950 | ‘Notice on the Treatment of Retired Personnel’ |
P2 | 1951 | ‘The Labour Insurance Regulations of the People’s Republic of China’ |
P3 | 1955 | ‘Interim Measures for Handling the Retirement of State Organ Staff ‘ |
P4 | 1978 | ‘Interim Measures on Retirement and Resignation of Workers’ |
P5 | 1978 | Interim Measures for the Placement of Old, Weak, Sick and Disabled Cadres |
P6 | 1980 | ‘Interim Provisions of the State Council on the Retirement and Rest of Veteran Cadres’ |
P7 | 1981 | ‘Notice on Strictly Implementing the Workers’ Retirement and Notice on the Interim Measures for Resignation’ |
P8 | 2001 | ‘Tibetan Government Development (2001) No. 109 Regulation’ |
P9 | 1986 | ‘Pension insurance system’ |
P10 | 1990 | ‘Notice on the Strict Implementation of the Interim Measures for the Retirement and Resignation of Workers’ |
P11 | 1994 | ‘Shanghai Urban Employee Pension Insurance Measures’ |
P12 | 1997 | ‘The State Council’s Decision on Establishing a Unified Basic Pension Insurance System for Enterprise Employees’ |
P13 | 2005 | ‘Civil Servant Law of the People‘s Republic of China (retirement part)’ |
P14 | 2022 | ‘Notice of the General Office of the People's Bank of China on Carrying out Pilot Work on Specific Old-age Savings’ |
3.2. PMC-AE index model construction
The process of constructing the quantitative PMC-AE model of China's retirement policy includes the following steps: (1) Using the PMC index model to classify variables and identify parameters. (2) Construct a multi-input output table and use text mining technology to assign values. (3) Using the self-coding technology in the neural network, multiple parameters are fused to obtain the PMC-AE index, that is, the score of each strategy. (4) Draw PMC-AE surface map to evaluate China's retirement policy.
3.3. Multi-input-output table construction
This paper constructs a multi-input and output table to quantify the evaluation. According to the existing literature on policy evaluation variables, this table sets and adjusts the main variables: policy (X1), policy duration (X2), policy nature (X3), target population (X4), issuing subjects (X5), policy evaluation (X6), policy input (X7), policy implementation (X8), and policy impact (X9) (Table 2). The multi-input-output table of retirement policy is composed of the above 9 major variables and 34 minor variables (Table 2). The parameter value of all secondary variables should be set as binary, that is, when the evaluated policy conforms to the content of the secondary variable, its value is 1. If not, the value will be 0.
Table 2: Policy evaluation variables table
First level variable | Second level variable | |||||
X1 Policy level | X1:1 Country | X1:2 Province | X1:3 District | William [22] | ||
X2 Policy duration | X2:1 Long term | X2:2 Middle term | X2:3 Short term | Elizabeth [23] | ||
X3 Policy nature | X3:1 Notice | X3:2 Regulation | X3:3 Interim procedures | X3:4 System | X3:5 Decision | Crabb [24] |
X4 Target population | X4:1 All employees | X4:2 State government personnel | X4:3 Cadre | X4:4 Worker | X4:5 Professionals | Ingram [25] |
X5 Release body | X5:1 General Office of the State Council | X5:2 Provincial and municipal governments and bureaus | X5:3 District and County Governments | X5:4 Others | Wisner (1995) [26] | |
X6 Policy evaluation | X6:1 Full evidence | X6:2 Clear target | X6:3 Plain planning | Wollmann [27] | ||
X7 Policy input | X7:1Financial input | X7:2 Medical input | X7:3Educational support | X7:4 Professionals support | X7:5 Other support | Vedung [28] |
X8 Policy implemention | X8:1 Completely conduct the policy component | X8:2 Partly conduct the policy component | X8:3 Slightly conduct the policy component | DeGroff [29] | ||
X9 Policy impact | X9:1 Short term | X9:2 Middle term | X9:3 Long term | Gertler [30] | ||
3.4. PMC-AE index calculation
Using the scores of 9 first-level variables obtained above, the neural network model is constructed, and the parameters are learned. The first layer is the input layer of the first-level variable (X), the second layer is the hidden layer, the Soft-plus function (Formula 1) is used from the input layer to the hidden layer, the third layer is the output layer, the Sigmoid function (Formula 2) is used from the hidden layer to the output layer, and finally the PMC-AE index Table (Table X) is obtained.
\( {F(x)=ln(1 +e^{x}}) \) (1)
\( g(x)= \frac{1}{1+{e^{-x}}} \) (2)
3.5. PMC-AE surface map construction
This paper constructs the PMC-AE surface, visualizes the scores of each policy index, and intuitively understands the advantages and disadvantages of each policy. There are 9 principal variables in the multiple I/O table to construct a matrix of dimensions 3*3. The matrix is shown in Formula (3).
\( Surface PME-AE=[\begin{matrix}X1 & X4 & X7 \\ X2 & X5 & X8 \\ X3 & X6 & X9 \\ \end{matrix}]\ \ \ (3) \)
4. Result and Discussion
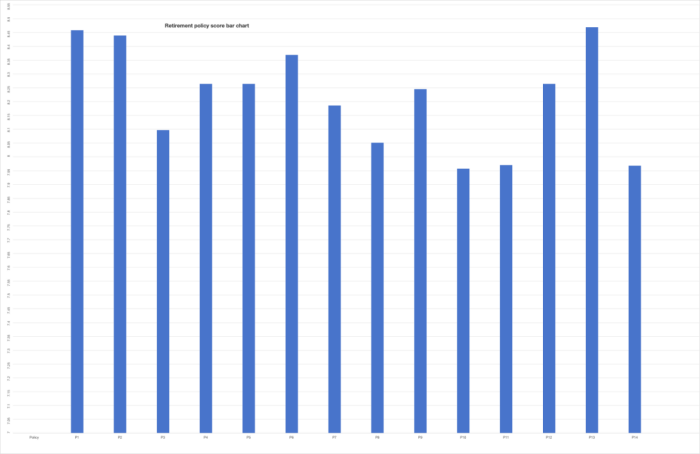
Figure 1: The bar chart of 14 policies
Table 3: PMC index table
Policy | X1 | X2 | X3 | X4 | X5 | X6 | X7 | X8 | X9 | PMC index |
P1 | 0.955 | 0.955 | 0.993 | 0.788 | 0.982 | 0.893 | 0.982 | 0.955 | 0.955 | 8.458 |
P2 | 0.955 | 0.955 | 0.982 | 0.993 | 0.982 | 0.893 | 0.893 | 0.893 | 0.893 | 8.439 |
P3 | 0.955 | 0.788 | 0.955 | 0.788 | 0.982 | 0.893 | 0.993 | 0.955 | 0.788 | 8.097 |
P4 | 0.955 | 0.788 | 0.955 | 0.788 | 0.982 | 0.893 | 0.993 | 0.955 | 0.955 | 8.264 |
P5 | 0.955 | 0.788 | 0.955 | 0.788 | 0.982 | 0.955 | 0.993 | 0.955 | 0.893 | 8.264 |
P6 | 0.955 | 0.955 | 0.893 | 0.788 | 0.982 | 0.893 | 0.993 | 0.955 | 0.955 | 8.369 |
P7 | 0.955 | 0.788 | 0.993 | 0.788 | 0.982 | 0.955 | 0.982 | 0.788 | 0.955 | 8.186 |
P8 | 0.893 | 0.955 | 0.788 | 0.993 | 0.955 | 0.893 | 0.893 | 0.788 | 0.893 | 8.051 |
P9 | 0.893 | 0.893 | 0.893 | 0.993 | 0.982 | 0.955 | 0.788 | 0.893 | 0.955 | 8.245 |
P10 | 0.893 | 0.788 | 0.993 | 0.788 | 0.982 | 0.788 | 0.982 | 0.788 | 0.955 | 7.957 |
P11 | 0.893 | 0.955 | 0.788 | 0.788 | 0.955 | 0.955 | 0.893 | 0.788 | 0.955 | 7.97 |
P12 | 0.955 | 0.955 | 0.788 | 0.993 | 0.982 | 0.955 | 0.893 | 0.788 | 0.955 | 8.264 |
P13 | 0.955 | 0.955 | 0.993 | 0.788 | 0.982 | 0.955 | 0.993 | 0.955 | 0.893 | 8.469 |
P14 | 0.955 | 0.893 | 0.993 | 0.993 | 0.982 | 0.788 | 0.788 | 0.788 | 0.788 | 7.968 |
Average | 0.94 | 0.89 | 0.93 | 0.86 | 0.98 | 0.90 | 0.93 | 0.87 | 0.91 | 8.21 |
4.1. Consistency of CRP
Policy consistency refers to compatibility and uniformity of aims and actions in policy[31]. Under the theoretical framework of <The 14th Five-Year Plan for the Development of National Aging Affairs and Elderly care service system planning>, China’s policy aims to promote the improvement of pension insurance policies and strengthen diversified social security[32]. According to the reports, frequently changing the policy direction and components of policy could lead to failure due to lack of control and supervision[33]. For example, Policy 7 ‘Notice on Strictly Implementing the Workers’ Retirement and Notice on the Interim Measures for Resignation’ , as the administrative departments arbitrarily expanded the scope of retirement and lowered the requirements for children of retired workers, which harms others’ interests[34].
According to the PMC index table (table 3), it indicates the average of the PMC index for 14 of China’s retirement policies was 8.21, and they were ranked as follows: P13>P1>P2>P6>P5>P12>P9>P7>P3>P8>P10>P14>P11. Among all retirement policies, P13 ‘Civil Servant Law of the People‘s Republic of China (retirement part)’ gains the highest score (8.47), and P11‘Shanghai Urban Employee Pension Insurance Measures’ scored the lowest (7.97). In Zhenhua’s research, he divided the scores of PMC-AE index into excellent (6-7.99), perfect (8-9)[35]. Therefore, there are 3 excellent consistency policies (P10, P11, P14) and 11 perfect consistency policies (P1, P2, P3, P4, P5, P6, P7, P8, P9, P12 ,P13). Based on the Table 3, the lowest score of nine variables is X4 target population, which means it most possibly influences the consistency of CRP. In previous studies, Ketkaew pointed out that retirement pensions of urban and rural residents are different, meanwhile, Glaeser emphasized the retirement system of government employees has more subsidies than that of workers [36,37]. The possible reasons are as follows: (1) Administrative discretion leads to different definitions and implementation principles for the identification of target groups and resource redistribution by front-line staff. (2) Whether the policymaking group includes a sufficient proportion of disadvantaged groups and grassroots people is another important consideration. The other factor that influences the consistency of CRP is X8 policy implementation.
4.2. Fidelity of CRP
Policy implementation, in other words, fidelity, means whether the policy is carried out as intended [38]. It is influenced by multi-departmental cooperation and multi-level docking. For example, policy communication from the national government to provincial government, training of frontline staff by the provincial government, and policy implementation by frontline staff, they possibly cause low internal validity in process. In previous studies, Liane thought internal validity, in other words, the procedures of the study and the rigor of its execution directly affect the consistency and effectiveness of the policy [39]. In this research, X5 policy implementation is the main risk factor. So, to find out how big the effect was, the linear regression relationships between variables and PMC indexes were used with Jamovi (2.6) [40]. It showed that the PMC-AE index increases by 0.32 points for 1 score increase in the average score of policy implementation. Low fidelity of CRP possibly because: (1) Due to local protectionism, the allocation of resources (pensions, health care, education, and others) was uneven under the control of administrative power. (2) The failure to optimize government functions leads to the inability to meet the resources required by policies, for example, fiscal deficits or inadequate medical resources. (3) Target population performs defensive resistance when facing frequent changes in policy. (4) Low internal validity of policy implementation, including untrained frontline staff and distracted target populations.
5. Conclusion
This paper evaluates the consistency of China’s retirement policy by PMC-AE index model. It also analyses the weakness ang strengths from the data and figures by combining autoencoding technology and visualization. The results show that 14 of China’s retirement policies (1950-2022) have perfect consistency. The main risk factors are policy implementation and target population. The reasons inferred by a literature comparison are: (1) Provincial government level: Excessive administrative discretion of provincial governments, local protectionism, the inability of provincial government resources to meet policy needs, and inadequate docking between provincial governments and the national government. (2) Front-line staff level: Untrained staff, lack of manpower to conduct policies, and heterogeneity of policy interpretation and implementation. (3) Target population level: Distracted target population and defensive resistance.
This research is mainly limited by three aspects: sample selection, internal validity, and external validity. Firstly, although national policies and provincial policies are both mentioned, the number of provincial policies is too small to support further analysis. Moreover, even if policies are selected for different target populations, there is a lack of policies for specific types of work, such as military. Therefore, it presents a certain selection bias. Furthermore, internal validity was influenced. For example, the rating of all policies is not blind, which may be biased caused by subjectivity. Meanwhile, despite all variables being selected with reference to previous literature, there are no clear selection criteria. The weakening of external effectiveness is mainly reflected in the sample characteristics: all policies include pension. For non-pension policies, such as ‘delay the retirement age’, may be a lack of transferability.
On the one hand, the main work in the future lies in the construction process and scoring criteria of an accurate PMC-AE index model. Although a large number of literatures have used it to evaluate policies, the selection of evaluation indicators is subjective and diverse. It need set up a broad framework to reduce the heterogeneity of PMC-AE index model. Additionally, there are different rating criteria, for example, in Zhenhua’s criterion, perfect is 8-9, while in Bing’s criterion, it is 7.128-7.920[20,35]. It decreases the reliability of results.
On the other hand, it is necessary to explore how to reduce misunderstandings of policies between the central government and provincial governments or frontline staff. Meanwhile, it should reduce endogeneity problems between confusing factors and fundamental factors, preventing them from affecting each other.
References
[1]. Che, Y., & Li, X. (2018). Retirement and health: evidence from China. China Economic Review, 49, 84-95.
[2]. Zhang, L., Gu, J., & An, Y. (2023). The optimal delayed retirement age in aging China: Determination and impact analysis. China Economic Review, 79, 101972.
[3]. Zhang, Q., & Cao, X. (2024). Delayed retirement, pension insurance and income inequality. Kybernetes.
[4]. Peng, J., & Wang, Q. (2024). China’s Pension System: Creating Sustainable and Equitable Social Security. Taylor & Francis.
[5]. Ruiz Estrada, M. A. (2010). The policy modeling research consistency index (PMC-index). Available at SSRN 1689475.
[6]. Lu, C., Wang, B., Chen, T., & Yang, J. (2022). A document analysis of peak carbon emissions and carbon neutrality policies based on a PMC index model in China. International Journal of Environmental Research and Public Health, 19(15), 9312.
[7]. Yang, C., Yin, S., Cui, D., Mao, Z., Sun, Y., Jia, C., ... & He, X. (2022). Quantitative evaluation of traditional Chinese medicine development policy: A PMC index model approach. Frontiers in Public Health, 10, 1041528.
[8]. Giles, J., Lei, X., Wang, G., Wang, Y., & Zhao, Y. (2023). One country, two systems: Evidence on retirement patterns in China. Journal of pension economics & finance, 22(2), 188-210.
[9]. Jessop, B. (2004). From Thatcherism to New Labour: Neo-liberalism, workfarism and labour-market regulation 1. In The political economy of European employment (pp. 137-153). Routledge.
[10]. Mack, M. J. (1958). An evaluation of a retirement-planning program. Journal of Gerontology, 13(2), 198-202.
[11]. Kreps, J. M. (1961). A case study of variables in retirement policy. Monthly Labor Review, 84(6), 587-591.
[12]. Hausman, J. A., & Wise, D. A. (1985). Technical problems in social experimentation: cost versus ease of analysis. In Social Experimentation (pp. 187-220). University of Chicago Press.
[13]. Seligman, B., Tuljapurkar, S., & Rehkopf, D. (2018). Machine learning approaches to the social determinants of health in the health and retirement study. SSM-population health, 4, 95-99.
[14]. Che, Y., & Li, X. (2018). Retirement and health: evidence from China. China Economic Review, 49, 84-95.
[15]. Wang, Q., & Timonen, V. (2021). Retirement pathways and pension inequality in China: A grounded theory study. International Journal of Sociology and Social Policy, 41(13/14), 96-111.
[16]. Huang, W. (2024). Economic impact of retirement on the elderly population: a literature review. China Economic Journal, 1-29.
[17]. Li H, Shi X, Wu B. The retirement consumption puzzle revisited: Evidence from the mandatory retirement policy in China[J]. Journal of Comparative Economics, 2016, 44(3): 623-637.
[18]. Feng, Y. (2024, May). Older Adults’ Reemployment: A Call for Flexible Retirement System in China. In 2024 International Conference on Applied Economics, Management Science and Social Development (AEMSS 2024) (pp. 362-368). Atlantis Press.
[19]. Zhang, Y., Jin, Y., & Xue, X. (2018, August). Evaluation of construction industrialization policy based on PMC index model. In International Conference on Construction and Real Estate Management 2018 (pp. 192-201). Reston, VA: American Society of Civil Engineers.
[20]. Kuang, B., Han, J., Lu, X., Zhang, X., & Fan, X. (2020). Quantitative evaluation of China’s cultivated land protection policies based on the PMC-Index model. Land Use Policy, 99, 105062.
[21]. Li, Z., & Guo, X. (2022). Quantitative evaluation of China's disaster relief policies: a PMC index model approach. International Journal of Disaster Risk Reduction, 74, 102911.
[22]. Trochim, W. M. (2009). Evaluation policy and evaluation practice. New Directions for Evaluation, 2009(123), 13-32.
[23]. King, E. M., & Behrman, J. R. (2009). Timing and duration of exposure in evaluations of social programs. The World Bank Research Observer, 24(1), 55-82.
[24]. Crabb, A., & Leroy, P. (2012). The handbook of environmental policy evaluation. Routledge.
[25]. Ingram, H., & Schneider, A. (1991). The choice of target populations. Administration & Society, 23(3), 333-356.
[26]. Wisner, J. D. (1995). A review of the order release policy research. International Journal of Operations & Production Management, 15(6), 25-40.
[27]. Wollmann, H. (2017). Policy evaluation and evaluation research. In Handbook of public policy analysis (pp. 419-428). Routledge.
[28]. Vedung, E. (2017). Public policy and program evaluation. Routledge.
[29]. DeGroff, A., & Cargo, M. (2009). Policy implementation: Implications for evaluation. New Directions for Evaluation, 2009(124), 47-60.
[30]. Gertler, P. J., Martinez, S., Premand, P., Rawlings, L. B., & Vermeersch, C. M. (2016). Impact evaluation in practice. World Bank Publications.
[31]. Sowers, G. F. (1965). Consistency. Methods of Soil Analysis: Part 1 Physical and Mineralogical Properties, Including Statistics of Measurement and Sampling, 9, 391-399.
[32]. China’s State Council. (2022). Notice of the State Council on Issuing the 14th Five-Year Plan for the Development of National Aging Services and the Elderly Care Service System. 000014349/2021-00150
[33]. Van Engen, N., Steijn, B., & Tummers, L. (2019). Do consistent government policies lead to greater meaningfulness and legitimacy on the front line?. Public Administration, 97(1), 97-115.
[34]. Peking University Magic Weapon. (2017). Notice of The State Council on Strictly implementing the Interim Measures for the Retirement and Retirement of Workers.
[35]. Li, Z., & Guo, X. (2022). Quantitative evaluation of China's disaster relief policies: a PMC index model approach. International Journal of Disaster Risk Reduction, 74, 102911.
[36]. Ketkaew, C., Sukitprapanon, C., & Naruetharadhol, P. (2020). Association between retirement behavior and financial goals: A comparison between urban and rural citizens in China. Cogent Business & Management, 7(1), 1739495.
[37]. Glaeser, E. L., & Ponzetto, G. A. (2014). Shrouded costs of government: The political economy of state and local public pensions. Journal of Public Economics, 116, 89-105.
[38]. MOWBRAY, C. A. R. O. L., Holter, M. C., Teague, G. B., & Bybee, D. (2003). Fidelity criteria: Development, measurement, and validation. The American Journal of Evaluation, 24(3), 315-340.
[39]. Ginsburg, L. R., Hoben, M., Easterbrook, A., Anderson, R. A., Estabrooks, C. A., & Norton, P. G. (2021). Fidelity is not easy! Challenges and guidelines for assessing fidelity in complex interventions. Trials, 22(1), 372.
[40]. The jamovi project (2024). jamovi. (Version 2.6) [Computer Software]. Retrieved from https://www.jamovi.org.
Cite this article
Xu,J. (2025). A Quantitative Research of Retirement Policy in China Based on PMC-AE Index Model. Advances in Economics, Management and Political Sciences,164,27-34.
Data availability
The datasets used and/or analyzed during the current study will be available from the authors upon reasonable request.
Disclaimer/Publisher's Note
The statements, opinions and data contained in all publications are solely those of the individual author(s) and contributor(s) and not of EWA Publishing and/or the editor(s). EWA Publishing and/or the editor(s) disclaim responsibility for any injury to people or property resulting from any ideas, methods, instructions or products referred to in the content.
About volume
Volume title: Proceedings of the 4th International Conference on Business and Policy Studies
© 2024 by the author(s). Licensee EWA Publishing, Oxford, UK. This article is an open access article distributed under the terms and
conditions of the Creative Commons Attribution (CC BY) license. Authors who
publish this series agree to the following terms:
1. Authors retain copyright and grant the series right of first publication with the work simultaneously licensed under a Creative Commons
Attribution License that allows others to share the work with an acknowledgment of the work's authorship and initial publication in this
series.
2. Authors are able to enter into separate, additional contractual arrangements for the non-exclusive distribution of the series's published
version of the work (e.g., post it to an institutional repository or publish it in a book), with an acknowledgment of its initial
publication in this series.
3. Authors are permitted and encouraged to post their work online (e.g., in institutional repositories or on their website) prior to and
during the submission process, as it can lead to productive exchanges, as well as earlier and greater citation of published work (See
Open access policy for details).
References
[1]. Che, Y., & Li, X. (2018). Retirement and health: evidence from China. China Economic Review, 49, 84-95.
[2]. Zhang, L., Gu, J., & An, Y. (2023). The optimal delayed retirement age in aging China: Determination and impact analysis. China Economic Review, 79, 101972.
[3]. Zhang, Q., & Cao, X. (2024). Delayed retirement, pension insurance and income inequality. Kybernetes.
[4]. Peng, J., & Wang, Q. (2024). China’s Pension System: Creating Sustainable and Equitable Social Security. Taylor & Francis.
[5]. Ruiz Estrada, M. A. (2010). The policy modeling research consistency index (PMC-index). Available at SSRN 1689475.
[6]. Lu, C., Wang, B., Chen, T., & Yang, J. (2022). A document analysis of peak carbon emissions and carbon neutrality policies based on a PMC index model in China. International Journal of Environmental Research and Public Health, 19(15), 9312.
[7]. Yang, C., Yin, S., Cui, D., Mao, Z., Sun, Y., Jia, C., ... & He, X. (2022). Quantitative evaluation of traditional Chinese medicine development policy: A PMC index model approach. Frontiers in Public Health, 10, 1041528.
[8]. Giles, J., Lei, X., Wang, G., Wang, Y., & Zhao, Y. (2023). One country, two systems: Evidence on retirement patterns in China. Journal of pension economics & finance, 22(2), 188-210.
[9]. Jessop, B. (2004). From Thatcherism to New Labour: Neo-liberalism, workfarism and labour-market regulation 1. In The political economy of European employment (pp. 137-153). Routledge.
[10]. Mack, M. J. (1958). An evaluation of a retirement-planning program. Journal of Gerontology, 13(2), 198-202.
[11]. Kreps, J. M. (1961). A case study of variables in retirement policy. Monthly Labor Review, 84(6), 587-591.
[12]. Hausman, J. A., & Wise, D. A. (1985). Technical problems in social experimentation: cost versus ease of analysis. In Social Experimentation (pp. 187-220). University of Chicago Press.
[13]. Seligman, B., Tuljapurkar, S., & Rehkopf, D. (2018). Machine learning approaches to the social determinants of health in the health and retirement study. SSM-population health, 4, 95-99.
[14]. Che, Y., & Li, X. (2018). Retirement and health: evidence from China. China Economic Review, 49, 84-95.
[15]. Wang, Q., & Timonen, V. (2021). Retirement pathways and pension inequality in China: A grounded theory study. International Journal of Sociology and Social Policy, 41(13/14), 96-111.
[16]. Huang, W. (2024). Economic impact of retirement on the elderly population: a literature review. China Economic Journal, 1-29.
[17]. Li H, Shi X, Wu B. The retirement consumption puzzle revisited: Evidence from the mandatory retirement policy in China[J]. Journal of Comparative Economics, 2016, 44(3): 623-637.
[18]. Feng, Y. (2024, May). Older Adults’ Reemployment: A Call for Flexible Retirement System in China. In 2024 International Conference on Applied Economics, Management Science and Social Development (AEMSS 2024) (pp. 362-368). Atlantis Press.
[19]. Zhang, Y., Jin, Y., & Xue, X. (2018, August). Evaluation of construction industrialization policy based on PMC index model. In International Conference on Construction and Real Estate Management 2018 (pp. 192-201). Reston, VA: American Society of Civil Engineers.
[20]. Kuang, B., Han, J., Lu, X., Zhang, X., & Fan, X. (2020). Quantitative evaluation of China’s cultivated land protection policies based on the PMC-Index model. Land Use Policy, 99, 105062.
[21]. Li, Z., & Guo, X. (2022). Quantitative evaluation of China's disaster relief policies: a PMC index model approach. International Journal of Disaster Risk Reduction, 74, 102911.
[22]. Trochim, W. M. (2009). Evaluation policy and evaluation practice. New Directions for Evaluation, 2009(123), 13-32.
[23]. King, E. M., & Behrman, J. R. (2009). Timing and duration of exposure in evaluations of social programs. The World Bank Research Observer, 24(1), 55-82.
[24]. Crabb, A., & Leroy, P. (2012). The handbook of environmental policy evaluation. Routledge.
[25]. Ingram, H., & Schneider, A. (1991). The choice of target populations. Administration & Society, 23(3), 333-356.
[26]. Wisner, J. D. (1995). A review of the order release policy research. International Journal of Operations & Production Management, 15(6), 25-40.
[27]. Wollmann, H. (2017). Policy evaluation and evaluation research. In Handbook of public policy analysis (pp. 419-428). Routledge.
[28]. Vedung, E. (2017). Public policy and program evaluation. Routledge.
[29]. DeGroff, A., & Cargo, M. (2009). Policy implementation: Implications for evaluation. New Directions for Evaluation, 2009(124), 47-60.
[30]. Gertler, P. J., Martinez, S., Premand, P., Rawlings, L. B., & Vermeersch, C. M. (2016). Impact evaluation in practice. World Bank Publications.
[31]. Sowers, G. F. (1965). Consistency. Methods of Soil Analysis: Part 1 Physical and Mineralogical Properties, Including Statistics of Measurement and Sampling, 9, 391-399.
[32]. China’s State Council. (2022). Notice of the State Council on Issuing the 14th Five-Year Plan for the Development of National Aging Services and the Elderly Care Service System. 000014349/2021-00150
[33]. Van Engen, N., Steijn, B., & Tummers, L. (2019). Do consistent government policies lead to greater meaningfulness and legitimacy on the front line?. Public Administration, 97(1), 97-115.
[34]. Peking University Magic Weapon. (2017). Notice of The State Council on Strictly implementing the Interim Measures for the Retirement and Retirement of Workers.
[35]. Li, Z., & Guo, X. (2022). Quantitative evaluation of China's disaster relief policies: a PMC index model approach. International Journal of Disaster Risk Reduction, 74, 102911.
[36]. Ketkaew, C., Sukitprapanon, C., & Naruetharadhol, P. (2020). Association between retirement behavior and financial goals: A comparison between urban and rural citizens in China. Cogent Business & Management, 7(1), 1739495.
[37]. Glaeser, E. L., & Ponzetto, G. A. (2014). Shrouded costs of government: The political economy of state and local public pensions. Journal of Public Economics, 116, 89-105.
[38]. MOWBRAY, C. A. R. O. L., Holter, M. C., Teague, G. B., & Bybee, D. (2003). Fidelity criteria: Development, measurement, and validation. The American Journal of Evaluation, 24(3), 315-340.
[39]. Ginsburg, L. R., Hoben, M., Easterbrook, A., Anderson, R. A., Estabrooks, C. A., & Norton, P. G. (2021). Fidelity is not easy! Challenges and guidelines for assessing fidelity in complex interventions. Trials, 22(1), 372.
[40]. The jamovi project (2024). jamovi. (Version 2.6) [Computer Software]. Retrieved from https://www.jamovi.org.