


1. Introduction
With the prevalence of self-media platforms, the role of algorithms in personalized recommendations for mobile apps is highly noteworthy. Adithya Madhusoodanan et al. argue that the platform pushes customized content by analyzing user behavior data such as browsing history, likes, and comments, greatly enhancing the user experience and commercial value. [1]
However, mobile app notifications also have drawbacks. Sumaiya Deen Muhammad et al. suggest that users may face large amounts of uninterested information and advertisements, which can distract them when they are engaged in important tasks. [2]
Moreover, users' awareness of data security and privacy protection is rising, making the transparency of algorithm recommendations a critical issue. Concerns around consumer trust, decision bias, and ethical controversies have emerged, particularly regarding whether users can trust the fairness and authenticity of recommended content. Another intriguing research question is the impact of recommendation algorithms on guiding users toward impulsive and unnecessary purchases. Additionally, scholars are concerned about whether personalized recommendations strengthen information cocoons, limiting consumers' choices.
2. Literature Review
Jognwoo Kim et al. studied a personalized recommendation system for mobile applications. The system aimed to analyze user preferences by examining the common attributes between target members and their social members. [3] They developed a prototype using Ontology Web Language, demonstrating the algorithm's feasibility and analyzing mobile users' preferences.
Algorithm transparency refers to the level of understanding that users have about algorithm logic and data processing, including interpretability and operability. René F. Kizilcec built on information processing and procedural justice theory, dividing the impact of transparency on trust into two stages. This study suggests increased transparency may enhance user trust, but excessive disclosure of complex information can lead to cognitive burden, implying that transparency should be balanced to increase trust.
Consumer trust, influenced by the authenticity of algorithm recommendations, brand image, and user experience, can also affect app users' consumption intentions and attitudes toward brands. Siva Simhadri and Sudip Vhaduri conducted a comprehensive study of trust across various app types and channels through which users discover apps. Their research found that professional recommendations boosted trust, particularly for health and payment apps, suggesting that app developers need to consider specific recommendation groups when marketing their applications. [4]
In recent years, studies on consumer behavior, particularly regarding privacy, security, and data use in smartphone apps, have gained prominence. Soo Ling Lim et al. found significant differences in user behavior across countries, revealing preferences regarding the appearance, functionality, and price sensitivity of applications. [5]
2.1. Research Innovation
This study introduces technological literacy as a moderating factor, providing a foundation for managing different user groups. Consumers will be grouped based on their level of technological literacy to study how this influences their trust and attitude toward using apps. Technological literacy can be quantified using variables such as years of education, educational background, or major.
Another innovation lies in the experimental methods. By simulating real platform scenarios and varying transparency levels, the study will enhance ecological validity. A virtual self-media platform will be designed to display recommended products with different algorithm explanations for various user groups. This flexibility will allow respondents to engage with the platform at their convenience, ensuring more authentic behavior.
Lastly, the study expands beyond previous research's narrow focus on algorithm performance to explore the broader impact of transparency on consumer behavior. The study will use an inter-group comparative experiment with three levels of transparency: completely transparent, partially transparent, and completely black box. Participants will receive varying levels of explanation for algorithm recommendations, allowing the study to assess transparency’s impact on consumers' cognition, interest, and purchase intention using the AIDA model.
2.2. Expected Results
This research was conducted through an online questionnaire from January 1st, 2025 to January 5th, 2025, with a period of 5 days. Research targeted users of short-video platforms. A total of 120 questionnaires were distributed both online and offline, with 107 valid responses, resulting in an effective response rate of 89.17%. This research conformed to the ratio requirement that the number of test items and the number of questionnaires in the reliability and validity analysis should not be lower than 1:5, thus the sample size was adequate.
After obtaining the data, the following steps will be taken:
Data Preprocessing: Results from the questionnaire will be entered into Excel for preliminary checks and cleaning. Missing values will be handled using the mean imputation method.
Statistical Analysis: Data will be analyzed using SPSS, with basic statistics such as mean, standard deviation, and frequency distributions of transparency perception, consumer trust, and purchase intention. Pie charts and bar charts will be used to visualize the sample characteristics, such as gender and age distribution.
Correlation and Regression Analysis: Correlation analysis, variance analysis, and simple regression analysis will be conducted. The expected results include a significant positive impact of algorithm transparency on consumer trust and purchasing intentions.
3. Empirical analysis results
3.1. Demographic information distribution
In the demographic frequency analysis results. First, in terms of gender distribution, male and female users are almost evenly divided, with female users slightly more dominant, accounting for 51.40%.
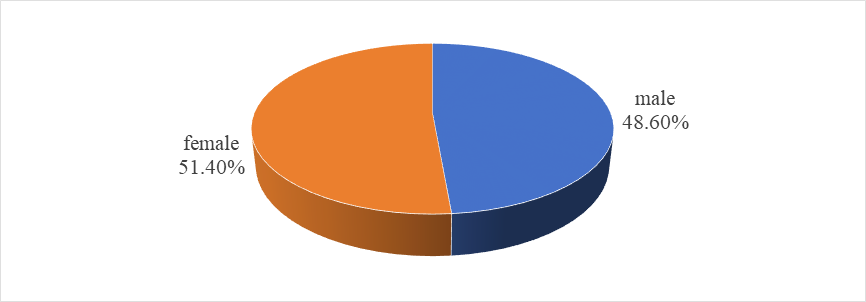
Figure 1: Gender distribution of the sample
In terms of age distribution, the user group aged 18-25 is the largest, accounting for 31.78%, which reflects the strong demand of young people for video content. At the same time, users aged 26-35 also account for a certain proportion, reaching 29.91%, indicating that the middle-aged group also has a high degree of attention to video content. The user groups under 18 and 36 and above are relatively small.
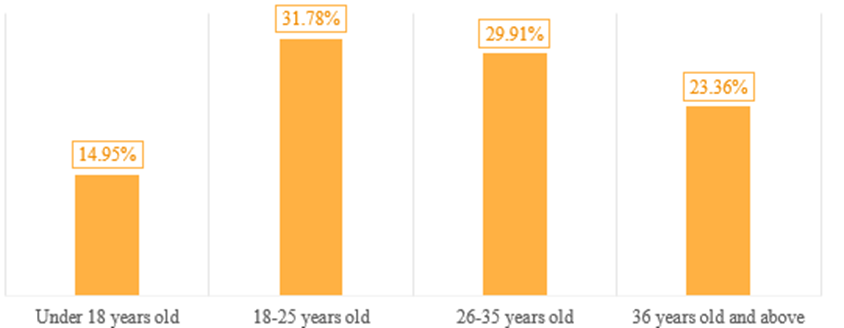
Figure 2: Age distribution of the sample
In terms of occupational distribution, corporate employees and freelancers account for a considerable proportion, which is 47.66% and 23.36% respectively. There are also a certain number of students and users from other professions.
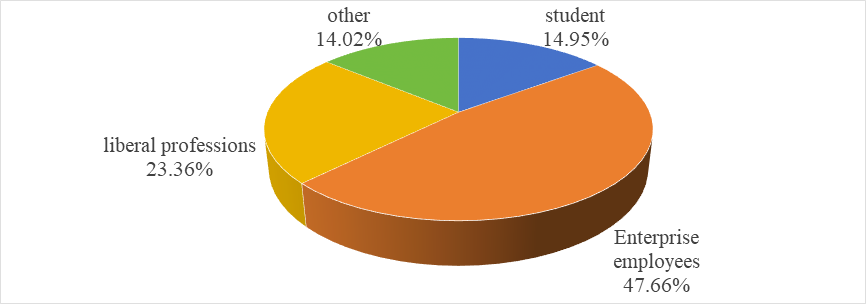
Figure 3: Occupational distribution of the sample
In terms of platform usage frequency, daily users account for the highest proportion, reaching 43.93%. This shows that users are highly dependent on and sticky to YouTube. More than 20% of users use it several times a week or several times a month and are users who regularly browse video content, while the number of users who use it occasionally is relatively small.
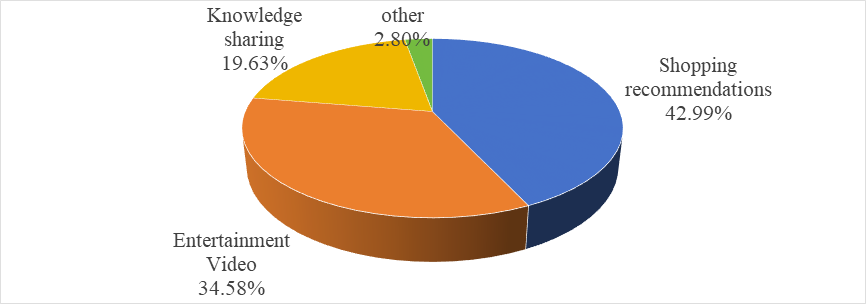
Figure 4: the content focus of the sample
In terms of the most frequently viewed content types, shopping recommendations, and entertainment videos took the top two spots, accounting for 42.99% and 34.58% respectively, reflecting users' strong interest in these two types of content. Knowledge sharing and other types of content accounted for a smaller proportion.
3.2. Reliability Analysis
In the range of Cronbach's α coefficient, the α coefficient ranges from 0 to 1. Reliability above 0.70 is generally considered to be an ideal reliability, indicating that the scale has high reliability. Between 0.60 and 0.65, the reliability is low and it is recommended to avoid using it unless it has to be used in specific circumstances. 0.65 to 0.70 is the lowest acceptable reliability, but it may affect the explanatory power of the results. It is best to further optimize the scale. 0.70 to 0.80 is a higher reliability level, which is generally considered to have good stability and consistency. 0.80 to 0.90 is a very reliable reliability level, indicating that the scale is very consistent and suitable for more rigorous research. In the dimensions of transparency perception, trust, and purchase intention, the reliability levels of 0.876, 0.877, and 0.847 were obtained respectively, which shows that the scales of these dimensions have good internal consistency when measuring and can be used as reliable indicators for subsequent analysis.
Table 1: Reliability Analysis
Dimensions | Questionnaire content | Correction Total Correlation | α coefficient with term deleted | Cronbach'sα |
Perception of transparency Trust Dimensions | I understand how the platform recommends content | 0.759 | 0.830 | 0.876 |
The platform discloses the basic principles of the recommendation algorithm to users | 0.756 | 0.831 | ||
I can choose to adjust the preferences of recommended content (such as tags, areas of interest) | 0.720 | 0.846 | ||
The platform's recommended content meets my expectations | 0.697 | 0.854 | ||
Perception of transparency Trust Dimensions | I trust the content recommended by the platform | 0.787 | 0.823 | 0.877 |
I believe that the content recommended by the platform meets my real needs | 0.668 | 0.869 | ||
I believe that the platform will not abuse my personal data | 0.789 | 0.821 | ||
The platform can objectively recommend high-quality goods or services | 0.712 | 0.852 | ||
Perception of transparency | I am willing to buy products recommended by the platform | 0.614 | 0.835 | 0.847 |
The content recommended by the platform makes me want to buy | 0.672 | 0.811 | ||
If my friends need it, I will recommend the goods or services on the platform | 0.718 | 0.790 | ||
I have actually purchased under the recommendation of the platform | 0.733 | 0.784 |
3.3. Validity analysis
In the variable validity analysis, the KMO value range is [0,1]. The larger the value, the more suitable the selected sample is for factor analysis (>0.6 is the minimum threshold). In this sample, the KMO values of transparency perception, trust, and purchase intention are 0.828, 0.828, and 0.809, respectively. All three values are greater than 0.6, indicating that the sample has good internal consistency and is suitable for the numerical standard of factor analysis.
Table 2: Validity Analysis
Dimensions | Questionnaire content | Factor loading | CR | KMO coefficient |
Perception of transparency Trust Dimensions | I understand how the platform recommends content | 0.871 | 0.759 | 0.828 |
The platform discloses the basic principles of the recommendation algorithm to users | 0.869 | 0.756 | ||
I can choose to adjust the preferences of recommended content (such as tags, areas of interest) | 0.844 | 0.713 | ||
The platform's recommended content meets my expectations | 0.830 | 0.688 | ||
Perception of transparency Trust Dimensions | I trust the content recommended by the platform | 0.888 | 0.789 | 0.828 |
I believe that the content recommended by the platform meets my real needs | 0.806 | 0.649 | ||
I believe that the platform will not abuse my personal data | 0.889 | 0.790 | ||
The platform can objectively recommend high-quality goods or services | 0.837 | 0.701 | ||
Perception of transparency | I am willing to buy products recommended by the platform | 0.775 | 0.600 | 0.809 |
The content recommended by the platform makes me want to buy | 0.820 | 0.673 | ||
If my friends need it, I will recommend the goods or services on the platform | 0.852 | 0.726 | ||
I have actually purchased under the recommendation of the platform | 0.863 | 0.744 |
3.4. Difference analysis
From the difference analysis in Table 2, it can be observed that there are individual differences in the impact scores of the fully transparent, partially transparent, and completely black box groups on respondents' transparency perception, trust, and purchase intention. The grouping is significant at the 0.01 level of transparency perception (F=10.639, p<0.01). Therefore, the score comparison results are: fully transparent group>completely black box group; partially transparent group>completely black box group.
The result of the trust group significance test is F=8.439, p<0.01, and the comparison results are: fully transparent group>partially transparent group; fully transparent group>completely black box group.
The result of the purchase intention group significance test is F=5.032, p=0.008<0.01, and the comparison results are: fully transparent group>completely black box group.
Table 3: ANOVA of different groups on transparency perception, trust level, and purchase intention
Category (M±SD) | F | p | |||
Completely transparent group(n=48) | Partially transparent group(n=30) | Completely black box group(n=29) | |||
Transparency perception | 4.03±0.88 | 3.96±0.75 | 3.04±1.24 | 10.639 | 0.000 |
Trust level | 4.24±0.72 | 3.67±1.11 | 3.34±1.14 | 8.439 | 0.000 |
Purchase intention | 4.07±0.87 | 3.77±0.90 | 3.37±1.06 | 5.032 | 0.008 |
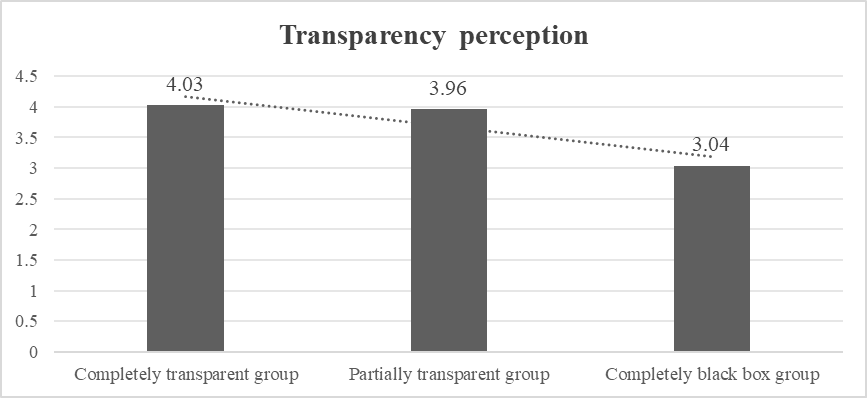
Figure 5: Transparency perception of respondents
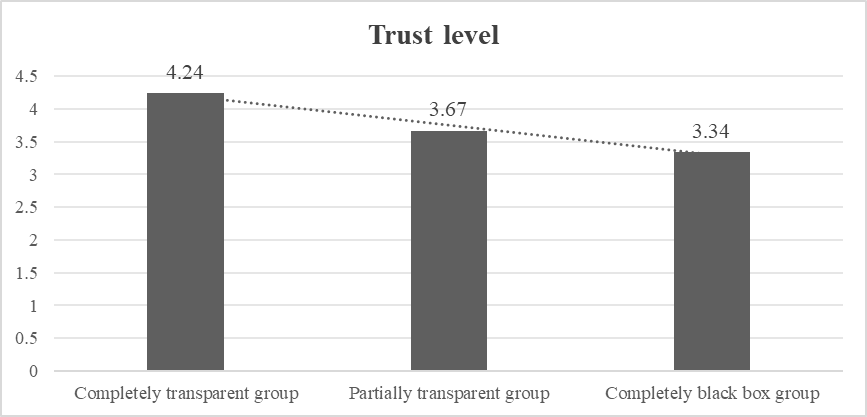
Figure 6: Trust level of respondents
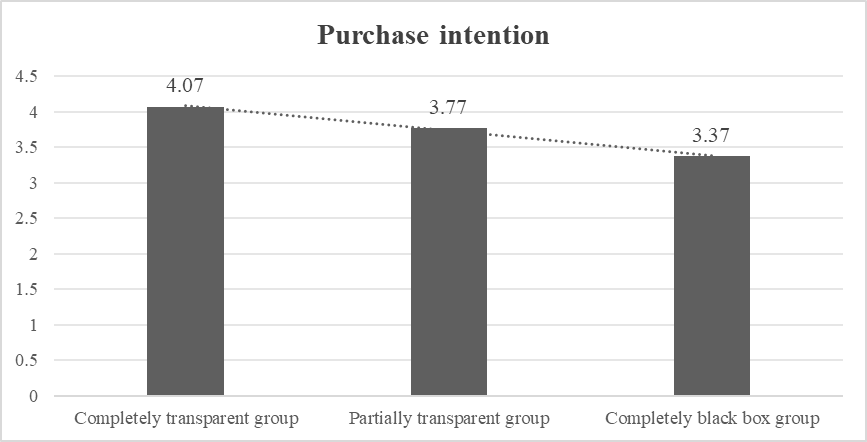
Figure 7: Purchase intention of respondents
3.5. Correlation analysis
Table 4 shows the correlation between transparency perception, trust, and purchase intention. From the results in the fourth column, it is found that the correlation coefficient between transparency perception and trust is 0.501 (p < 0.01), indicating that the two variables have a strong positive correlation, while the correlation coefficient between transparency perception and purchase intention is 0.605 (p < 0.01), which also has a strong positive correlation.
Table 4: Pearson correlation
Mean | Standard Deviation | Transparency perception | Trust level | Purchase intention | |
Transparency perception | 3.743 | 1.043 | 1 | ||
Trust level | 3.836 | 1.029 | 0.501** | 1 | |
Purchase intention | 3.797 | 0.970 | 0.605** | 0.462** | 1 |
* p<0.05 ** p<0.01 | |||||
3.6. Regression analysis
In the linear regression, transparency perception is the independent variable and trust is the dependent variable. The regression model formula is:
The intercept term (1.986) indicates that when the transparency perception is 0, the expected value of trust is 1.986. The regression coefficient (0.494) indicates that for every 1 unit increase in the transparency perception, the expected value of trust increases by 0.494 units. The R-squared value = 0.251 indicates that the transparency perception of the respondents in the sample explains more than a quarter of the variation in trust. F = 35.189, p < 0.01, the entire regression model is highly significant. Since the value is less than 0.01, it shows that in this model, the transparency perception of the respondents has a statistically significant predictive effect on trust.
Table 5: Linear regression analysis results of transparency perception on trust n=10
Unstandardized coefficients | Standardized coefficients | t | p | ||
B | Standard error | Beta | |||
constant | 1.986 | 0.324 | - | 6.136 | 0.000 |
Transparency perception | 0.494 | 0.083 | 0.501 | 5.932 | 0.000 |
R 2 | 0.251 | ||||
Adjusted R 2 | 0.244 | ||||
F | F (1,105)=35.189,p=0.000 | ||||
D-W value | 1.707 | ||||
Note: Dependent variable: Trust level | |||||
* p<0.05 ** p<0.01 | |||||
3.7. Mediating effect analysis
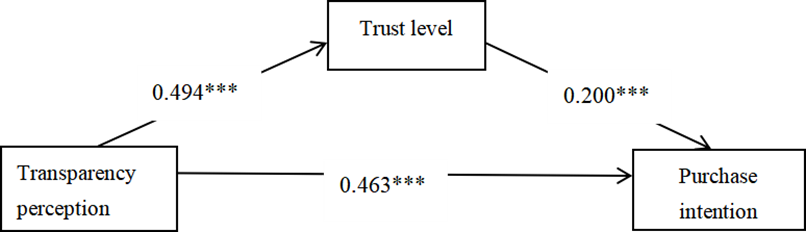
Figure 8: The mediating effect model of trust in transparency perception on purchase intention
In studying the mediating effect of trust on transparency perception and purchase intention, we first regressed transparency perception and purchase intention, and found that transparency perception has a significant positive impact on purchase intention; then we regressed transparency perception and trust and found that transparency perception can positively affect trust. Finally, we regressed transparency perception and trust with purchase intention at the same time and found that both transparency perception and trust have a significant positive impact on purchase intention.
Table 6: A model test of the mediating effect of trust on transparency perception and purchase intention
Purchase intention | Trust level | Purchase intention | |
constant | 1.692**(6.023) | 1.986**(6.136) | 1.294**(4.044) |
Transparency perception | 0.562**(7.778) | 0.494**(5.932) | 0.463**(5.674) |
Trust level | 0.200*(2.417) | ||
N | 107 | 107 | 107 |
R 2 | 0.366 | 0.251 | 0.399 |
AdjustedR 2 | 0.360 | 0.244 | 0.388 |
F value | F (1,105)=60.498,p=0.000 | F (1,105)=35.189,p=0.000 | F (2,104)=34.564,p=0.000 |
* p<0.05 ** p<0.01, () is the t value | |||
The indirect effect and confidence interval of the path "transparency perception → trust → purchase intention" were tested using the PROCESS plug-in of SPSS. The results showed that the indirect effect value of the path above is 0.099, with a confidence interval [0.013-0.244] (“0” is not included). Therefore, it can be inferred that in the collected samples, the trust of the respondents played a partial mediating role in the process of their transparency perception affecting purchase intention.
Table 7: Results of the mediation test
Test | meaning | Effect size | 95% CI | z-value/ t-value | p-value | Effect results | |
Lower limit | Upper limit | ||||||
Transparency perception=>Trust level=>Purchase intention | Indirect effects | 0.099 | 0.013 | 0.244 | 1.677 | 0.094 | Partial mediation effect |
Transparency perception=>Trust level | X=>M | 0.494 | 0.331 | 0.658 | 5.932 | 0.000 | |
Trust level=>Purchase intention | M=>Y | 0.200 | 0.038 | 0.362 | 2.417 | 0.017 | |
Transparency perception=>Purchase intention | Direct Effect | 0.463 | 0.303 | 0.624 | 5.674 | 0.000 | |
Transparency perception=>Purchase intention | Total Effect | 0.562 | 0.421 | 0.704 | 7.778 | 0.000 | |
The results of this survey indicate that there are significant differences in the scores of transparency perception, trust level, and purchase intention among the fully transparent, partially transparent, and completely opaque groups. Transparency perception has a significant positive impact on trust levels. Trust level plays a partial mediating role in the influence of algorithm transparency on purchase intention. The level of algorithm transparency has a significant impact on the trust level and purchase intention of respondents. The fully transparent group scored higher than the partially transparent group and the completely opaque group in terms of transparency perception, trust level, and purchase intention, indicating that respondents are more inclined to trust products or services with high algorithm transparency. Meanwhile, the partially transparent group also scored higher than the completely opaque group in all three indicators, further demonstrating the importance of transparency in enhancing trust level and purchase intention. There is a significant positive relationship between transparency perception and trust level, meaning that the higher the transparency, the higher the trust level of respondents. This suggests that increasing the transparency of algorithms can help enhance the trust of respondents in algorithms or products. Trust level plays a partial mediating role in the influence of algorithm transparency on purchase intention, indicating that transparency not only directly affects purchase intention but also indirectly influences it through its impact on the trust level. Therefore, algorithm transparency has a significant effect on enhancing the trust level and purchase intention of respondents. When designing and applying algorithms, enterprises should focus on improving the transparency of algorithms to enhance consumers' trust and purchase intention.
4. Conclusion
This study underscores the critical role that transparency perception plays in fostering trust and driving consumer purchase intentions in digital platforms. The findings, derived from regression and mediation analyses, offer robust evidence that transparency perception has a direct, positive effect on trust. This trust, in turn, significantly influences consumers' intentions to purchase, establishing transparency as a key factor in enhancing consumer engagement and behavior.
The linear regression model demonstrated that transparency perception is a strong predictor of trust, with an R-squared value of 0.251, signifying that more than a quarter of the variation in trust is explained by transparency perception. The significant p-value (p < 0.01) further reinforces the statistical validity of the model. This relationship aligns with previous research that highlights transparency as a cornerstone of building consumer trust, particularly in e-commerce and digital content consumption.
Moreover, the mediating effect analysis revealed that trust partially mediates the relationship between transparency perception and purchase intention. This suggests that while transparency perception directly affects purchase intentions, trust plays a crucial intermediary role in shaping consumer decisions. This finding is particularly relevant for marketers and businesses aiming to optimize their digital platforms and enhance consumer loyalty.
Additionally, the study identified demographic patterns that could further inform marketing strategies. For instance, younger consumers (ages 18-35) were found to engage more actively with digital platforms, particularly about content consumption. This insight suggests that businesses targeting this demographic may benefit from increasing transparency in their communications to build trust and drive engagement.
While the current research has provided valuable insights into the relationship between transparency, trust, and purchase intention, several avenues for future research remain. First, it would be beneficial to explore the role of other potential mediators, such as perceived value or perceived quality, in the transparency-trust-purchase intention relationship. Further investigation could also examine how transparency influences consumer behavior across different industries, such as finance, health care, or retail, where the stakes of trust and information sharing may vary significantly. Additionally, cross-cultural studies could provide a broader perspective on how transparency is perceived and valued in different global markets.
In conclusion, this study contributes to the growing body of knowledge on consumer behavior in the digital age. By emphasizing the importance of transparency in building trust and driving purchase intention, the findings provide actionable insights for businesses seeking to strengthen their relationships with consumers. By prioritizing transparency in their communication strategies, businesses can enhance trust, foster loyalty, and ultimately drive greater consumer engagement and sales.
Acknowledgments
Hongyi Liu contributed to this work and should be considered the first author. I sincerely thank all those who have assisted me in this paper.
References
[1]. Madhusoodanan, A. et al. (2020) ‘Machine learning approach to manage adaptive push notifications for improving user experience’, MobiQuitous 2020 - 17th EAI International Conference on Mobile and Ubiquitous Systems: Computing, Networking and Services, pp. 488–493. doi:10.1145/3448891.3448956.
[2]. Deen Muhammad, S., Tasnim, F. and Sharmin, S. (2021) ‘Mobile phone SMS notification behavior analysis using machine learning technique’, Advances in Intelligent Systems and Computing, pp. 167–177. doi:10.1007/978-981-16-2597-8_14.
[3]. Kim, J. et al. (2011) ‘Recommendation algorithm of the app store by using semantic relations between apps’, The Journal of Supercomputing, 65(1), pp. 16–26. doi:10.1007/s11227-011-0701-6.
[4]. Simhadri, S. and Vhaduri, S. (2023) ‘Understanding user trust in different recommenders and smartphone applications’, Lecture Notes of the Institute for Computer Sciences, Social Informatics and Telecommunications Engineering, pp. 347–361. doi:10.1007/978-3-031-32029-3_29.
[5]. Lim, S.L. et al. (2015) ‘Investigating country differences in mobile app user behavior and challenges for software engineering’, IEEE Transactions on Software Engineering, 41(1), pp. 40–64. doi:10.1109/tse.2014.2360674.
Cite this article
Liu,H. (2025). Algorithm Transparency and Its Impact on Mobile App User Experience: A YouTube Case Study. Advances in Economics, Management and Political Sciences,166,57-70.
Data availability
The datasets used and/or analyzed during the current study will be available from the authors upon reasonable request.
Disclaimer/Publisher's Note
The statements, opinions and data contained in all publications are solely those of the individual author(s) and contributor(s) and not of EWA Publishing and/or the editor(s). EWA Publishing and/or the editor(s) disclaim responsibility for any injury to people or property resulting from any ideas, methods, instructions or products referred to in the content.
About volume
Volume title: Proceedings of the 4th International Conference on Business and Policy Studies
© 2024 by the author(s). Licensee EWA Publishing, Oxford, UK. This article is an open access article distributed under the terms and
conditions of the Creative Commons Attribution (CC BY) license. Authors who
publish this series agree to the following terms:
1. Authors retain copyright and grant the series right of first publication with the work simultaneously licensed under a Creative Commons
Attribution License that allows others to share the work with an acknowledgment of the work's authorship and initial publication in this
series.
2. Authors are able to enter into separate, additional contractual arrangements for the non-exclusive distribution of the series's published
version of the work (e.g., post it to an institutional repository or publish it in a book), with an acknowledgment of its initial
publication in this series.
3. Authors are permitted and encouraged to post their work online (e.g., in institutional repositories or on their website) prior to and
during the submission process, as it can lead to productive exchanges, as well as earlier and greater citation of published work (See
Open access policy for details).
References
[1]. Madhusoodanan, A. et al. (2020) ‘Machine learning approach to manage adaptive push notifications for improving user experience’, MobiQuitous 2020 - 17th EAI International Conference on Mobile and Ubiquitous Systems: Computing, Networking and Services, pp. 488–493. doi:10.1145/3448891.3448956.
[2]. Deen Muhammad, S., Tasnim, F. and Sharmin, S. (2021) ‘Mobile phone SMS notification behavior analysis using machine learning technique’, Advances in Intelligent Systems and Computing, pp. 167–177. doi:10.1007/978-981-16-2597-8_14.
[3]. Kim, J. et al. (2011) ‘Recommendation algorithm of the app store by using semantic relations between apps’, The Journal of Supercomputing, 65(1), pp. 16–26. doi:10.1007/s11227-011-0701-6.
[4]. Simhadri, S. and Vhaduri, S. (2023) ‘Understanding user trust in different recommenders and smartphone applications’, Lecture Notes of the Institute for Computer Sciences, Social Informatics and Telecommunications Engineering, pp. 347–361. doi:10.1007/978-3-031-32029-3_29.
[5]. Lim, S.L. et al. (2015) ‘Investigating country differences in mobile app user behavior and challenges for software engineering’, IEEE Transactions on Software Engineering, 41(1), pp. 40–64. doi:10.1109/tse.2014.2360674.