


1. Introduction
In today's increasingly fierce global competition, innovation has been established as the core development strategy of the country,which is not only the source of scientific and technological progress, but also the key driving force for the transformation and upgrading of enterprises and the enhancement of international competitiveness. In this context, employee satisfaction, crucial in organizational behavior and HR management, is increasingly important. It reflects enterprise harmony, HR effectiveness, and linked to innovation potential and long-term development.
Employee satisfaction covers various aspects such as salary satisfaction, work environment comfort, interpersonal harmony, and the attractiveness and challenge of work content [1]. These elements not only affecting their daily work efficiency and loyalty, but also shaping the cultural atmosphere and innovation ability of the enterprise at a deeper level.
However, despite its importance, domestic studies on employee satisfaction are scarce and mainly focus on state-owned enterprises, lacking exploration of private enterprises and joint ventures. This limits our understanding of the relationship between employee satisfaction and corporate innovation. This paper aims to fill the gap by analyzing the relationship between employee satisfaction and enterprise innovation, providing empirical and theoretical support for HR and innovation strategies, enhancing enterprise competitiveness and aiding national innovation strategies.
2. Literature review
2.1. Economic consequences of employee satisfaction
Employee satisfaction has a significant impact on the economic consequences of an organization in the following ways:
There is a positive correlation between employee satisfaction and organizational performance. Hong Liu [2] stated that employee satisfaction directly affects their motivation and performance, which in turn affects the profitability of the firm. Several studies have shown that employee satisfaction is an important factor influencing organizational citizenship behavior. This suggests that when employees are satisfied with their jobs, they are more likely to exhibit positive behaviors that go beyond the scope of their duties[3]. However, many studies have focused on a single dimension and have failed to fully explore the dynamic relationship and mutual influence between the two.
Research has shown that there is a significant positive relationship between unit-level employee satisfaction and business unit outcomes such as employee turnover [4]. High employee satisfaction reduces turnover, cutting recruiting and training costs, and enhancing organizational operating margins.
Effective human resource management practices can enhance employee satisfaction, ultimately achieving return on investment and competitive advantage[5]. When employees are satisfied, they invest more energy and enthusiasm into their work, boosting team dynamics and creativity. This positive atmosphere increases productivity, enhances teamwork, and fosters innovation, ultimately leading to a competitive advantage and return on investment for the organization through higher quality outputs.
2.2. Factors influencing innovation in enterprises
Factors affecting innovation in business are manifold and include both internal and external factors. We can summarize these factors into the following main categories.
Organizational learning and dynamic capabilities play a mediating role between strategic learning and organizational innovation. Strategic learning includes not only the process dimension of organizational learning but also the content dimension of knowledge management, which significantly affect organizational innovation. The three dimensions of dynamic capabilities of perceived response, integrated utilization, and reconfigured transformation play a fully or partially mediating role in the relationship between strategic learning and organizational innovation [6]. Flexibility of organizational structure and technological innovation: the flexible design of organizational structure can promote technological innovation. Through the principle of structuring and flexibilizing structural elements, organizational structures that are conducive to both the generation and execution of innovative ideas are designed according to the characteristics of the environment in which the innovative ideas are generated [7].
Basic financial characteristics and governance structure characteristics also affect a firm's ability to innovate [8]. Basic financial characteristics, such as profitability, gearing ratio, and cash flow position, affect a firm's ability to utilize capital. If a firm is financially sound, it is able to freely allocate resources for R&D and innovation, while governance structures such as the composition of the board of directors and the transparency of the management determine the efficiency of decision-making and the ability to control risks, which are key factors in driving innovation. Corporate culture and leadership style, as well as incentives for employees, are also key factors influencing the enhancement of firms' innovativeness [9]. Corporate culture refers to the values and beliefs within a company. If the culture emphasizes innovation and collaboration, employees are more willing to share ideas and come up with new solutions. Leadership style is equally important; open and supportive leaders can encourage employees to take risks and try new things, while strong incentives, such as performance rewards and career development opportunities, enhance employees' sense of belonging and willingness to innovate, creating a positive climate for innovation.
Lu Xianxiang et al. [8] mentioned that the institutional environment, the state of market competition and the level of financial development are important macro-factors affecting enterprise innovation. The maturity of the technology market and the improvement of the legal environment also have an important impact on the independent innovation of enterprises [10]. The maturity of the technology market and the perfection of the legal environment have a significant role in promoting the independent innovation of enterprises. First of all, the maturity of the technology market can incentivize enterprises to innovate by providing more market opportunities and a broader customer base. A mature market can provide firms with sufficient information and feedback to help them adjust their products and services to better meet market demand.
Secondly, the degree of perfection of the legal environment is another key factor. A well-developed legal environment can provide legal protection for firms' innovative activities and reduce the number of cases where firms are deterred from innovating for fear of legal risks . Heimonen [11] argues that the strength of legal protection in terms of intellectual property rights is also an important factor influencing firms' innovation. If the macro-environment will develop protection mechanisms for firms' innovative behavior, then firms will be more motivated to innovate. Firms also need to have the appropriate innovation mechanisms and culture internally, as well as sufficient financial and technical support, in order to truly achieve sustained autonomous innovation [12].
The market competition situation and the level of financial development also affect the innovative behavior of enterprises [8]. If the enterprise is in a perfectly competitive market, the enterprise will continuously improve its ability, productivity and innovation in order to stand out from the many competitors to gain more profit. However, most of the existing literature has not given enough consideration to the external environmental factors (e.g., market competition, policy support, etc.) that affect employee satisfaction and corporate innovation, and fails to fully reflect the actual situation.
3. Research hypotheses
Highly satisfied employees may be more inclined to come up with innovative ideas, participate in innovative projects, and improve productivity and performance, thus contributing to corporate innovation activities. In general, employee satisfaction can greatly stimulate corporate innovativeness. High employee satisfaction reflects the extent to which employees recognize the organizational culture and environment, which in turn shapes a positive work atmosphere. This atmosphere encourages employees to come up with new ideas, try new approaches, and be willing to contribute to the realization of innovative goals. In addition, employees are more motivated to participate in the organization's innovative activities and projects. They are more inclined to share ideas, provide constructive suggestions, and actively participate in the innovation decision-making and implementation process. And highly satisfied teams are more likely to demonstrate good teamwork and communication skills, which help promote knowledge sharing, idea collision and collective innovation. Overall, high employee satisfaction creates a positive work environment, enhances employee engagement and teamwork, stimulates creativity and innovation, and thus promotes continuous innovation and development of the organization.
In this context, the mechanism of the influence of employee satisfaction on the innovation capacity of enterprises can be analyzed through a variety of specific factors. First, creativity and work motivation are among the key factors. Research has shown that increased employee satisfaction enhances employees' creative thinking and enables them to demonstrate higher innovation potential at work [4]. Satisfied employees usually show more enthusiasm and commitment to their work, thus promoting an innovative atmosphere within the organization. In addition, talent attraction is also an important factor. A high level of employee satisfaction has been shown to attract more highly qualified people to the firm, which not only enhances the firm's technological capabilities, but also further enhances its innovation capabilities [13].
Based on this logical path, we propose the following hypothesis H1: Employee satisfaction is positively related to the level of corporate innovation. Specifically, high employee satisfaction ultimately promotes the level of corporate innovation by reducing management costs, increasing employee creativity, reducing marketing costs, and improving ESG performance. This hypothesis provides a theoretical basis for subsequent empirical research and emphasizes the importance of paying attention to employee satisfaction in corporate management.
4. Study design
4.1. Sample selection
The research sample of this paper is listed companies in China from 2019 to 2023. Employee satisfaction data in this paper comes from the "Best Employers White Paper" published by WisdomLink Recruitment and the "Top 100 Best Employers in China" jointly published by the Social Survey Research Center of Peking University since 2011. Data codes for industry categories are from the China Securities Regulatory Commission. The basic information, financial data and corporate governance data of listed companies are from CSMAR and the National Bureau of Statistics. The empirical analysis in this paper is mainly based on firm-annual level observations.
After obtaining the data based on the data sources mentioned above, for the initial data, the paper performed the following treatments: (1) companies in the financial sector and ST samples were excluded; (2) companies with relevant data missing for more than four consecutive years were excluded; and (3) in order to reduce the impact of outliers, all continuous variables were Winsorized at the 1% level. (4) All nulls in the independent and dependent variables were excluded, and all control variables with more than one null were excluded.
4.2. Variables and Modeling
4.2.1. Measurement of variables
The independent variable of this paper is employee satisfaction: this paper draws on Liu Jing and Lin Shu [14] to quantify employee satisfaction ( \( Employee\_Satisfaction \) , ES) using the dummy variable of whether a listed company is on the "Top 100 Best Employers in China" list (Top100), which takes the value of 1 if the company is on the annual list of the top 100 best employers, and 0 otherwise. The PSM method is also applied to match the samples of listed companies on the Top 100 list to alleviate the endogeneity problem.
The dependent variable is the degree of innovation of the enterprise: this paper draws on the research method of Xuan Zhou et al. [15] and according to the "Evaluation Indicator System of Enterprise's Innovation Capacity" issued by the Ministry of Science and Technology of the People's Republic of China, with the help of a number of indicators to collectively measure the innovation capacity of the enterprise ( \( Innovation \) ): the number of enterprise's patent applications (Apply ), the number of enterprise's patent applications for invention ( \( Invention\_sum \) ), the enterprise's innovation expenditure (R&D), the enterprise's innovation manpower ( \( Manpower \) ).
The rest of the control variables in this paper refer to the studies of Guan Kaolai et al. [16], etc. In this paper, other factors that may affect corporate innovation, such as corporate finance as well as governance characteristics, are selected as control variables (CONTROLS). In addition, year and industry fixed effects are also controlled in the model. A detailed description of the main variables in this paper is shown in Table 1.
Table 1: Variable description table.
Variable Type | Variable Code | Variable Definition |
Dependent variable | Apply | log (number of patents filed by the firm in a year + 1) |
Invention_sum | log (total number of patents for inventions filed + 1) | |
R&D | Innovation Expenditure as % of Main Business Revenue | |
Manpower | Number of R&D personnel as a percentage of the total (%) | |
Independent Variable | ES | takes the value of 1 if the company is selected as one of the top 100 "Best Employers in China" in the current year, otherwise it takes the value of 0. |
Control variables | Lev | Total liabilities/total assets |
Size | Log( total assets+1) | |
ROE | Net profit/total assets | |
SOE | Takes the value of 1 if the listed company is a state-owned enterprise and 0 otherwise | |
Board | Number of sole directors/total number of directors | |
Industry | SEC 2021 Industry Classification Codes | |
Year | Year | |
Cashflow | Net cash flow from operating activities/current liabilities at end of period | |
Top5 | Number of shares held by top five shareholders/total number of shares | |
big4 | If the listed company is audited by a Big 4 firm, it takes the value of 1, otherwise it takes 0 | |
tang | (Net Fixed Assets + Net Inventory)/Total Assets | |
B/M | Book value per share/market value per share |
4.2.2. Modeling
Hypothesis H1 indicates that high employee satisfaction has a positive impact on corporate innovation. In the benchmark regression mode model, the following formula can be designed:
\( Innovation={β_{0}}+{β_{1}}{ES_{it}}+{β_{2}}\sum _{i=1}^{8}{Control_{it}}+{λ_{i}}+{μ_{t}}+{ε_{it}} \)
Where, \( Innovation \) is the observation of the dependent variable of firm innovation. \( E \) S is the independent variable of employee satisfaction, which represents the level of employee satisfaction with the work environment, benefits and perks. \( Control \) denotes the information set, i.e., all control variables except the core explanatory variables. \( {β_{0}} \) is the constant term, \( {β_{1}} \) is the coefficient to be estimated, which represents the effect of employee satisfaction on firm innovation. \( {λ_{i}} \) denotes industry fixed effects, \( {μ_{t}} \) denotes time fixed effects, and \( {ε_{it}} \) denotes a random perturbation term obeying a white noise process.
This model can help to analyze the impact of employee satisfaction on corporate innovation to test whether hypothesis H1 is valid.
5. Empirical analysis
5.1. Descriptive statistics
Table 2: Descriptive statistics of variables.
Variable | Obs | Mean | Std.Dev. | Min | Max |
RD | 12,383 | 0.0563 | 0.0580 | 0.0004 | 0.4030 |
Manpower | 12,383 | 0.1710 | 0.1390 | 0.0000 | 0.9450 |
lnApply | 12,383 | 1.2430 | 2.0190 | 0.0000 | 9.9520 |
lnInvention | 12,383 | 0.8230 | 1.4800 | 0.0000 | 8.9660 |
ES | 12,383 | 0.0086 | 0.0926 | 0.0000 | 1.0000 |
Lev | 12,383 | 0.4140 | 0.1930 | 0.0521 | 0.9240 |
ROE | 12,383 | 0.0418 | 0.8090 | -85.6500 | 2.3790 |
Top5 | 12,383 | 0.5280 | 0.1520 | 0.1870 | 0.8920 |
lnBoard | 12,383 | 0.3210 | 0.0392 | 0.1340 | 0.5880 |
Cashflow | 12,383 | 0.0514 | 0.0663 | -0.1610 | 0.2660 |
SOE | 12,383 | 0.2690 | 0.4430 | 0.0000 | 1.0000 |
size | 12,383 | 22.3100 | 1.2840 | 18.3500 | 28.6400 |
big4 | 12,383 | 0.0577 | 0.2330 | 0.0000 | 1.0000 |
tang | 12,383 | 0.3180 | 0.1580 | 0.000956 | 0.8570 |
B/M | 12,383 | 0.5640 | 0.2720 | 0.0343 | 1.9010 |
According to the descriptive statistics in Table 2, the mean score for Employee Satisfaction (ES) is 0.0084 with a standard deviation of 0.0910 out of the 14,495 observations involved, showing a relative concentration of data around the mean, which suggests that the overall employee satisfaction of these companies is low, and that in some companies, the ES score is either 0 or 1, reflecting a clear polarization. The mean value of Corporate Innovation Expenditure (R&D) is 0.0573, with a standard deviation of 0.0596, which shows that the volatility of this indicator is relatively small among the surveyed companies, suggesting that most of the companies have a relatively consistent degree of emphasis on innovation investment. In terms of innovation manpower (Manpower), the logarithmic treatment yields a mean of 0.1720 and a standard deviation of 0.1410, again showing that the data are concentrated towards the mean, reflecting the consistency of these companies in their investment in innovation manpower. Regarding the number of corporate invention patent applications (lnInvention), the logarithmic treatment yields a mean value of 0.8250 with a standard deviation of 1.4730, indicating that there is a large difference in innovation capacity between companies. In particular, the maximum value reaches 8.9660, which implies that a few firms may have very strong innovation capabilities, while most firms perform relatively weakly in this area.
Overall, the surveyed companies demonstrate a certain degree of variability in terms of employee satisfaction, financial resources for innovation, investment in innovative manpower, and innovation capabilities, which provides a basis for subsequent analysis.
5.2. Correlation analysis
Table 3: Correlation analysis table.
R&D | Manpower | lnApply | lnInvention | ES | |
R&D | 1.0000 | ||||
Manpower | 0.6644*** | 1.0000 | |||
lnApply | 0.1784*** | 0.1442*** | 1.0000 | ||
lnInvention | 0.2425*** | 0.1909*** | 0.7161*** | 1.0000 | |
ES | -0.0099 | -0.0037 | 0.0288*** | 0.0036 | 1.0000 |
Based on the analysis of the correlation coefficient matrix provided in Table 3, this paper finds that the correlation between employee satisfaction (ES) and R&D investment (R&D), number of R&D personnel (Manpower) and logarithmic number of invention patents (Invention) is not significant, and only the correlation between employee satisfaction and logarithmic number of patent applications (lnApply) shows a significant positive correlation. The correlation coefficient is 0.0288 and reaches the statistical significance level. This suggests that in firms with higher employee satisfaction, employees may be more motivated to engage in innovative activities, which in turn drives an increase in the number of patent applications. This finding provides a preliminary analytical exploration for subsequent research on how employee satisfaction specifically affects corporate innovation activities, especially patent application behavior.
5.3. Two-way fixed effects model regression analysis
This article utilizes the analysis of benchmark regression results (data for Manpower, Invention, lnApply, and R&D are treated as +1 followed by logarithmic) to explore the proof of the positive relationship between employee satisfaction and corporate innovation. Considering that the regression results of Invention, Manpower, and R&D are not significant, the article only reports the reported results of lnApply.
Table 4: Results of regression analysis.
Variables | Two-way fixed effects model |
ES | 0.2654 |
(1.54) | |
Lev | -0.6913*** |
(-5.04) | |
ROE | 0.0107 |
(0.66) | |
Top5 | 0.4215** |
(2.56) | |
lnBoard | -0.0209 |
(-0.04) | |
Cashflow | -0.0279 |
(-0.11) | |
SOE | 0.2032*** |
(3.28) | |
size | 0.3050*** |
(11.51) | |
big4 | 0.0409 |
(0.39) | |
tang | -0.1651 |
(-1.04) | |
B/M | -0.5216*** |
(-5.19) | |
_cons | -5.3171*** |
(-7.57) | |
N | 12383 |
R2 | 0.1004 |
t statistics in brackets
* p < 0.1, ** p < 0.05, *** p < 0.01
As can be seen from Table 1, under the situation of including all control variables and controlling the time effect and industry effect, the stepwise analysis of the regression results from model (1) to model (7), the coefficient of employee satisfaction (ES) on the number of patent applications (lnApply) of the enterprise is stable between 0.2654 and 0.5072. This result indicates that there is a certain degree of promotional effect of employee satisfaction on the enhancement of enterprise innovation ability. The reason for this is that employees with higher satisfaction are more willing to learn new knowledge and skills in order to improve their capabilities. In the field of innovation, continuous learning is crucial to maintain competitiveness. Employees continue to accumulate knowledge through learning, which provides strong support for innovation activities. Therefore, the hypothesis H1 of this paper is verified.
5.4. Robustness Tests
Given that only the number of patent applications passed the significance test in the benchmark regression analysis, it confirms that employee satisfaction promotes firms' innovative capacity. Therefore, in order to ensure the reliability of this conclusion, this paper uses four ways to justify its illustration.
First, the PSM (Propensity Score Matching) method is used to further validate the promotional effect of employee satisfaction on the innovation capability of enterprises by constructing a propensity score model to match the treatment group (enterprises with high employee satisfaction) with a control group (enterprises with low employee satisfaction) with similar characteristics, in order to effectively control the effects of sample selection bias and potential confounding factors. The results of their PSM matching are shown in the table below.
Table 5: Results of covariate balance analysis between treatment and control groups after PSM1:3 pairing.
Variables | Unmatched | Mean | %reduct | t-test | V(T)/ | |||
Matched | Treated | Control | %bias | |Bias| | t | p>|t| | V(C) | |
Lev | U | 0.5390 | 0.4120 | 67.5000 | 97.4000 | 6.2300 | 0.0000 | 0.6000* |
M | 0.5380 | 0.5250 | 1.8000 | 0.1300 | 0.8990 | 0.5900* | ||
ROE | U | 0.0890 | 0.0410 | 8.1000 | 80.4000 | 0.6000 | 0.5490 | 0.0400* |
M | 0.0870 | 0.0960 | -1.6000 | -0.2500 | 0.8030 | 0.2100* | ||
Top5 | U | 0.5820 | 0.5280 | 33.5000 | 69.6000 | 3.6800 | 0.0000 | 1.2800 |
M | 0.5830 | 0.5990 | -10.2000 | -0.7100 | 0.4800 | 1.0600 | ||
lnBoard | U | 0.3260 | 0.3210 | 12.2000 | 84.9000 | 1.4800 | 0.1390 | 1.7700* |
M | 0.3260 | 0.3270 | -1.8000 | -0.1300 | 0.9000 | 1.3200 | ||
Cashflow | U | 0.0720 | 0.0510 | 34.3000 | 98.8000 | 3.2800 | 0.0010 | 0.7200 |
M | 0.0720 | 0.0730 | -0.4000 | -0.0300 | 0.9780 | 0.5800* | ||
SOE | U | 0.6070 | 0.2660 | 73.2000 | 99.1000 | 7.9600 | 0.0000 | . |
M | 0.6130 | 0.6100 | 0.7000 | 0.0500 | 0.9630 | . | ||
Size | U | 24.8260 | 22.2900 | 185.3000 | 99.3000 | 20.6800 | 0.0000 | 1.3500 |
M | 24.8090 | 24.8260 | -1.2000 | -0.0800 | 0.9380 | 0.7300 | ||
Big4 | U | 0.4770 | 0.0540 | 108.6000 | 99.3000 | 18.9400 | 0.0000 | . |
M | 0.4720 | 0.4750 | -0.8000 | -0.0500 | 0.9640 | . | ||
Tang | U | 0.3130 | 0.3180 | -3.1000 | -119.7000 | -0.3100 | 0.7530 | 0.9100 |
M | 0.3140 | 0.3040 | 6.9000 | 0.5000 | 0.6140 | 0.9500 | ||
B/M | U | 0.6900 | 0.5630 | 42.1000 | 99.7000 | 4.8100 | 0.0000 | 1.4700 |
M | 0.6920 | 0.6930 | -0.1000 | -0.0100 | 0.9940 | 0.9300 | ||
Based on the PSM1:3 matching results, it can be seen that the deviations of the treatment group (i.e., firms with high employee satisfaction) and the control group (i.e., firms with low employee satisfaction) on each covariate have been significantly reduced in the post-matching samples, which suggests that the matching process effectively balances out the differences in the characteristics between the two groups. In addition, by comparing the t-test results before and after matching, it is also evident that the standardized deviations (%bias) of most of the variables are substantially reduced after matching and the p-values of the t-tests are no longer significant, further demonstrating the robustness of the matching.
In addition, the article plots PSM propensity score matches as shown below.
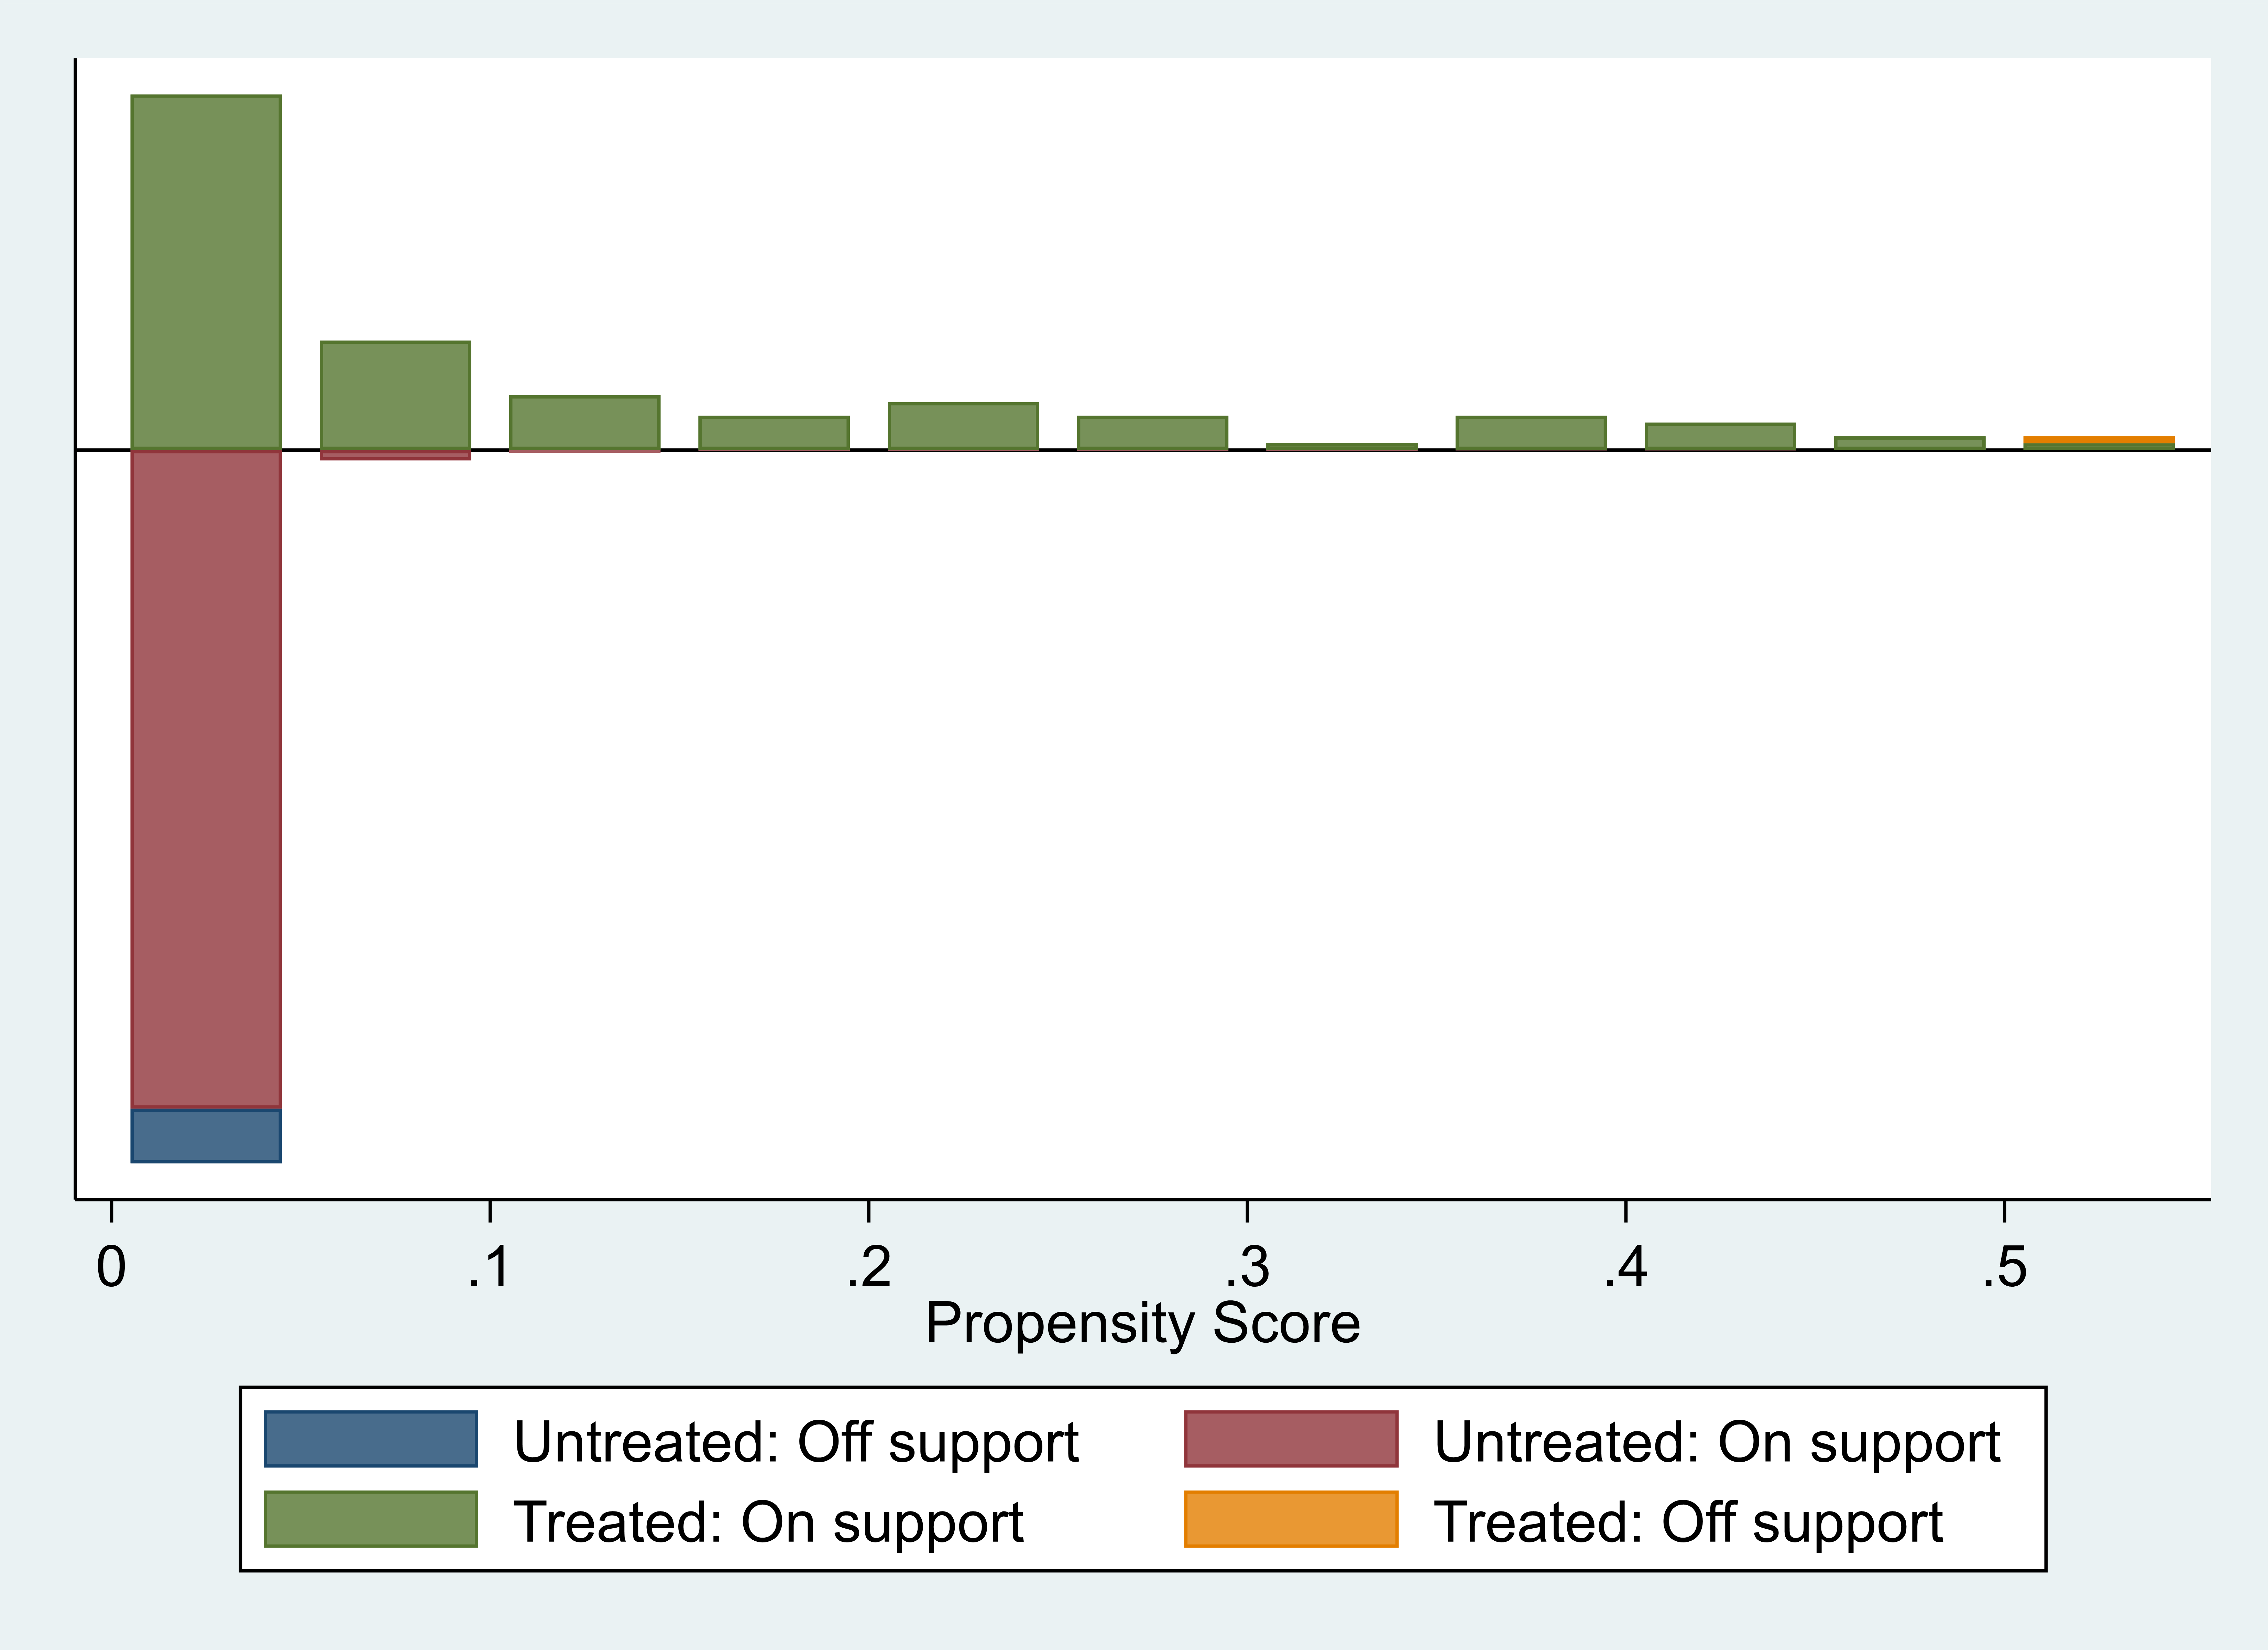
Figure 1: PSM propensity score matching plot.
The figure 1 shows the distribution of propensity scores for the treated and control groups. In the under-identification test for instrumental variables, the Kleibergen-Paap rk LM statistic for instrumental variables is 1837.853, which significantly rejects the original hypothesis of under-identification; moreover, in the weak-identification test, the Kleibergen-Paap rk Wald F statistic for instrumental variables is 2238.649, which is more than the Stock-Yogo 16.38 critical value of the weak identification test at 10% significance level, which rules out the possibility of weak instrumental variables. Therefore, the instrumental variables used in this paper all show good rationality and applicability, and the endogeneity problem caused by bidirectional causality does not significantly interfere with the core findings.
6. Conclusions and recommendations of the study
This study focuses on the impact of employee satisfaction on corporate innovation and draws a number of important conclusions by empirically analyzing the case of China's Employer of the Year.
First, the multidimensional nature of employee satisfaction significantly affects their work attitudes and behaviors. Specifically, factors such as salary satisfaction, work environment and coworker relationships work together to make employees working in a high satisfaction environment more inclined to actively participate in innovative activities. This finding reveals the intrinsic link between employee satisfaction and innovative behavior, and emphasizes the important role of multidimensional satisfaction in stimulating employees' innovative potential.
Secondly, employees with high satisfaction show a stronger willingness to innovate, which in turn translates into a competitive advantage for the enterprise in the market. The study points out that enterprises should pay great attention to the psychological feelings of employees and motivate them to innovate by creating a favorable working atmosphere. This finding provides practical guidance to enterprises that paying attention to employee satisfaction is an important way to enhance the innovation ability of enterprises.
Further, this study emphasizes that companies should focus on long-term effects when improving employee satisfaction. Although short-term incentives can enhance employee satisfaction to a certain extent, a stable high level of satisfaction can only bring sustained innovation drive and stronger market adaptability to the enterprise. This finding provides an important reference for companies to formulate employee satisfaction improvement strategies.
In summary, this study not only deepens our understanding of the relationship between employee satisfaction and corporate innovation, but also provides useful suggestions for corporate practice. In the future, enterprises should continue to explore and optimize employee satisfaction enhancement strategies in order to further stimulate the innovation potential of employees and promote the sustainable development and competitiveness of enterprises.
Acknowledgements
These authors contributed equally to this work.
References
[1]. Yu HB,Li YR,Zheng XM. An empirical study of employee salary satisfaction and its impact(J). Economic Management,2009,31(09):93-99.
[2]. Liu Hong. On the relationship between employee satisfaction and job performance(J). Contemporary Economy,2010,(22):164-165.
[3]. Wang Li. Employees' sense of responsibility, job satisfaction and organizational citizenship behavior(J). Business Economics and Management,2010,(12):32-37.DOI:10.14134/j.cnki.cn33-1336/f.2010.12.009.
[4]. Harter, J. K., Schmidt, F. L., & Hayes, T. L. (2002). Business-unit-level relationship between employee satisfaction, employee engagement, and business outcomes: a meta-analysis. journal of Applied Psychology, 87(2), 268-279.
[5]. Bai Yu. Analysis of the relationship between employee satisfaction and corporate effectiveness(J). Contemporary Economy,2013,(21):12-14.
[6]. Ayşegül Özsomer, R. Calantone et al. "What makes firms more innovative? A look at organizational and environmental factors. " (1997). 400-416.
[7]. Zhang Yuchen,Lu Xianpeng. Research on factors influencing innovation performance of high-tech enterprises(J). Research Management,2013,34(12):58-65.
[8]. Lu Xianxiang,Li Lei. Corporate innovation influencing factors and its role mechanism: a review and outlook(J). Economist,2021,(07):55-62.
[9]. Lv Hongfen,Yu Xiangping. Influencing Factors and Improvement Countermeasures of Corporate Innovativeness(J). Enterprise Economy,2007,No.321(05):38-40.
[10]. Lu Jinfang. Internal and external influencing factors originating from enterprises' independent innovation(J). Seeking,2006(02):79-81.
[11]. T. Heimonen. "What are the factors that affect innovation in growing SMEs." (2012). 122-144.
[12]. F. Crespi. "Notes on the Determinants of Innovation: A Multi-Perspective Analysis." (2004).
[13]. Kahn, W. A. (1990). Psychological conditions of personal engagement and disengagement at work. Academy of Management Journal, 33(4), 692-724.
[14]. Liu, J. & Lin, S. Employee satisfaction and corporate technological innovation. Industrial Technology Economics,2020,39(09), 20-29.
[15]. Zhou, X., Cheng, L. & Wang, H. (2012). Does higher technological innovation lead to better financial performance for enterprises? An empirical study based on patent application data of Chinese pharmaceutical listed companies in 2016. Financial Research, (8), 166-179.
[16]. Guan Kaolai,Zhu Haining,Liu Yang. Can online platform interaction mitigate asset mispricing-empirical evidence from exchange interaction platforms(J). Accounting Research,2023,(08):33-45.
Cite this article
Mei,Y.;Gao,R.;Huang,S. (2025). Employee Satisfaction and Corporate Innovation---An Empirical Study Based on "China's Best Employer of the Year". Advances in Economics, Management and Political Sciences,171,13-23.
Data availability
The datasets used and/or analyzed during the current study will be available from the authors upon reasonable request.
Disclaimer/Publisher's Note
The statements, opinions and data contained in all publications are solely those of the individual author(s) and contributor(s) and not of EWA Publishing and/or the editor(s). EWA Publishing and/or the editor(s) disclaim responsibility for any injury to people or property resulting from any ideas, methods, instructions or products referred to in the content.
About volume
Volume title: Proceedings of the 3rd International Conference on Management Research and Economic Development
© 2024 by the author(s). Licensee EWA Publishing, Oxford, UK. This article is an open access article distributed under the terms and
conditions of the Creative Commons Attribution (CC BY) license. Authors who
publish this series agree to the following terms:
1. Authors retain copyright and grant the series right of first publication with the work simultaneously licensed under a Creative Commons
Attribution License that allows others to share the work with an acknowledgment of the work's authorship and initial publication in this
series.
2. Authors are able to enter into separate, additional contractual arrangements for the non-exclusive distribution of the series's published
version of the work (e.g., post it to an institutional repository or publish it in a book), with an acknowledgment of its initial
publication in this series.
3. Authors are permitted and encouraged to post their work online (e.g., in institutional repositories or on their website) prior to and
during the submission process, as it can lead to productive exchanges, as well as earlier and greater citation of published work (See
Open access policy for details).
References
[1]. Yu HB,Li YR,Zheng XM. An empirical study of employee salary satisfaction and its impact(J). Economic Management,2009,31(09):93-99.
[2]. Liu Hong. On the relationship between employee satisfaction and job performance(J). Contemporary Economy,2010,(22):164-165.
[3]. Wang Li. Employees' sense of responsibility, job satisfaction and organizational citizenship behavior(J). Business Economics and Management,2010,(12):32-37.DOI:10.14134/j.cnki.cn33-1336/f.2010.12.009.
[4]. Harter, J. K., Schmidt, F. L., & Hayes, T. L. (2002). Business-unit-level relationship between employee satisfaction, employee engagement, and business outcomes: a meta-analysis. journal of Applied Psychology, 87(2), 268-279.
[5]. Bai Yu. Analysis of the relationship between employee satisfaction and corporate effectiveness(J). Contemporary Economy,2013,(21):12-14.
[6]. Ayşegül Özsomer, R. Calantone et al. "What makes firms more innovative? A look at organizational and environmental factors. " (1997). 400-416.
[7]. Zhang Yuchen,Lu Xianpeng. Research on factors influencing innovation performance of high-tech enterprises(J). Research Management,2013,34(12):58-65.
[8]. Lu Xianxiang,Li Lei. Corporate innovation influencing factors and its role mechanism: a review and outlook(J). Economist,2021,(07):55-62.
[9]. Lv Hongfen,Yu Xiangping. Influencing Factors and Improvement Countermeasures of Corporate Innovativeness(J). Enterprise Economy,2007,No.321(05):38-40.
[10]. Lu Jinfang. Internal and external influencing factors originating from enterprises' independent innovation(J). Seeking,2006(02):79-81.
[11]. T. Heimonen. "What are the factors that affect innovation in growing SMEs." (2012). 122-144.
[12]. F. Crespi. "Notes on the Determinants of Innovation: A Multi-Perspective Analysis." (2004).
[13]. Kahn, W. A. (1990). Psychological conditions of personal engagement and disengagement at work. Academy of Management Journal, 33(4), 692-724.
[14]. Liu, J. & Lin, S. Employee satisfaction and corporate technological innovation. Industrial Technology Economics,2020,39(09), 20-29.
[15]. Zhou, X., Cheng, L. & Wang, H. (2012). Does higher technological innovation lead to better financial performance for enterprises? An empirical study based on patent application data of Chinese pharmaceutical listed companies in 2016. Financial Research, (8), 166-179.
[16]. Guan Kaolai,Zhu Haining,Liu Yang. Can online platform interaction mitigate asset mispricing-empirical evidence from exchange interaction platforms(J). Accounting Research,2023,(08):33-45.