1. Introduction
The food industry, an integral part of the global economy, has always attracted widespread investor interest. The food industry provides essential consumer goods and is characterized by a large market size and relatively stable demand, and research by Morelli suggests that the food industry is characterized by relatively stable cash flows and sustained basic demand compared to other industries [1]. Other studies have found that the share prices of essential consumer goods, such as food, fall relatively little during economic downturns, e.g., Han et al. found that stocks in the food sector fell less than the broader market during the 2008 financial crisis [2]. These characteristics have attracted a certain amount of value and growth investors. Its strong cyclicality makes it a good choice for constructing value portfolios with stable returns.
Compared to investing in individual stocks, optimizing a portfolio can effectively reduce unsystematic risk and achieve the best match between the overall risk and return of the portfolio [3]. To rationally allocate food industry stocks, accurately predicting individual stock price trends becomes very important. LSTM has strong capabilities in time series modeling and has shown great potential in stock price forecasting. For instance, Nelson et al. built stock price forecasting models based on LSTM networks that outperformed traditional ARIMA models on high-dimensional stock data [4].
This paper plans to apply the LSTM methodology, using historical data of listed food and beverage companies as the basis to establish stock price forecasting models, predict future price trends of individual stocks, and provide support for optimized portfolio allocation. The experiment will collect 10 years of historical stock price sequences of companies like Nestle, Pepsi and Coca-Cola, use LSTM networks for multi-step forecasting, evaluate different model parameter settings, and analyze the accuracy of prediction results. The ultimate goal is to construct stock price expectations, optimize food and beverage stock investment portfolios, and achieve low-risk asset allocation.
2. Methodologies
2.1. Data collection
This paper selected 5 stocks to construct the portfolio: AB InBev, Heinz, Nestle, Pepsi, and Coca-Cola, which are companies that have the top market value. The data I used is the stock trend from August 14, 2013 to August 14, 2023, a time span of 10 years. In total, there are 2673 pieces of information. The source of data is accessed from Yahoo Finance by a python package “yfinance”. The data set from “yfinance” package is already clean, the processing of data is limited to putting several sets of data together to form a dataframe. Usually, stock price data set includes the following features: Open, Volume, High, Low, Closing price, Adjusted closing price. However, only the Adjusted closing price will be used in the dataset, since the adjusted closing price takes into account factors such as stock dividends and splits. Since corporate events like dividends and stock splits can impact stock prices, the adjusted closing price offers a better depiction of the stock's real performance. Also, with the help of minmaxscaler, the data is normalized in a range between 0 and 1. This not only accelerates the method, but also increases its accuracy [5]. Standard deviation will also be included in the method. Since one goal of portfolio construction is to achieve a balance between return and risk, the standard deviation provides a measure of the volatility of each asset in the portfolio, helping investors control overall risk while pursuing higher returns. By combining assets with different standard deviations, you can find the optimal balance of return and risk.
2.2. Selections of features
Monte Carlo simulation is being used, which estimates the expected performance of a portfolio by stochastically simulating possible future market scenarios, as well as changes in the prices and performance of investment assets. Such simulations can help investors better understand the various scenarios that their investment strategies may face and the trade-offs between risk and return [6].
2.3. LSTM models
Long Short-Term Memory (LSTM) is a type of recurrent neural network that is appropriate for digesting and forecasting significant events in a time series with relatively large intervals and delays [7]. The gradient disappearance issue in the RNN structure is addressed using LSTM. The overview of the structure of LSTM is shown in Fig.1.
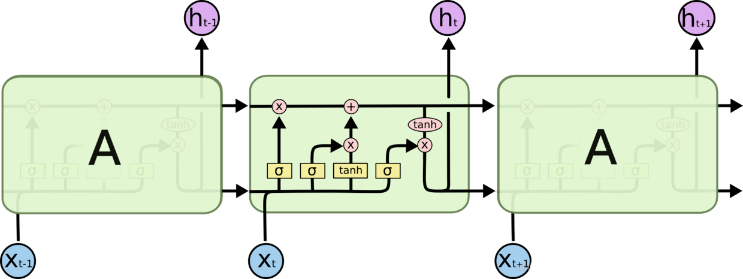
Figure 1: Overview of LSTM
The forget gate's role is to decide how much information to discard from the cell state Ct. It uses the Sigmoid activation function, taking the current input xt and the previous hidden state ht-1 as inputs, and outputs a value between 0 and 1. This output is denoted as ft, representing the amount of information to forget.
\( {f_{t}}= σ({W_{\lbrace xf\rbrace }}\cdot {x_{t}}+ {W_{\lbrace hf\rbrace }}\cdot {h_{\lbrace t-1\rbrace }}+ {b_{f}}) \) (1)

Figure 2: Forget Gate
The input gate's job is to decide which new data should be included in the cell state Ct. With the current input xt and the prior hidden state ht-1 as inputs, it uses Sigmoid activation and gives back a value from 0 to 1. How much fresh information should be retained is indicated by the output it.
\( {i_{t}}= σ({W_{\lbrace xi\rbrace }}\cdot {x_{t}}+ {W_{\lbrace hi\rbrace }}\cdot {h_{\lbrace t-1\rbrace }}+ {b_{i}}) \) (2)

Figure 3: Input Gate
The cell state, which is utilized to store and spread long-term information, is an essential part of the LSTM. It is calculated by taking the input gate, forget gate, and the prior cell state Ct-1 into account.
\( {C_{t}}= {f_{t}}\cdot {C_{t-1}}+ {i_{t}}\cdot tanh({W_{xc}}\cdot {x_{t}}+ {W_{hc}}\cdot {h_{t-1}}+ {b_{c}}) \) (3)

Figure 4: Cell State
The output gate chooses which data from the cell state will be output as the hidden state ht. ot indicates how much data from the cell state should be output. The hyperbolic tangent activation function is simultaneously used to process the candidate cell state values.
\( {o_{t}}= σ({W_{\lbrace xo\rbrace }}\cdot {x_{t}}+ {W_{\lbrace ho\rbrace }}\cdot {h_{\lbrace t-1\rbrace }}+ {b_{o}}) \) (4)
\( {h_{t}}= {o_{t}}\cdot tanh({C_{t}}) \) (5)

Figure 5: Output Gate
2.4. Evaluation indicators
In order to concretize the credibility of this approach, Mean Absolute Error (MAE) and Root Mean Squared Error (RMSE) is decided to be utilized here.
\( MAE=\frac{1}{n}\sum _{i=1}^{n}|{y_{i}}-\hat{{y_{i}}}| \) (6)
Where n is the quantity of observations; yi is Actual values (observed data); ŷi is the Predicted values.
\( RMSE=\sqrt[]{\frac{1}{n}\sum _{i=1}^{n}{({y_{i}}-\hat{{y_{i}}})^{2}}} \) (7)
Where n is the quantity of observations; yi is Actual values (observed data); ŷi is the Predicted values.
3. Results and discussion
3.1. Portfolio construction
In the initial portfolio allocation, the proportion of weights of stocks are: NESN.SW 15%; PEP 10%; KO 20%; BUD 15%; KHC 40%. This paper reduced the weights of NESN.SW and PEP because these companies seem to have higher volatility than other stocks. KHC’s weight is the largest, since it has the second lowest standard deviation, and its mean is larger than KO. This allocation was aimed at reducing risk to a certain extent.
Table 1: Descriptive Statistics of Stock Prices
Stock | Statistics | ||||
Mean | Std Dev | Max | Min | Median | |
BUD | 80.10 | 19.42 | 114.54 | 33.78 | 82.23 |
KHC | 43.24 | 14.41 | 72.88 | 17.44 | 38.60 |
KO | 42.15 | 10.37 | 63.82 | 27.21 | 39.09 |
NESN.SW | 79.76 | 22.31 | 123.38 | 45.78 | 71.77 |
PEP | 110.28 | 35.75 | 194.76 | 58.68 | 98.64 |
Based on the calculation of daily return and covariance, an annual return of 7% and volatility of 17% is obtained for this portfolio. To explore more possibilities, this paper carried out a Monte Carlo simulation with 25,000 iterations and obtained a scatter plot. Based on Fig.6, the portfolio with the highest Sharpe ratio had an annual return of 10.04% and volatility of 15.33%, which is the red star in Fig.6. The weights for the five companies in this portfolio were as follows: NESN.SW: 41.15%, PEP: 41.62%, KO: 15.60%; BUD 0.961%; KHC 0.668%. However, the portfolio with the lowest standard deviation also had a good annual return of 8.575% and volatility of 14.42%, which is the yellow star in Fig.6. In this portfolio, NESN.SW made up approximately 58.47%, KO: 17.30%, but PEP dropped to only 18.92%. BUD and KHC increased to 1.921% and 3.389%. The change in the weight of these stocks in the portfolio is presented in the Fig.7. These data proved that Pepsi has a high volatility, but the reason why Nestle increases is still unclear. Also, this paper has to consider whether it is necessary to add AB InBev and Heinz to the portfolio, since they make up such a small portion of the portfolio. The adjustment of their proportions in the portfolio based on performance is decided.
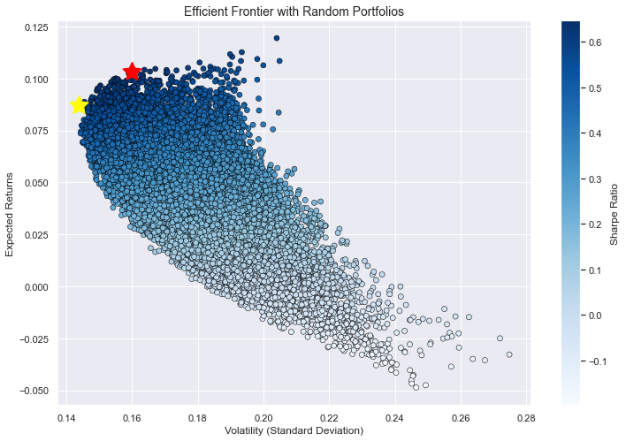
Figure 6: Portfolios with Monte Carlo simulation
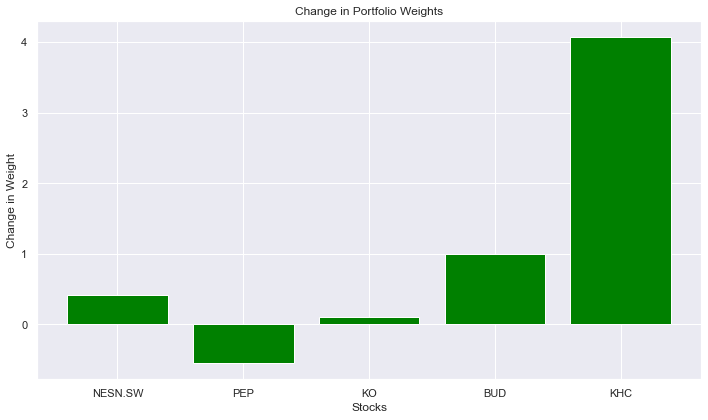
Figure 7: Change in Portfolio weights
The removal of AB InBev and Heinz from the portfolio is being carried out and reran the Monte Carlo simulation. The resulting highest Sharpe ratio portfolio had an annual return of 10.19% and a volatility of 15.17%, which is the red star in Fig.8. The volatility is lower and the annual return is higher. This means we would have a higher return together with a lower risk, showing that it is better to remove BUD and KHC from the portfolio. The portfolio with the lowest standard deviation, which is the yellow star in Fig.8, had an annual return of 9.177% and a volatility of 14.40%, similar to the result of the highest Sharpe ratio portfolio. Therefore, the decision is made to remove AB InBev and Heinz from the portfolio.
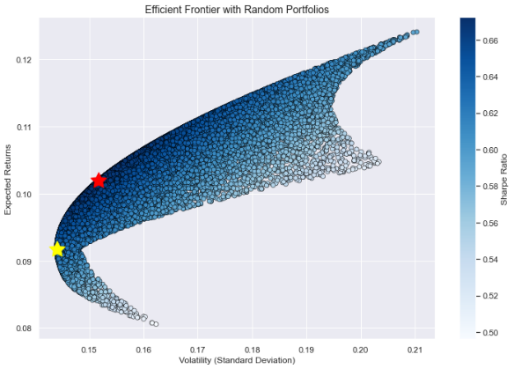
Figure 8: Portfolios without AB InBev and Heinz
Since Nestle have high risk and return, this paper considered forecasting its general trend to decide whether to increase its proportion in the portfolio. This paper used an LSTM model for this purpose.
3.2. Model performance analysis
This paper imported Nestle's daily closing prices over the past ten years for training and built a prediction model using a Python script. The Adaptive Moment Estimation is being used as the optimization parameter, since it’s the most effective one theoretically [8], and Mean Squared Error as the loss function. This paper also added a dense layer to enhance the nonlinear analysis capability of the LSTM model.
This paper took 61 days of data as a validation set and then predicted Nestle's stock price for the next 15 days. For the training set x, each row represents the data from day 61 to the last day with 60 columns each day, and each column represents i days back from that day. For the training set y, each row represents the closing price of the day with only one column. The predictions and the actual adjusted close prices are obtained, as shown in Fig.9 and Fig.10. The difference between Actual price and predicted price are quite small. The MAE is equal to 1.09, and RMSE is equal to 0.89. Both metrics used to assess the performance of the predictive model show very low values, indicating that the model is plausible [9].
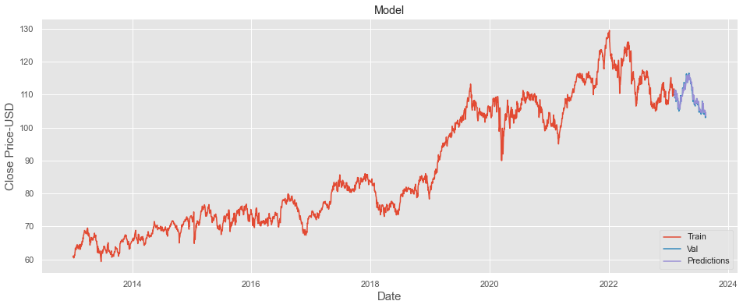
Figure 9: The overview of the prediction of price
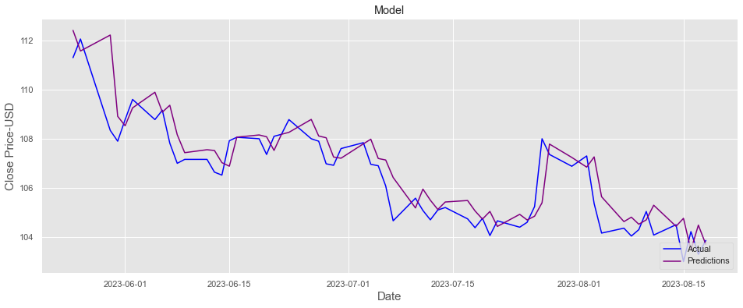
Figure 10: The close-look of the prediction of price
The training and validation sets fit well, and the 30-day forecast results is obtained, as shown in Fig.11. The results show the possibility of upward price appreciation for Nestle's stock price, which means we need to increase its proportion in the portfolio. This explains the increase of the weight of Nestle stock despite its high volatility when constructing a portfolio with the lowest standard deviation.
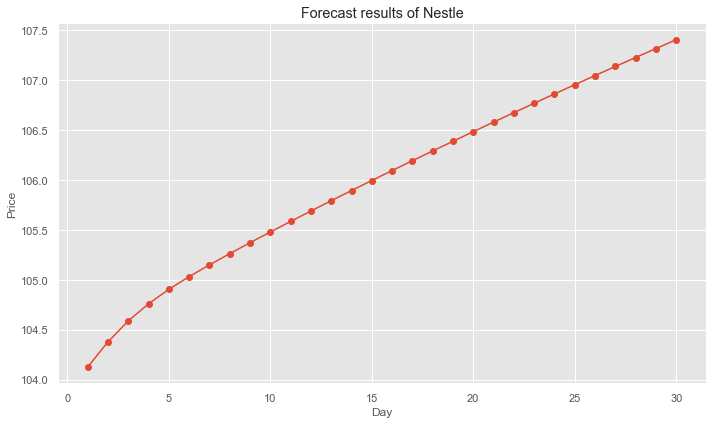
Figure 11: Forecast results of Nestle’s price
3.3. Drawbacks and potential improvements
However, according to the observation of Nestle's stock price, the possibility of such a small fluctuation within 30 trading days is quite low. Therefore, this model may not be accurate enough. Some limitations of LSTM may cause this inaccuracy: for the LSTM model to create an accurate model, a lot of historical data is required. Also, other factors, like real-world policies may affect the price that may not be caught by data [10].
One way to improve this is to add error rectification method, such as including the past 3 days' average difference of stock price and use them to correct the result [11]. Discover technical indicators and external factors, such as emotional factors, that strongly affect the data used for forecasting to improve the accuracy of prediction.
4. Conclusion
This paper explores predictive modeling of food and beverage stocks using LSTM. For data, this paper collected 10 years of historical daily closing prices of 5 stocks including Nestle, Pepsi and Coca-Cola as training data. For methodology, this paper built a recurrent neural network model with LSTM and fully connected layers, using MSE as the loss function and Adam as the optimizer. The research process first evaluated weight allocation of different stocks in the portfolio via Monte Carlo simulation, then selected Nestle, a relatively high-risk stock, for individual stock price prediction. The results showed a slight upward trend for Nestle’s stock price, thus advising moderately increasing its portfolio allocation. However, prediction errors remained, inconsistent with actual volatility. The major conclusion is that while LSTM models can reasonably fit historical price time series and provide general judgments on future trends, prediction accuracy still has room for improvement, likely due to the incomplete consideration of influencing factors and short of data. Future research could enhance predictive accuracy by collecting more data and enriching model features, or introduce attention mechanisms to focus on more key factors. This preliminary study offers basic analysis of predictive modeling for food and beverage stocks, but further optimization of model design, expanded sample size and feature scope is needed to obtain more reliable risk control and investment decision support.
References
[1]. C. Morelli, “Improving the measurement of food markets in the US national accounts,” BEA Briefing: Improving BEA’s Accounts Through Research, vol. 3, 2011.
[2]. J. Han, M. A. Khan, and Z. Zhuang, “Risk, return and investor sentiment: A study of consumer staples stocks,” The Quarterly Review of Economics and Finance, vol. 57, pp. 215-226, 2015.
[3]. H. Markowitz, “Portfolio selection,” The Journal of Finance, vol. 7, no. 1, pp. 77-91, 1952.
[4]. D. M. Q. Nelson, A. C. M. Pereira, and R. A. Oliveira, “Stock market's price movement prediction with LSTM neural networks,” in 2017 International Joint Conference on Neural Networks (IJCNN), 2017, pp. 1419-1426.
[5]. X. Zhou, “Stock price prediction using combined LSTM-CNN model,” in 2021 3rd International Conference on Machine Learning, Big Data and Business Intelligence (MLBDBI), 2021, doi: 10.1109/MLBDBI54094.2021.00020.
[6]. T. Chang, N. Meade, J. E. Beasley, and Y. M. Sharaiha, “Heuristics for cardinality constrained portfolio optimisation,” Computers & Operations Research, vol. 27, no. 13, pp. 1271-1302, 2000.
[7]. S. Hochreiter and J. Schmidhuber, "Long short-term memory," Neural Computation, vol. 9, no. 8, pp. 1735-1780, 1997.
[8]. R. Piper, "An overview of gradient descent optimization algorithms," arXiv preprint arXiv:1609.04747, 2016.
[9]. R. J. Hyndman and A. B. Koehler, "Another look at measures of forecast accuracy," International Journal of Forecasting, vol. 22, no. 4, pp. 679-688, 2006.
[10]. Guo, M., Kuai, Y., & Liu, X. (2020). Stock market response to environmental policies: Evidence from heavily polluting firms in China. Economic Modelling, 86,306-316.
[11]. J. Li, Z. Li, and W. Lei, “The LSTM model with error rectification in stock price prediction,” in 2021 3rd International Conference on Machine Learning, Big Data and Business Intelligence (MLBDBI), 2021, doi: 10.1109/MLBDBI54094.2021.00035.
Cite this article
Weng,M. (2025). LSTM-based Portfolio Optimization Study in the Food and Beverage Industry. Advances in Economics, Management and Political Sciences,172,131-138.
Data availability
The datasets used and/or analyzed during the current study will be available from the authors upon reasonable request.
Disclaimer/Publisher's Note
The statements, opinions and data contained in all publications are solely those of the individual author(s) and contributor(s) and not of EWA Publishing and/or the editor(s). EWA Publishing and/or the editor(s) disclaim responsibility for any injury to people or property resulting from any ideas, methods, instructions or products referred to in the content.
About volume
Volume title: Proceedings of the 4th International Conference on Business and Policy Studies
© 2024 by the author(s). Licensee EWA Publishing, Oxford, UK. This article is an open access article distributed under the terms and
conditions of the Creative Commons Attribution (CC BY) license. Authors who
publish this series agree to the following terms:
1. Authors retain copyright and grant the series right of first publication with the work simultaneously licensed under a Creative Commons
Attribution License that allows others to share the work with an acknowledgment of the work's authorship and initial publication in this
series.
2. Authors are able to enter into separate, additional contractual arrangements for the non-exclusive distribution of the series's published
version of the work (e.g., post it to an institutional repository or publish it in a book), with an acknowledgment of its initial
publication in this series.
3. Authors are permitted and encouraged to post their work online (e.g., in institutional repositories or on their website) prior to and
during the submission process, as it can lead to productive exchanges, as well as earlier and greater citation of published work (See
Open access policy for details).
References
[1]. C. Morelli, “Improving the measurement of food markets in the US national accounts,” BEA Briefing: Improving BEA’s Accounts Through Research, vol. 3, 2011.
[2]. J. Han, M. A. Khan, and Z. Zhuang, “Risk, return and investor sentiment: A study of consumer staples stocks,” The Quarterly Review of Economics and Finance, vol. 57, pp. 215-226, 2015.
[3]. H. Markowitz, “Portfolio selection,” The Journal of Finance, vol. 7, no. 1, pp. 77-91, 1952.
[4]. D. M. Q. Nelson, A. C. M. Pereira, and R. A. Oliveira, “Stock market's price movement prediction with LSTM neural networks,” in 2017 International Joint Conference on Neural Networks (IJCNN), 2017, pp. 1419-1426.
[5]. X. Zhou, “Stock price prediction using combined LSTM-CNN model,” in 2021 3rd International Conference on Machine Learning, Big Data and Business Intelligence (MLBDBI), 2021, doi: 10.1109/MLBDBI54094.2021.00020.
[6]. T. Chang, N. Meade, J. E. Beasley, and Y. M. Sharaiha, “Heuristics for cardinality constrained portfolio optimisation,” Computers & Operations Research, vol. 27, no. 13, pp. 1271-1302, 2000.
[7]. S. Hochreiter and J. Schmidhuber, "Long short-term memory," Neural Computation, vol. 9, no. 8, pp. 1735-1780, 1997.
[8]. R. Piper, "An overview of gradient descent optimization algorithms," arXiv preprint arXiv:1609.04747, 2016.
[9]. R. J. Hyndman and A. B. Koehler, "Another look at measures of forecast accuracy," International Journal of Forecasting, vol. 22, no. 4, pp. 679-688, 2006.
[10]. Guo, M., Kuai, Y., & Liu, X. (2020). Stock market response to environmental policies: Evidence from heavily polluting firms in China. Economic Modelling, 86,306-316.
[11]. J. Li, Z. Li, and W. Lei, “The LSTM model with error rectification in stock price prediction,” in 2021 3rd International Conference on Machine Learning, Big Data and Business Intelligence (MLBDBI), 2021, doi: 10.1109/MLBDBI54094.2021.00035.


