


1. Introduction
1.1. Background
In 1971, Bed Bath & Beyond opened its first store in New Jersey, USA. Initially named Bed 'n Bath, it specialized in selling bed linens and bath products. In 1987, Bed 'n Bath was officially renamed Bed Bath & Beyond and expanded to 17 chain stores, mainly concentrated in the New York area and throughout California. In 1991, the company's sales reached $134 million. In 1992 the company went public on the NASDAQ stock exchange under the ticker symbol BBBY, leveraging capital markets to accelerate expansion. BBBY Acquired Christmas Tree Shops (focused on seasonal decorations and home goods) in 2003.Then in 2007 acquired Buybuy BABY (focused on baby and children's products), further expanding its business scope. Late 2000s, Bed Bath & Beyond became a leader in the U.S. home retail market, with over 1,000 stores. The company reached its peak market capitalization, exceeding $17 billion in 2012.In 2014 BBBY faced intense competition from e-commerce (e.g., Amazon) and discount retailers (e.g., TJ Maxx), leading to slowing sales growth. In 2017 the company launched a transformation plan, including closing underperforming stores, optimizing inventory management, and strengthening its online business. The COVID-19 pandemic significantly impacted sales, prompting the company to accelerate the closure of some stores and cut costs in2020.The company faced severe financial difficulties, with its stock price plummeting, and considered selling parts of its assets or filing for bankruptcy protection in 2022.On April 23, Bed Bath & Beyond filed for Chapter 11 bankruptcy protection, planning to gradually close all stores and liquidate assets in 2023.
1.2. Features
This part concluded 6 features of Bed Bath & Beyond as following:
(1) Large scale — Unlike traditional department stores, which typically allocated around 20,000 square feet to home furnishings, Bed Bath & Beyond operated on a much larger scale. Its stores averaged over 33,000 square feet in size, with some locations even surpassing 80,000 square feet, offering customers a significantly more expansive selection of home goods and a spacious shopping experience.
(2) One-step shopping — By featuring a wide spectrum of household items, including bedding to bath products to seasonal and holiday items, Bed Bath & Beyond carried a more extensive variety of products to provide greater convenience for its customers.
(3) Low Price Policy —Bed Bath & Beyond has always been committed to offering its customers a competitive pricing strategy. By maintaining an everyday lower price policy, the company ensures that its products are priced at levels that are either equal to or lower than the sale prices commonly seen in traditional department stores. This approach not only makes shopping more affordable for consumers but also positions Bed Bath & Beyond as a value-driven retailer in the market.
(4) Cross Selling — Every Bed Bath & Beyond store included a "racetrack" pathway that circled the entire store. This layout was designed to lead customers through different product sections and promote exploration. Rather than investing heavily in fancy store displays, the company focused on its merchandise, presenting products in a practical yet eye-catching manner—stacked from floor to ceiling. This approach maximized space utilization and emphasized the extensive variety of items available.
(5) Good Customer Experience — Employees were always close by and ready to offer help to customers.
(6) Decentralized Store Control —As corporate management was committed to supporting the stores, store managers were granted significant autonomy in choosing merchandise and overseeing its display. This approach not only helped to minimize stockouts but also empowered local managers to stock products that specifically met the needs of their local markets.
1.3. Competitors
It can be seen form Table 1 that the data of EBIT margins, Net margins and Return on common equity for Bed Bath & Beyond are higher than the data of Williams Sonoma and Linens 'n Things, which means Bed Bath & Beyond is Better Profitability.
Table 1: Comparables data for Bed Bath & Beyond ($ in thousands except per share and ratio data)
Bed Bath & Beyond | Williams Sonoma | Linens 'n Things | |
Sales ($) | 4,477,981 | 2,754,368 | 2,395,272 |
EBIT ($) | 639,343 | 254,787 | 121,953 |
EBIT margins | 14.3% | 9.3% | 5.1% |
Net income ($) | 399,470 | 157,211 | 74,825 |
Net margins | 8.9% | 5.7% | 3.1% |
ROE | 20.1% | 19.5% | 9.8% |
1.4. Purpose of this paper
As debt increases, the likelihood of a firm going bankrupt also rises, thereby incurring additional costs. Therefore, firms need to strike a balance between the tax advantages of debt and the costs of bankruptcy to determine their optimal capital structure [1]. Profitability refers to a company's capacity to generate profit. It is the outcome of all financial planning and decision-making processes. Common metrics used to assess profitability include the profit-to-sales ratio, return on assets, and return on equity. For investors, it is crucial that investors be aware of ratios of capital structure such as: ratio of debt total asset, the equity ratio to total asset, a debt ratio to the equity and equity rate to debt [2]. In conclusion, capital structure has a significant influence of a company.
The purpose of this study is to investigate the precise influence of Bed Bath & Beyond's capital structure on its financial outcomes, included its financial data for the period of 1992 to 2004. This article aims to analysis the reason of its financial success and discover more effective asset management strategies. In terms of theory, this research enriches the understanding of how capital structure impacts corporate financial performance and offers new insights for scholars working on related topics. In practice, it serves as a valuable reference for Bed Bath & Beyond’s management team, aiding them in making informed decisions to optimize their capital structure and emerge from bankruptcy. Moreover, it provides useful guidance on capital structure management for other companies, particularly those in the same retail sector.
2. Analysis of Bed Bath & Beyond’s financial success
2.1. The financially successful has Bed Bath & Beyond been
2.1.1. The Net sales
Figure 1 shows that the curve of Net sales slopes upward, which means that from 1991 to 2003, Bed Bath & Beyond experienced a significant upward trend in Net earnings. Despite the overall upward trend, there were some fluctuations. For instance, net earnings dipped in certain years like 1997 and 2000 but quickly rebounded and continued to grow.
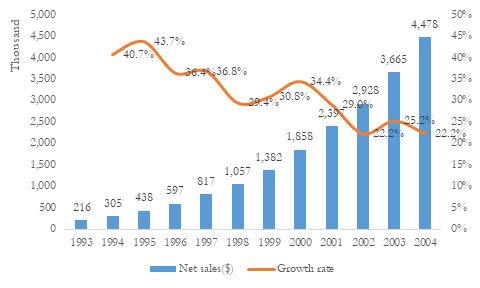
Figure 1: Net sales and its growth rate of BBBY from 1991 to 2003 ($ in thousand)
Data source: Company’s 2002 Annual sReport and fiscal Year Ending Earning Release
From this table of growth rate of net sales, we can predict that the growth rate of net sales for Bed Bath & Beyond has a trend of closing to 20%.
2.1.2. Net Earning
Figure 2 shows that the curve of Net Earning also slopes upward, which means that from 1993 to 2004, the company's net earnings showed significant growth.
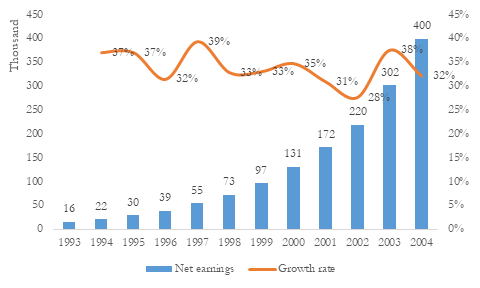
Figure 2: Net Earnings and its growth rate of BBBY from 1991 to 2003 ($ in thousand)
Data source: Company’s 2002 Annual Report and fiscal Year Ending Earning Release
From this table of growth rate of net Earning, we can know that the growth rate of net earnings fluctuated over the years but generally is stable.
2.1.3. Return on common equity
From Table 2 sof Return on common equity, the data of Bed Bath& Beyond is higher than most of its competitors.
Table 2: Comparable data for Bed Bath& Beyond
Bed Bath & Beyond | Williams Sonoma | Linens 'n Things | Target | Kohl’s | JC Penney | Best Buy | |
Return on common equity | 20.10% | 19.50% | 9.80% | 16.60% | 14.10% | –17.1% | 23.40% |
3. The reasons for its financial success
3.1. High margin
Store managers, who are intimately familiar with the local market conditions and consumer preferences, possess the keen ability to identify the most lucrative areas for markups. By leveraging their experience of what products are in high demand and what price points are most acceptable to local customers, they can strategically increase the prices of certain items without deterring buyers. This, in turn, allows them to drive significant volume on those items, maximizing the store's profitability while maintaining a strong competitive edge in the local retail environment. However, Target's employees are typically distributed across various areas of the store, but compared to BBBY, Target's employee density may be lower. Target relies more on clear signage and self-service equipment (such as self-checkout machines) to reduce the need for manual assistance. Walmart places greater emphasis on operational efficiency and low prices, while investing less in personalized services [3]. The primary responsibility of employees is to ensure smooth store operations, rather than providing in-depth consultation.
Bed Bath & Beyond also offered its own private-label products. These items were designed to deliver high quality at more affordable prices for customers, while also generating higher profit margins for the company. For example, BBBY Private Label Bee & Willow or Simply Essential, the price of its sheet sets is30−50 (depending on material and size), and it is High-thread-count pure cotton or blended fabrics, offering comfort comparable to premium brands. However, the price of Target's Threshold brand or Walmart's Mainstays brand is 25−45. Although the prices are similar, BBBY's private-label sheets often provide higher thread counts or finer craftsmanship, offering better value for money
Finally, Bed Bath & Beyond refrained from running traditional sales promotions, and utilized markdowns predominantly to liquidate the inventory of items that were no longer being produced or carried in the store.
3.2. Good customer experience
The presence of readily available and helpful staff members contributed to the higher productivity of Bed Bath & Beyond stores, as evidenced by their superior sales per square foot compared to competitors. Even if we think about per employee, the good service they provided would satisfy customer so that they can buy more goods and make more profit to the stores. So, it is also effective work for each employee, so it is high Store Productivity.
3.3. Decentralized store control
The store managers were granted significant autonomy in choosing merchandise and overseeing its display. Local staff monitored inventory levels and could reorder up to 75 percent of the products. This allowed them to minimize stockouts. Besides, by allowing local managers to choose and reorder merchandise based on local demand, the store can stock items that are more relevant to the specific needs and preferences of the local community. This means customers are more likely to find the products they want, which directly enhances their shopping experience.
3.4. Low-cost structure (the most important one)
Fayard et al. define cost management as the cost of portfolio management and business activities that enables organizations to manage their cost management decisions [4]. Using strategic cost management approach can create competitive advantage for the companies, because it provides accurate cost price information so that the users can easily understand the information [5].
Save administrative expenses — For instance, they encouraged shareholders to opt for receiving future annual reports and proxies through email.
Many stores have managed to cut down on real estate costs by opting for free-standing buildings instead of pricier spaces in regional malls, thereby reducing their rent expenses and overall real estate outlays.. For example, a BBBY store in Ann Arbor, Michigan, located in the suburbs of Ann Arbor, close to the University of Michigan. Students and young families are key consumers of home goods, and BBBY appeals to them with affordable and practical products.,which means Those kinds of stores can benefit from being more integrated into local communities, potentially leading to higher customer loyalty and repeat business. Also, Free-standing buildings often have lower rental rates compared to regional malls. Moreover, Free-standing buildings allow for more flexibility in store layout and design. This can be crucial for a retailer like BBBY, which often requires large display areas for bulky items like bedding, furniture, and kitchenware, which might not be possible in a mall setting with more rigid structural constraints. In conclusion this strategy allows BBBY to maintain high customer volumes in non-city-center locations and remain a key player in the home goods retail market.
Initially, the initial orders were placed through the corporate buying office, which was responsible for sourcing and negotiating bulk purchases with suppliers. This centralized approach ensured that the company could take advantage of economies of scale and secure favorable terms for the initial stock. However, once the initial stock had been depleted or required replenishment, the responsibility for reordering was handed over to the store managers. These managers, being on the front line and well-versed in the local market conditions and customer preferences, were in the best position to assess the specific needs of their stores. As a result, this system significantly reduced the incidence of stockouts, ensuring that popular items were consistently available for customers. At the same time, it minimized the risk of accumulating excess inventory, which can be costly to store and may eventually lead to markdowns.
The company adopted a direct distribution strategy, which involved shipping merchandise straight from vendors to individual stores. By eliminating the use of central distribution centers, they were able to streamline the supply chain and significantly reduce freight costs. This approach not only lowered transportation expenses but also minimized the time it took for products to reach the stores, ensuring that items were available for sale more quickly.
Bed Bath & Beyond allocated fewer budgets to advertising compared to many of its retail counterparts. Instead of relying heavily on traditional advertising methods, the company leveraged word-of-mouth referrals and cost-effective mail circulars to attract customers to its stores, thereby reducing its marketing expenses. Additionally, by utilizing email marketing, Bed Bath & Beyond can send personalized messages directly to customers' inboxes. This approach enables the company to customize its communications based on individual customer preferences and purchase histories. Through segmenting its email list and deploying targeted campaigns, Bed Bath & Beyond can enhance customer engagement and boost sales .
So, this low structure Enhanced the company's financial stability and market competitiveness.
3.5. Future plan
The Company was currently executing a continuous growth strategy that encompasses launching new stores in both emerging and established markets, as well as undertaking the expansion or relocation of existing stores. As a result of this program, the quarterly and semi-annual periods up to August 28, 2004, the Company’s consolidated net sales increased by 14.6% and 18.4%, respectively, as compared to the corresponding periods last year primarily attributed by the continuing BBBY store expansion program [6]. International expansion was also reportedly under consideration. Bed Bath & Beyond also declared its plan to fund its expansion through internally generated cash flow. Compared to the expansion plans of other retail companies, BBBY's strategy had some notable differences. These differences were reflected not only in the scale and pace of expansion but also in strategic positioning, target markets, and operational models. For example, in the aspect of target market, BBBY primarily focused on the U.S. market, aiming to cover more regional markets by increasing the number of stores, but competitors like Walmart, Target may have started international expansion earlier, entering markets such as Canada, Mexico, and Europe. In the aspect of store format, BBBY stores were typically large, offering a wide selection of home goods and emphasizing a one-stop shopping experience. However, its Companies like Walmart and Target may focus more on diversified store formats (e.g., supercenters, community stores, small convenience stores) to meet different consumer needs. Even though Walmart expanded faster and on a larger scale, with a well-established international presence, IKEA achieved global success with its unique designs and low-price strategy, but Walmart's low-price strategy may limit its profit margins, and its brand image is more associated with "low prices" rather than "premium." and the shopping experience of IKEA (e.g., self-assembly) may not appeal to all consumers. BBBY's expansion plan differed from those of other companies in its focus on the U.S. market, emphasis on high profit margins, and customer-centric operational model. Through expansion, BBBY was able to increase market share, enhance brand influence, achieve economies of scale, and solidify its competitive advantages.
4. Problem
It can be seen from Table 3 that for Cash and cash equivalents, there is $400 million higher than its ongoing requirements for growth and operations. And for Long-term debt, there is 0 financial leverage raises concerns among investors. Above all data means that the company let the cash sit idle rather than return to shareholders through stock buybacks or dividend payments, so there is Insufficient shareholder returns.
Table 3: Selected from balance sheet for Bed Bath & Beyond, FYE 2003 ($ in thousands)
Cash and cash equivalents | 825,015 |
Short-term investment securities | 41,580 |
Merchandise inventories | 1,012,334 |
Other current assets | 90,357 |
Total current assets | 1,969,286 |
Total assets | 2,865,023 |
Long-term debt | — |
Total current liabilities | 769,534 |
Total liabilities | 874,203 |
Total shareholders' equity | 1,990,820 |
Total liabilities and shareholders' equity | 2,865,023 |
It is obvious that the ROA and ROE for Bed Bath & Beyond showed an overall downward trend from 1999 to 2003 (please see Table 4), and this is because the company's efficiency in utilizing its assets and equity declined over time. Specifically, ROA decreased from 17.5% in 1999 to 15.8% in 2003, while ROE fell from 27.1% in 1999 to 23.2% in 2003.
So, this data means that for Bed Bath & Beyond, the low return on cash holdings drags down the ROE, as excess cash or low-yielding investments did not contribute significantly to profitability. Additionally, there is inefficient use of capital, as the declining ROA indicates that the company was unable to generate higher returns from its asset base, further contributing to the decline in ROE. This suggests that Bed Bath & Beyond faced challenges in managing its resources effectively and maximizing shareholder value during this period.
Table 4: ROA & ROE for Bed Bath & Beyond, FYE 1999 to 2003
Fiscal Year | 1999 | 2000 | 2001 | 2002 | 2003 |
Return on assets | 17.5% | 16.7% | 15.4% | 15.8% | 15.8% |
Return on equity | 27.1% | 25.0% | 23.0% | 23.7% | 23.2% |
5. Analysis
5.1. Theory
5.1.1. Trade off theory
Its main idea is balancing the tax shield effect of debt and the cost of financial distress. in a perfect capital market (with no taxes, no transaction costs, no bankruptcy costs, and symmetric information), the value of a firm is independent of its capital structure (the proportion of debt to equity). This means that whether a firm uses debt financing or equity financing, its total value remains unchanged, as investors can replicate the firm's capital structure through personal borrowing (homemade leverage), thereby offsetting the impact of capital structure. Additionally, the paper points out that the cost of equity increases as the proportion of debt rises, but the weighted average cost of capital (WACC) remains constant [7]. In 1958 Modigliani and Miller introduced the famous MM theorem found that A positive theory of the impact of leverage on a firm's market value is fundamentally based on two major market imperfections: the taxation of corporate profits and the existence of bankruptcy penalties. The firm will tradeoff between the tax shield effect of debt and the costs of bankruptcy [8]. It can leverage the tax shield effect, reduce tax burden, and increase shareholder returns in advantage and may increase financial riskiness in disadvantage.
5.1.2. Pecking order theory
Myers, S. C., & Majluf, N. S. emphasizes firms' preference for internal funds (such as retained earnings). Since internal financing is not affected by information asymmetry and does not send negative signals to the market, firms prioritize using internal funds to meet investment needs. When external financing is required, the paper notes that firms tend to choose debt financing over equity financing. This is because debt financing is less sensitive to information asymmetry and does not lead to a decline in stock price, as equity financing does. When a firm chooses to issue new equity, the market may perceive the firm's stock as overvalued, leading to a decline in stock price. As a result, firms tend to avoid issuing new equity unless necessary [9]. The study of Bharath, S. T., Pasquariello, P., & Wu, G. finds that asymmetric information is indeed a significant factor influencing firms' financing choices, supporting the core hypothesis of the Pecking Order Theory. Specifically, firms with higher levels of information asymmetry tend to rely more on internal funds and prefer debt financing over equity financing when external financing is needed, in order to avoid the adverse selection problems caused by information asymmetry [10].
5.2. The result of having a large amount of debt
5.2.1. In advantage
(1) Save tax and use tax shield.
(2) Increase shareholder’s return — shareholders can use the current cash to invest other project and get more profit.
(3) Improve capital efficiency —The high return on invest would increase ROE.
5.2.2. In disadvantage
(1) Increase financial risk —if there is disproportional balance sheet like too much debt and too less cash, it will increase the stress of the company (may lead to bankruptcy). Also, their Secondary investment may lose money.
(2) Reduce flexibility—the cash is less than before, so they need to get money from others if they need.
6. Conclusion
6.1. Present situation
For Bed Bath & Beyond, the company firmly embraced the pecking order theory in its financial strategy and developed a steadfast approach to managing its resources. In this mindset, cash was regarded as the most valuable and reliable asset. The company prioritized maintaining a strong cash position to ensure liquidity and flexibility in meeting its operational needs and funding future growth. On the other hand, debt was viewed with caution and generally considered undesirable. The company aimed to minimize its reliance on external borrowing, believing that excessive debt could pose risks to its financial health and limit its strategic options.
6.2. Predict situation
If Bed Bath & Beyond chose to have 40% debt, they would have $400 million cash and $636.3 million debt (see Table 5). If Bed Bath & Beyond decided to have 80% debt, they would borrow $1.27 billion and then use those funds, along with its excess cash, to buy back shares. Another option that was suggested was to give the money to shareholders through a one-time special dividend. While share repurchases were more common, the management was aware of recent changes in tax policies. These changes were believed to have removed the tax disadvantages associated with dividends.
Table 5: Pro Forma 2003 results for alternative capital structures ($ in thousands except per share and ratio data)
Actual 2003 | Pro Forma 2003 40% Debt to Total Capital | Pro Forma 2003 80% Debt to Total Capital | |
Sales | 4,477,981.00 | 4,477,981.00 | 4,477,981.00 |
Operating profit | 639,343.00 | 639,343.00 | 639,343.00 |
Interest income | 10,202.00 | 5,493.00 | 5,493.00 |
EBIT | 649,545.00 | 644,836.00 | 644,836.00 |
Interest expense | - | 28,633.50 | 571,500.00 |
Profit before taxes | 649,545.00 | 616,202.50 | 73,336.00 |
Taxes | 250,074.83 | 237,237.96 | 28,234.36 |
Profit after taxes | 399,470.18 | 378,964.54 | 45,101.64 |
EPS—basic | 1.35 | 1.41 | 0.18 |
Average shares outstanding—basic | 296,854.00 | 268,845.89 | 251,718.86 |
Return on Equity | 0.20 | 0.40 | 0.14 |
Cash and equivalents | 866,595.00 | 466,595.00 | 466,595.00 |
Total debt | - | 636,300.00 | 1,270,000.00 |
Total repurchase amount | - | 1,036,300.00 | 1,670,000.00 |
Share holders' equity | 1,990,820.00 | 954,520.00 | 320,820.00 |
However, if they choose 80% Debt to Total Capita, the tax is higher than other situation, but the EPS—basic and Return on Equity is highest in 40% Debt to Total Capital (see Table 6).
Table 6: Simulation
Actual 2003 | Pro Forma 2003 40% Debt To Total Capital | Pro Forma 2003 80% Debt To Total Capita | |
Taxes | 250,074.83 | 237,237.96 | 28,234.36 |
EPS—basic | 1.35 | 1.41 | 0.18 |
Return on Equity | 0.20 | 0.40 | 0.14 |
6.3. Suggestion
So, the suggestion of this paper is to use trade off theory that appropriate level of debt can improve the profitability of Bed Bath & Beyond. The four reasons are as follows:
(1) It can leverage the tax shield effect
(2) It can get higher ROE & EPS
(3) Bed Bath & Beyond's financial condition is stable
(4) The low-interest rate environment in 2004 provided an opportunity for Bed Bath & Beyond to issue low-cost debt
References
[1]. Scott Jr, J. H. (1976). A theory of optimal capital structure. The bell journal of economics, 33-54.
[2]. Afrasiabishani, J., Ahmadinia, H., & Hesami, E. (2012). A comprehensive review on capital structure theories. The Romanian Economic General, 15(45), 3-26.
[3]. Dutch Fayard, Lorraine S. Lee, William J.s Kettinger. (2012) Effect of internal cost management, information systems integration, and absorptive capacity on inter-organizational cost management in supply chains Economics · Accounting Organizations and Society DOI:10.1016/J.AOS.2012.02.001
[4]. Azriah Amir, Sopfiah Md Auzair and Rozita Amiruddin. (2015) Cost management, entrepreneurship and competitiveness of strategic priorities for smalld medium enterprises doi: 10.1016/j.sbspro.2016.04.046
[5]. Mohammad Mahdi Rounaghi , Hajer Jarrar,Leo‑Paul Dana(2021) Implementation of strategic cost management in manufacturing companies: overcoming costs stickiness and increasing corporate sustainability Rounaghi et al. Futur Bus J 2021, 7(1):31 https://doi.org/10.1186/s43093-021-00079-4
[6]. Bed Bath & Beyond INC -10-Quartely Report – 08/28/2004 UNITED STATES SECURITIES AND EXCHANGE COMMISSIONWashington, D.C. 20549 http://www.getfilings.com/o0001104659-04-029164.html
[7]. Modigliani and Miller (1958)The Cost of Capital, Corporation Finance and the Theory of Investment
[8]. Kraus, A., & Litzenberger, R. H. (1973). A state-preference model of optimal financial leverage. Journal of Finance, 28(4), 911–922.s
[9]. Myers, S. C., & Majluf, N. S. (1984) Corporate Financing and Investment Decisions When Firms Have Information That Investors Do Not Have
[10]. Bharath, S. T., Pasquariello, P., & Wu, G. (2009) Does Asymmetric Information Drive Capital Structure Decisions?
Cite this article
Li,Z. (2025). Bed Bath & Beyond: The Capital Structure Decision. Advances in Economics, Management and Political Sciences,183,58-67.
Data availability
The datasets used and/or analyzed during the current study will be available from the authors upon reasonable request.
Disclaimer/Publisher's Note
The statements, opinions and data contained in all publications are solely those of the individual author(s) and contributor(s) and not of EWA Publishing and/or the editor(s). EWA Publishing and/or the editor(s) disclaim responsibility for any injury to people or property resulting from any ideas, methods, instructions or products referred to in the content.
About volume
Volume title: Proceedings of the 3rd International Conference on Management Research and Economic Development
© 2024 by the author(s). Licensee EWA Publishing, Oxford, UK. This article is an open access article distributed under the terms and
conditions of the Creative Commons Attribution (CC BY) license. Authors who
publish this series agree to the following terms:
1. Authors retain copyright and grant the series right of first publication with the work simultaneously licensed under a Creative Commons
Attribution License that allows others to share the work with an acknowledgment of the work's authorship and initial publication in this
series.
2. Authors are able to enter into separate, additional contractual arrangements for the non-exclusive distribution of the series's published
version of the work (e.g., post it to an institutional repository or publish it in a book), with an acknowledgment of its initial
publication in this series.
3. Authors are permitted and encouraged to post their work online (e.g., in institutional repositories or on their website) prior to and
during the submission process, as it can lead to productive exchanges, as well as earlier and greater citation of published work (See
Open access policy for details).
References
[1]. Scott Jr, J. H. (1976). A theory of optimal capital structure. The bell journal of economics, 33-54.
[2]. Afrasiabishani, J., Ahmadinia, H., & Hesami, E. (2012). A comprehensive review on capital structure theories. The Romanian Economic General, 15(45), 3-26.
[3]. Dutch Fayard, Lorraine S. Lee, William J.s Kettinger. (2012) Effect of internal cost management, information systems integration, and absorptive capacity on inter-organizational cost management in supply chains Economics · Accounting Organizations and Society DOI:10.1016/J.AOS.2012.02.001
[4]. Azriah Amir, Sopfiah Md Auzair and Rozita Amiruddin. (2015) Cost management, entrepreneurship and competitiveness of strategic priorities for smalld medium enterprises doi: 10.1016/j.sbspro.2016.04.046
[5]. Mohammad Mahdi Rounaghi , Hajer Jarrar,Leo‑Paul Dana(2021) Implementation of strategic cost management in manufacturing companies: overcoming costs stickiness and increasing corporate sustainability Rounaghi et al. Futur Bus J 2021, 7(1):31 https://doi.org/10.1186/s43093-021-00079-4
[6]. Bed Bath & Beyond INC -10-Quartely Report – 08/28/2004 UNITED STATES SECURITIES AND EXCHANGE COMMISSIONWashington, D.C. 20549 http://www.getfilings.com/o0001104659-04-029164.html
[7]. Modigliani and Miller (1958)The Cost of Capital, Corporation Finance and the Theory of Investment
[8]. Kraus, A., & Litzenberger, R. H. (1973). A state-preference model of optimal financial leverage. Journal of Finance, 28(4), 911–922.s
[9]. Myers, S. C., & Majluf, N. S. (1984) Corporate Financing and Investment Decisions When Firms Have Information That Investors Do Not Have
[10]. Bharath, S. T., Pasquariello, P., & Wu, G. (2009) Does Asymmetric Information Drive Capital Structure Decisions?