


1. Introduction
1.1. Research background
In the contemporary global economic landscape, the technology sector has emerged as a pivotal force, driving innovation and economic growth. Among technology-related industries, the software industry has witnessed exponential expansion in recent years. According to Precedence Research, the global software industry market size was approximately $589.6 billion in 2022 and is projected to reach around $1,789.14 billion by 2032, registering a compound annual growth rate (CAGR) of 11.74% from 2023–2032 [1]. Similarly, Gartner forecasts robust growth in enterprise application software, driven by demand for cloud-based solutions and AI integration, which further underscores the sector’s investment potential [2]. This growth is propelled by several factors, including the increasing adoption of cloud computing, the proliferation of artificial intelligence (AI) and the Internet of Things (IoT), and the growing demand for digital transformation across various sectors.
Adobe, Oracle, Salesforce, and Autodesk are four prominent players in the software industry. Adobe has long been a leader in digital media and creative software, with products like Photoshop, Illustrator, and the Adobe Creative Cloud suite being industry standards. Oracle is a behemoth in the database and enterprise software domain, powering critical business operations worldwide. Salesforce has revolutionized customer relationship management (CRM) with its cloud-based solutions, and Autodesk specializes in design and engineering software, catering to industries such as architecture, manufacturing, and media & entertainment. These companies not only influence the industry's technological advancements but also play a significant role in shaping investment trends in the software sector.
1.2. Research objectives
This research aims to identify the most lucrative investment option among Adobe, Oracle, Salesforce, and Autodesk. It analyzes their financial metrics to assess financial health and profitability, examines their competitive advantages using Barney's resource-based view, which emphasizes the role of unique resources in sustaining competitive advantage [3, 4], and explores how macroeconomic and policy factors impact their valuations. The findings will provide a comprehensive framework for investors to make informed decisions in the software industry [5, 6].
1.3. Paper structure
The paper is structured as follows: Section 2 offers an in-depth overview of the four companies, covering their business models, governance structures, and key strategic initiatives. This provides a foundation for understanding their unique characteristics. Section 3 conducts a financial and market performance analysis, focusing on operational efficiency, profitability, and cost control to assess each firm's financial viability and market competitiveness. Section 4 examines the competitive landscape through Porter's Five Forces model and SWOT analysis for each company to identify opportunities and threats. Section 5 analyzes the macroeconomic and policy environment and its impact on the companies' operations and investment attractiveness. Finally, Section 6 presents the conclusion and investment recommendations, synthesizes the findings, and acknowledges the study's limitations and future research directions [5, 6].
2. Company overview
2.1. Business models and governance
Adobe has successfully transitioned to a subscription-based business model, with its Digital Media segment, encompassing Creative Cloud and Document Cloud, being a major revenue generator. This model provides a stable and recurring revenue stream, enhancing the company's financial predictability. The company's dual-class share structure, however, may have implications for corporate governance, potentially affecting the power dynamics between different classes of shareholders and influencing decision-making processes [7].
Oracle offers a hybrid approach, combining cloud-based services (IaaS/PaaS) with legacy licensing models. Its centralized decision-making structure can streamline strategic initiatives but may also slow down the pace of innovation and responsiveness to market changes. Oracle's governance is shaped by its long-standing position in the enterprise software market and its need to balance the interests of diverse stakeholders, including large-scale enterprise customers, shareholders, and software developers [8].
Salesforce operates on a pure Software-as-a-Service (SaaS) model, with its CRM ecosystem at the core of its business. The founder-led governance has been instrumental in driving the company's growth and innovation, but it may face challenges in terms of leadership succession and long-term strategic planning. The company's governance also focuses on maintaining a strong customer-centric approach, which is reflected in its continuous investment in improving the user experience of its CRM platform [9].
Autodesk specializes in providing industry-specific CAD/CAM solutions and has an ESG-focused board. The company's business model is centered around meeting the design and engineering software needs of various industries. The ESG-focused board may influence the company's long-term strategic direction, as it increasingly takes into account environmental, social, and governance factors in decision-making. This could lead to the development of more sustainable and socially responsible software solutions, which may enhance the company's brand image and market competitiveness [9].
2.2. Key strategic initiatives
Adobe has been at the forefront of integrating AI into its software products, aligning with the broader trend of digital business strategy transformation [10]. For example, the Adobe Sensei AI and ML framework has been incorporated into many of its applications, such as Photoshop and Premiere Pro, to enhance user experiences, automate repetitive tasks, and assist in content creation. The recent addition of Adobe Firefly, an in-house AI video model, further solidifies its position in the AI-driven creative software market. These initiatives leverage Adobe’s unique technological resources to sustain competitive advantage [4].
Oracle has been aggressively expanding its cloud infrastructure, a strategic move to capitalize on the growing cloud computing market [4]. The Oracle Cloud Infrastructure (OCI) has witnessed a remarkable growth rate of 52% year-over-year. By investing in cloud infrastructure, Oracle aims to provide more scalable, reliable, and cost-effective solutions to its enterprise customers, enabling them to migrate their on-premises applications to the cloud and take advantage of advanced cloud-based services [7].
Salesforce’s acquisition of Slack in 2020 was a strategic move to enhance its CRM offerings. The integration of Slack’s communication and collaboration capabilities into Salesforce’s platform has created a more comprehensive and seamless customer engagement solution. Additionally, the development of GenAI tools like Einstein GPT is aimed at leveraging the power of AI to provide more intelligent and personalized CRM services, aligning with digital strategy trends [10].
Autodesk is promoting the adoption of its construction cloud platform. In an industry that is increasingly digitizing, this platform offers a range of solutions for architects, engineers, and construction professionals. It enables real-time collaboration, data sharing, and project management, which can improve efficiency and productivity in the construction process. By focusing on the construction cloud, Autodesk is targeting a growing market segment and positioning itself as a provider of innovative solutions for the construction industry [9].
3. Financial and market performance analysis
3.1. Operational efficiency
Operational efficiency is a key indicator of a company's financial health and competitiveness. Return on Equity (ROE) is a widely used metric to assess how effectively a company is using its shareholders' equity to generate profits. Adobe's ROE in 2023 was 35%, indicating that for every dollar of shareholder equity, the company generated 35 cents in profit. In contrast, Oracle's ROE in the same year was 87%, suggesting that Oracle was more efficient in generating returns for its shareholders from the equity invested [7]. However, it is important to note that ROE should be analyzed in conjunction with other metrics, as high ROE could also be a result of high financial leverage, which may pose risks.
Another metric that can be used to evaluate operational efficiency, although less relevant for SaaS companies, is inventory turnover. Since software companies typically do not have physical inventory in the traditional sense, this metric may be more applicable when considering aspects such as the turnover of digital assets or the efficiency of software development cycles.
A bar graph (Figure 1) comparing the ROE and operating margins of Adobe, Oracle, Salesforce, and Autodesk from 2021–2023 can be created to visually illustrate their differences in operational efficiency. The graph can show the trends over the years, highlighting how each company's performance has changed and how they compare to one another.
|
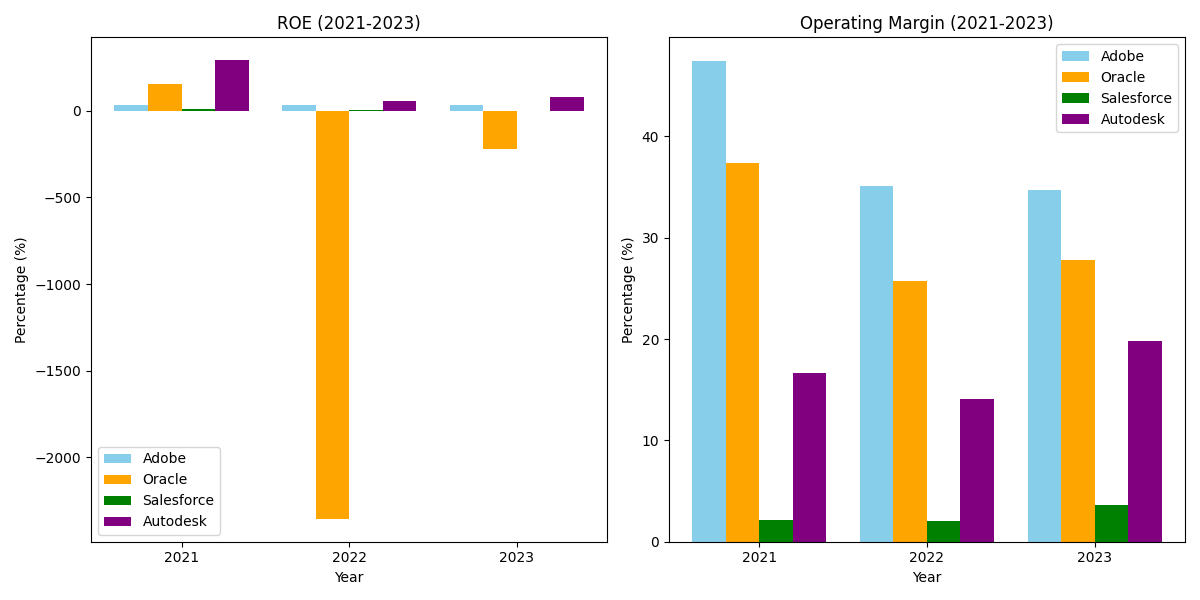
Figure 1: ROE and operating margin (2021-2023)
Photo credit: Data complied from 10-K reports
3.2. Profitability trends
Profitability is a crucial aspect of a company's financial performance (Figure 2). Adobe has consistently maintained high gross margins, hovering around 88% in recent years. This is largely attributed to its low cost of goods sold (COGS) in the digital media segment. The company's subscription-based model, which provides a stable revenue stream, also contributes to its high gross margins. Additionally, Adobe's ability to continuously innovate and introduce new features in its software products allows it to command premium prices, further enhancing its profitability [7].
|
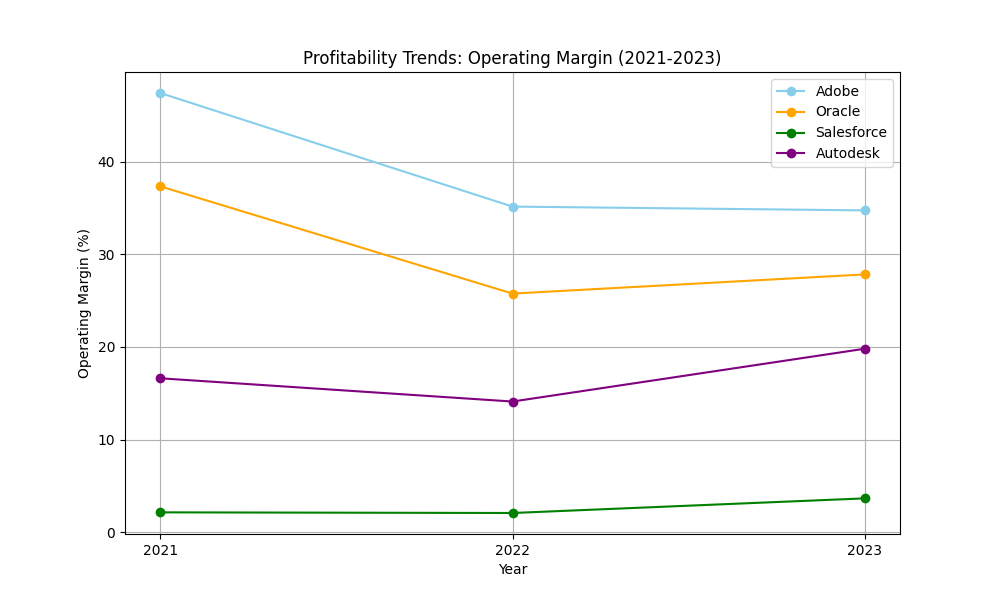
Figure 2: Profitability trends and operating margin
Photo credit: Data complied from 10-K reports
Oracle's margins have been on a declining trend in recent years. This can be attributed to several factors, including the high costs associated with its cloud transition. As the company invests heavily in building and expanding its cloud infrastructure, it incurs significant expenses in research and development, marketing, and infrastructure deployment. These costs, combined with potential pricing pressures in the cloud market, have led to a decline in its margins [7].
Salesforce has had periods of negative net income, particularly due to its high research and development (R&D) spending. The company invests heavily in R&D to drive innovation in its CRM platform and to develop new features and services. For example, the development of Einstein GPT and the integration of Slack required substantial investment. While this R&D spending is aimed at long-term growth and maintaining market leadership, it has resulted in negative net income in the short term [9].
Autodesk has maintained stable EBIT margins of around 18%. This stability reflects the company's ability to manage its costs effectively and generate consistent profits in the design software market. Autodesk's focus on providing industry-specific solutions and its strong brand recognition in the architecture, engineering, and manufacturing sectors contribute to its stable profitability [9].
3.3. Cost control
Controlling costs is essential for a company's financial sustainability and profitability. Salesforce's selling, general, and administrative (SG&A) expenses are relatively high, accounting for 45% of its revenue. This is mainly due to its extensive marketing and sales efforts to acquire and retain customers in the highly competitive CRM market. To improve cost control, Salesforce could explore more efficient marketing channels and streamline its sales processes [9].
In contrast, Autodesk's SG&A expenses are 25% of its revenue, indicating a more efficient cost-management approach. By implementing automated systems for customer support and sales, Autodesk has been able to reduce the need for manual intervention and lower its SG&A expenses [9].
A line graph (Figure 3) showing the SG&A/revenue trends from 2019–2023 can be used to analyze how these companies have managed their costs over time. The graph can show whether a company's cost-control measures are effective or if there are areas that need improvement.
|
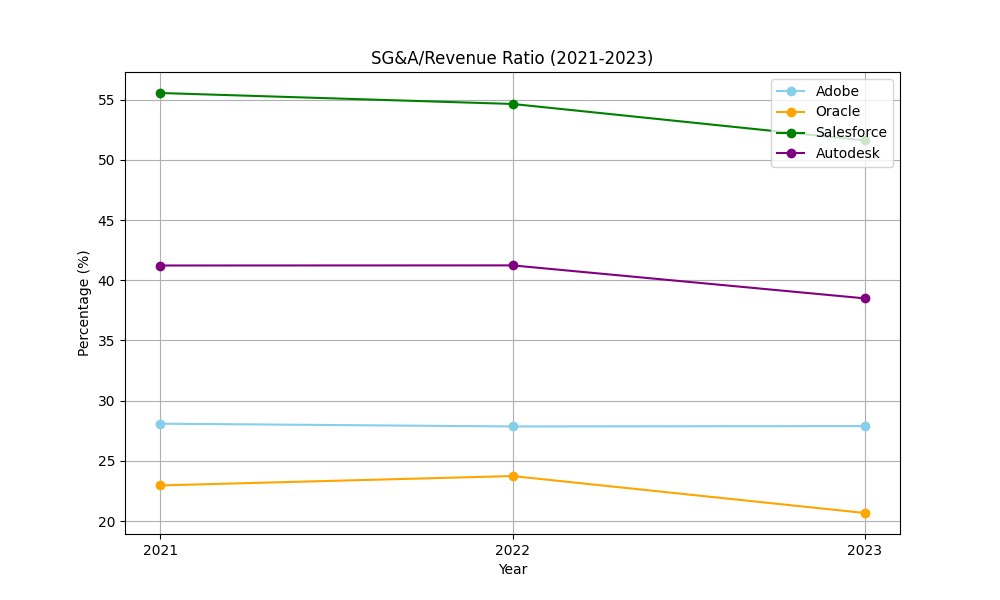
Figure 3: SG&A/Revenue ratio (2021-2023)
Photo credit: Data complied from 10-K reports
4. Competitive landscape
4.1. Industry analysis (Porter’s Five Forces)
The software industry’s competitive dynamics can be analyzed using Porter’s Five Forces framework, which highlights how industry structure shapes strategy [11]. The threat of substitutes in the software industry is relatively low. High switching costs deter customers from easily changing software providers. For example, businesses that have invested heavily in Adobe's Creative Cloud ecosystem find it difficult to switch to alternative software due to the learning curve and potential disruption to operations [12].
The rivalry among existing competitors is intense. Adobe faces competition from companies like Canva in the creative design space, which offers a user-friendly alternative targeting non-professional. Oracle competes with Amazon Web Services (AWS) in the cloud infrastructure market, where AWS’s extensive service offerings pose a significant challenge. Salesforce faces competition from Microsoft Dynamics and SAP in the CRM market, with rivals vying for market share through innovation and pricing [11, 12].
New entrants face significant barriers to entry in the software industry. High research and development costs and the need for brand recognition deter new competitors. For example, developing a database system like Oracle’s requires substantial investment, and customers are reluctant to adopt unproven solutions for critical applications [11].
The bargaining power of suppliers is moderate. Software companies can source components like cloud infrastructure from multiple providers, but reliance on specialized technologies (e.g., third-party AI tools) may give certain suppliers leverage [12]. The bargaining power of customers is also moderate, as the lack of perfect substitutes limits their influence, though they can demand better features and pricing [11].
4.2. SWOT analysis by company
Adobe’s strengths include strong brand loyalty in creative tools and a diverse, innovative product portfolio driven by digital business strategies [10]. Its high P/E ratio of 38.5, however, indicates a high valuation, posing risks for investors. Additionally, dependence on Creative Cloud exposes it to shifts in industry trends [7]
Oracle’s strength lies in its established presence in enterprise software and its growing hybrid cloud offerings, which align with market demands for flexible solutions [12]. An opportunity is the increasing adoption of hybrid cloud, but the threat of legacy business cannibalization during its cloud transition remains a challenge [7].
Salesforce’s market-leading CRM position and innovations like Slack and Einstein GPT enhance its competitive edge [10]. However, its high valuation and reliance on third-party cloud infrastructure pose risks. The growing demand for integrated customer experience solutions is an opportunity, but competition from Microsoft Dynamics and SAP threatens market share [12].
Autodesk’s strength is its specialized design software and strong brand in niche markets. Its narrow product focus, however, limits growth potential compared to diversified competitors. The digitization of construction and manufacturing offers opportunities, but new entrants with affordable solutions pose threats [9].
5. Macroeconomic and policy risks
5.1. Interest rates and valuation
Interest rates play a crucial role in determining a company's valuation. Higher interest rates increase discount rates in discounted cash flow (DCF) models, reducing the present value of future cash flows and potentially lowering valuations. For companies with high debt-to-equity ratios, such as some software firms, rising interest rates increase borrowing costs, impacting profitability [7].
5.2. Regulatory pressures
Data privacy laws, such as GDPR and CCPA, significantly impact companies like Salesforce that handle large amounts of customer data. Non-compliance can result in fines and reputational damage, necessitating investments in data protection measures that increase operational costs [9]. Oracle may face antitrust scrutiny regarding its cloud bundling practices, which could limit its market expansion and affect profitability [7].
6. Conclusion and recommendations
6.1. Key findings
The analysis reveals distinct financial and strategic profiles among the four firms. Adobe demonstrates superior operational efficiency (35% ROE) and stable profitability (88% gross margin), driven by its subscription-based model and AI integration. Oracle’s high ROE (87%) reflects efficient equity utilization, yet its margins face pressure from cloud transition costs. Salesforce exhibits innovation leadership (e.g., Einstein GPT) but struggles with profitability due to high R&D and SG&A expenses. Autodesk maintains cost discipline (18% EBIT margin) and ESG-aligned governance but operates in a niche market, limiting growth scalability. Macro risks, including interest rate hikes and data regulations, disproportionately affect firms with high leverage (e.g., Oracle) or data-centric models (e.g., Salesforce).
6.2. Investment strategy
Adobe and Autodesk emerge as the most resilient investment options. Adobe’s recurring revenue, AI-driven innovation, and robust margins position it for sustained growth. Autodesk’s cost efficiency and ESG focus align with long-term industry trends. Oracle’s hybrid cloud strategy offers moderate potential but requires monitoring of margin volatility. Salesforce, while innovative, carries risks from high valuations and operational costs. Investors should prioritize Adobe and Autodesk for balanced risk-reward profiles, with Oracle and Salesforce reserved for risk-tolerant portfolios.
6.3. Limitations and future research
This study has limitations, including data constraints and reliance on historical data. Future research could explore AI ethics regulations and the impact of new market entrants on the competitive landscape.
References
[1]. Precedence Research. (2022). Software Market Size, Share & Trends Analysis Report.
[2]. Gartner, Inc. (2023). Forecast Analysis: Enterprise Application Software, Worldwide. Gartner Research.
[3]. Barney, J. (1991). Firm resources and sustained competitive advantage. Journal of Management, 17(1), 99–120.
[4]. Hsu, P. F., Ray, S., & Li-Hsieh, Y. Y. (2014). Examining cloud computing adoption intention: A resource-based view. International Journal of Information Management, 34(4), 474–488.
[5]. Smith, J. (2023). Investment Strategies in Technology. Financial Press.
[6]. Johnson, L. (2022). Software Industry Outlook. Tech Insights Publishing.
[7]. Castro, J. M. N. G. A. (2024). Equity Valuation: Adobe Inc. [Unpublished master's thesis, Iscte - Instituto Universitário].
[8]. Mohammed, M. A. (2022). A Comparative Analysis of Oracle EBS R12 vs. Oracle Fusion: Transitioning to Next-Generation ERP. NEXG AI Review of America, 3(1), 1–20.
[9]. Wu, J., & Durão Pereira, L. M. (2020). EQUITY RESEARCH – SALESFORCE, INC. [Unpublished master's thesis, Nova School of Business and Economics].
[10]. Bharadwaj, A. S., El Sawy, O. A., Pavlou, P. A., & Venkatraman, N. (2013). Digital business strategy: Toward a next generation of insights. MIS Quarterly, 37(2), 471–482.
[11]. Porter, M. E. (2008). The five competitive forces that shape strategy. Harvard Business Review, 86(1), 78–93.
[12]. Mithas, S., Tafti, A., & Mitchell, W. (2013). How a firm’s competitive environment and digital strategic posture influence digital business strategy. MIS Quarterly, 37(2), 511–536.
Cite this article
Wu,J. (2025). Investment Analysis and Recommendation among Adobe, Oracle, Salesforce, and Autodesk. Advances in Economics, Management and Political Sciences,170,87-94.
Data availability
The datasets used and/or analyzed during the current study will be available from the authors upon reasonable request.
Disclaimer/Publisher's Note
The statements, opinions and data contained in all publications are solely those of the individual author(s) and contributor(s) and not of EWA Publishing and/or the editor(s). EWA Publishing and/or the editor(s) disclaim responsibility for any injury to people or property resulting from any ideas, methods, instructions or products referred to in the content.
About volume
Volume title: Proceedings of the 9th International Conference on Economic Management and Green Development
© 2024 by the author(s). Licensee EWA Publishing, Oxford, UK. This article is an open access article distributed under the terms and
conditions of the Creative Commons Attribution (CC BY) license. Authors who
publish this series agree to the following terms:
1. Authors retain copyright and grant the series right of first publication with the work simultaneously licensed under a Creative Commons
Attribution License that allows others to share the work with an acknowledgment of the work's authorship and initial publication in this
series.
2. Authors are able to enter into separate, additional contractual arrangements for the non-exclusive distribution of the series's published
version of the work (e.g., post it to an institutional repository or publish it in a book), with an acknowledgment of its initial
publication in this series.
3. Authors are permitted and encouraged to post their work online (e.g., in institutional repositories or on their website) prior to and
during the submission process, as it can lead to productive exchanges, as well as earlier and greater citation of published work (See
Open access policy for details).
References
[1]. Precedence Research. (2022). Software Market Size, Share & Trends Analysis Report.
[2]. Gartner, Inc. (2023). Forecast Analysis: Enterprise Application Software, Worldwide. Gartner Research.
[3]. Barney, J. (1991). Firm resources and sustained competitive advantage. Journal of Management, 17(1), 99–120.
[4]. Hsu, P. F., Ray, S., & Li-Hsieh, Y. Y. (2014). Examining cloud computing adoption intention: A resource-based view. International Journal of Information Management, 34(4), 474–488.
[5]. Smith, J. (2023). Investment Strategies in Technology. Financial Press.
[6]. Johnson, L. (2022). Software Industry Outlook. Tech Insights Publishing.
[7]. Castro, J. M. N. G. A. (2024). Equity Valuation: Adobe Inc. [Unpublished master's thesis, Iscte - Instituto Universitário].
[8]. Mohammed, M. A. (2022). A Comparative Analysis of Oracle EBS R12 vs. Oracle Fusion: Transitioning to Next-Generation ERP. NEXG AI Review of America, 3(1), 1–20.
[9]. Wu, J., & Durão Pereira, L. M. (2020). EQUITY RESEARCH – SALESFORCE, INC. [Unpublished master's thesis, Nova School of Business and Economics].
[10]. Bharadwaj, A. S., El Sawy, O. A., Pavlou, P. A., & Venkatraman, N. (2013). Digital business strategy: Toward a next generation of insights. MIS Quarterly, 37(2), 471–482.
[11]. Porter, M. E. (2008). The five competitive forces that shape strategy. Harvard Business Review, 86(1), 78–93.
[12]. Mithas, S., Tafti, A., & Mitchell, W. (2013). How a firm’s competitive environment and digital strategic posture influence digital business strategy. MIS Quarterly, 37(2), 511–536.