


1. Introduction
As the core hub of the modern financial system, banks are deeply involved in processes such as resource allocation, economic regulation, and social wealth distribution. However, with the decline in interest rates and the intensification of competition in the financial market, problems such as the loss of old customers and insufficient appeal to new customers that banks are facing are constantly restricting their development. Therefore, to maintain the competitiveness and profitability of banks and thereby increase the success rate of bank deposit marketing, it is crucial to introduce more effective deposit marketing strategies [1]. However, in the current environment where marketing costs are constantly increasing and marketing success rates are continuously declining, the traditional extensive deposit marketing strategy of "casting a wide net" is no longer a good marketing strategy choice due to problems such as massive waste of resources and low efficiency in contacting customers [2]. In this study, while using different machine learning models, financial-related knowledge was also utilized. Meanwhile, research methods such as data cleaning, feature screening, data imbalance processing, and Spearman correlation analysis were employed. Moreover, the performances of various machine learning models and data imbalance processing methods were compared. Finally, a method for predicting whether the marketing strategy of banks is effective was proposed, which takes advantage of the XGBoost model and the RandomUnderSampler method. By using this method, the tendency of people of different ages, jobs, incomes, and educational backgrounds to respond to deposit marketing was deeply explored, which is helpful for banks to segment the target market and expand the business scope when formulating marketing strategies, thus carrying out more refined, personalized and scenario-based marketing [3,4].
2. Data set introduction
This data set comes from Ali Cloud Tianchi, with a data volume of 2137KB and 25317 pieces of data and 18 field information, that is, 25317 rows *18 columns. The first column ID is an irrelevant field, so only 17 field information is analyzed. The fields of this data set include age, job (such as politician, blue-collar, student, etc.), marital status (married, single, divorced, unknown), education level (elementary, middle, high, unknown), credit status (whether there is a default record), account balance, housing loan (whether there is a mortgage) and personal loan (whether there is a loan), which are basic personal information related to customers. Also, there is information related to customer contact and marketing, such as contact way (mobile phone, landline, unknown), last contact day, last contact month, talk time (in seconds), number of contacts in the previous marketing campaign, the number of days since the last contact, the number of contacts in previous marketing campaigns, the result of the last marketing campaign (failed, successful, other, unknown), as well as the target data: whether the customer has a time deposit. Table 1 gives a brief overview of the field information in the data set.
Table 1: Data set introduction
Number | Variable name | Description | Variable type |
1 | age | age | continuous |
2 | job | job | discrete |
3 | marital | marital status | discrete |
4 | education | education level | discrete |
5 | default | whether there is a default record | discrete |
6 | balance | account balance | continuous |
7 | housing | whether there is a mortgage | discrete |
8 | loan | whether there is a loan | discrete |
9 | contact | contact way | discrete |
10 | day | last contact day | discrete |
11 | month | last contact month | discrete |
12 | duration | talk time | continuous |
13 | campaign | number of contacts in the last marketing campaign | continuous |
14 | pdays | the number of days since the last contact | continuous |
15 | previous | the number of contacts in previous marketing campaigns | discrete |
16 | poutcome | the result of the last marketing campaign | discrete |
17 | deposit | whether the customer has a deposit | discrete |
3. Research methods
3.1. Data cleaning
(1) Since there is no missing data, no data filling is performed.
(2) Column name 'y' is changed to “deposit”.
(3) Since if the customer has not been contacted before, the value of “pdays” is -1, which is highly similar to the influence of “previous” on the results, the field of “pdays” will not be analyzed in the subsequent research.
(4) 80% of the data set used in this study is the training set and 20% is the test set.
3.2. Correlation analysis
By drawing the Spearman correlation heat map, as shown in Figure 1, the analysis shows that: whether the customer chooses the deposit is strongly related to the call time (0.34); There is a certain correlation with whether customers choose deposits: contact information (-0.15), the last contact days (0.16), the cumulative number of contacts (0.17), the last marketing result (-0.15) and whether there is a mortgage (-0.14). Among them, the call time is a continuous variable, and the contact information, the last contact days, the cumulative number of contacts, the last marketing result, and whether there is a mortgage are discrete variables.
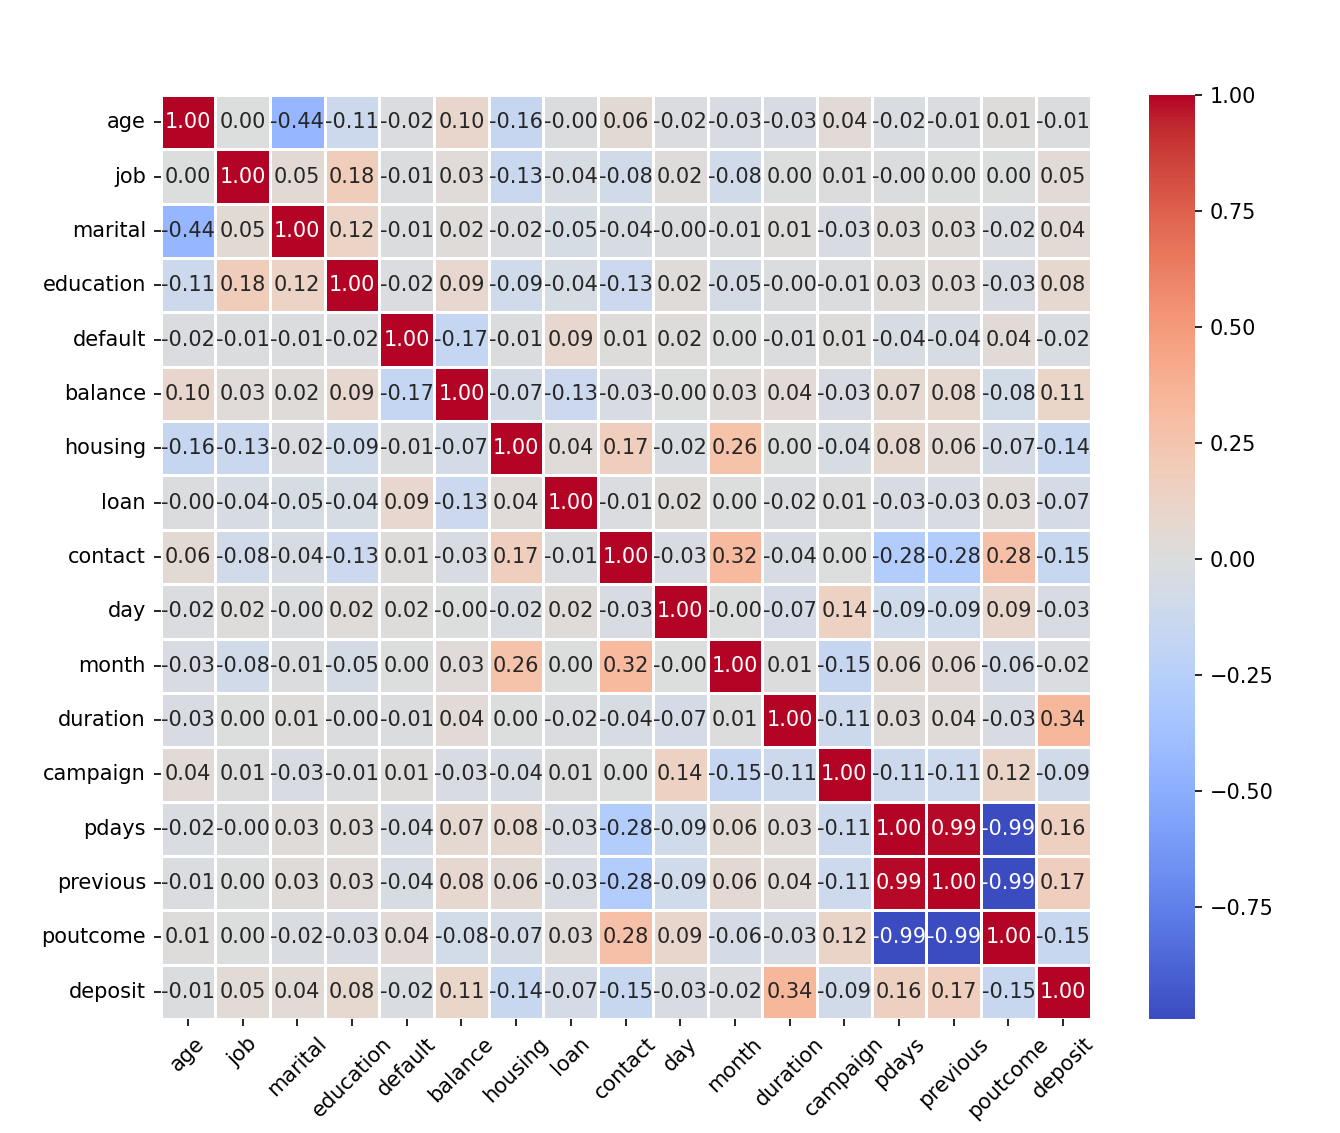
Figure 1: Spearman correlation heat map
After drawing and analyzing the frequency analysis bar chart of the target data and related fields, the following conclusions can be obtained:
(1) More customers are willing to deposit when the call time is longer. It may be that customers with longer call times are willing to spend more time learning about deposit-related information and are more interested in deposits, so they tend to have stronger deposit intentions (Figure 2).
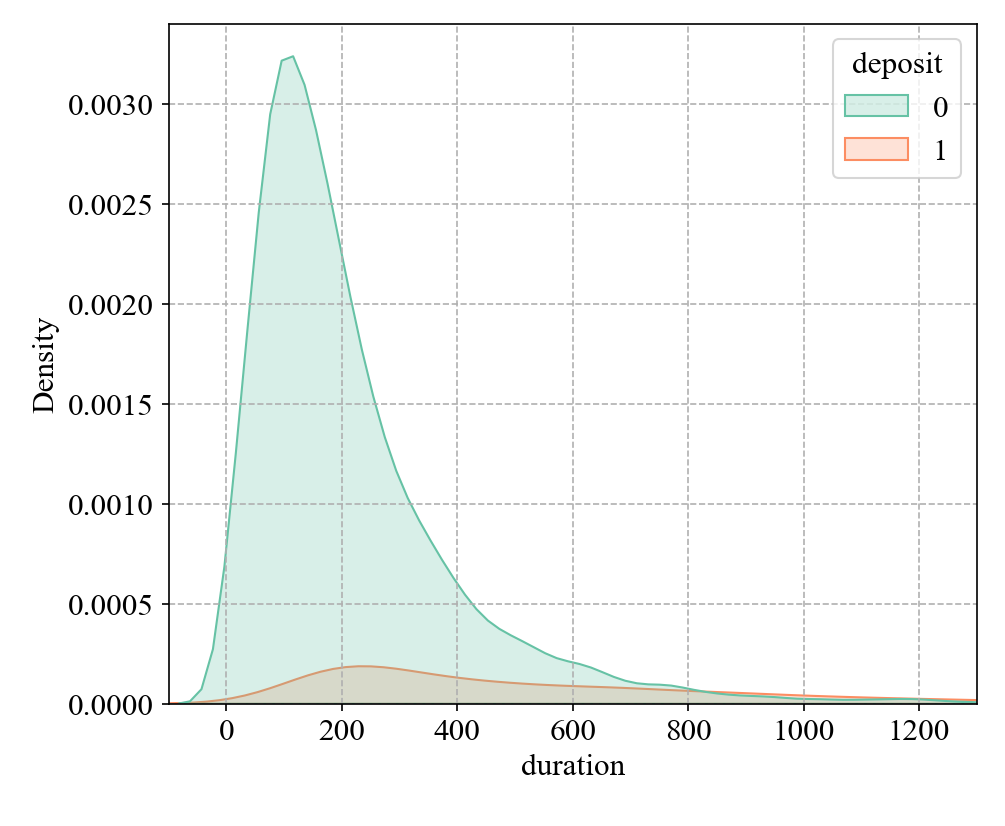
Figure 2: The relationship between duration and deposit
(2) A similar proportion of mobile and landline customers are willing to deposit money, while fewer deposit customers use unknown (other) contact information (Figure 3).
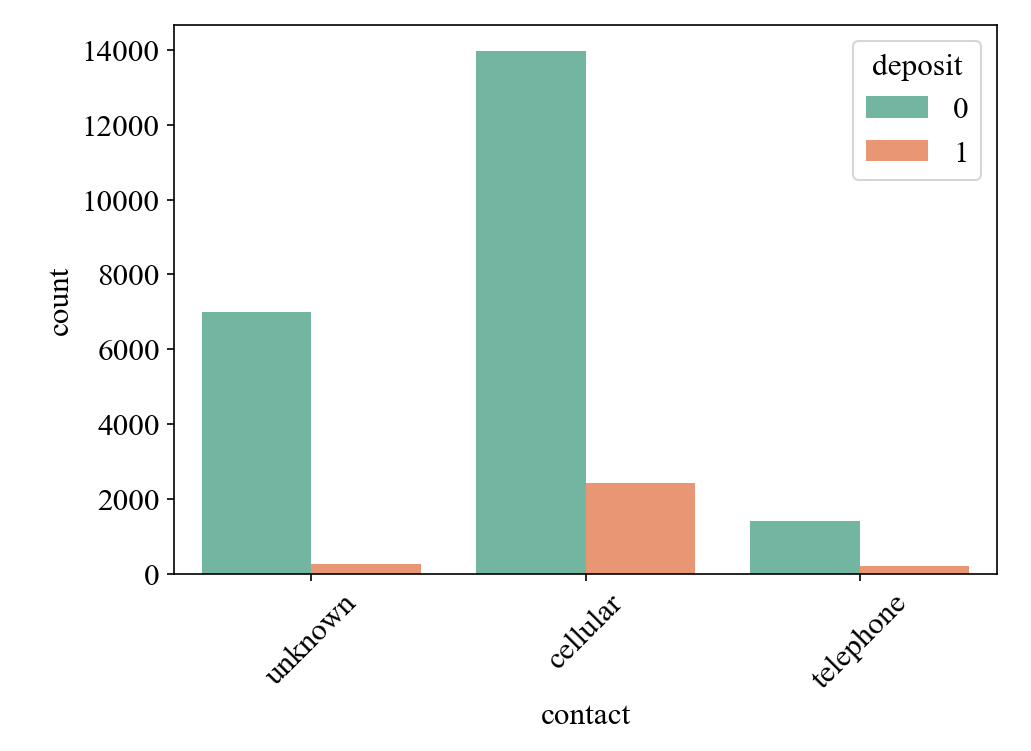
Figure 3: The relationship between duration and deposit
(3) With the increase in the number of contacts with customers, the proportion of customers willing to deposit money has a certain upward trend, and the proportion is 2-3 times higher than that of customers who have not contacted them (Figure 4).
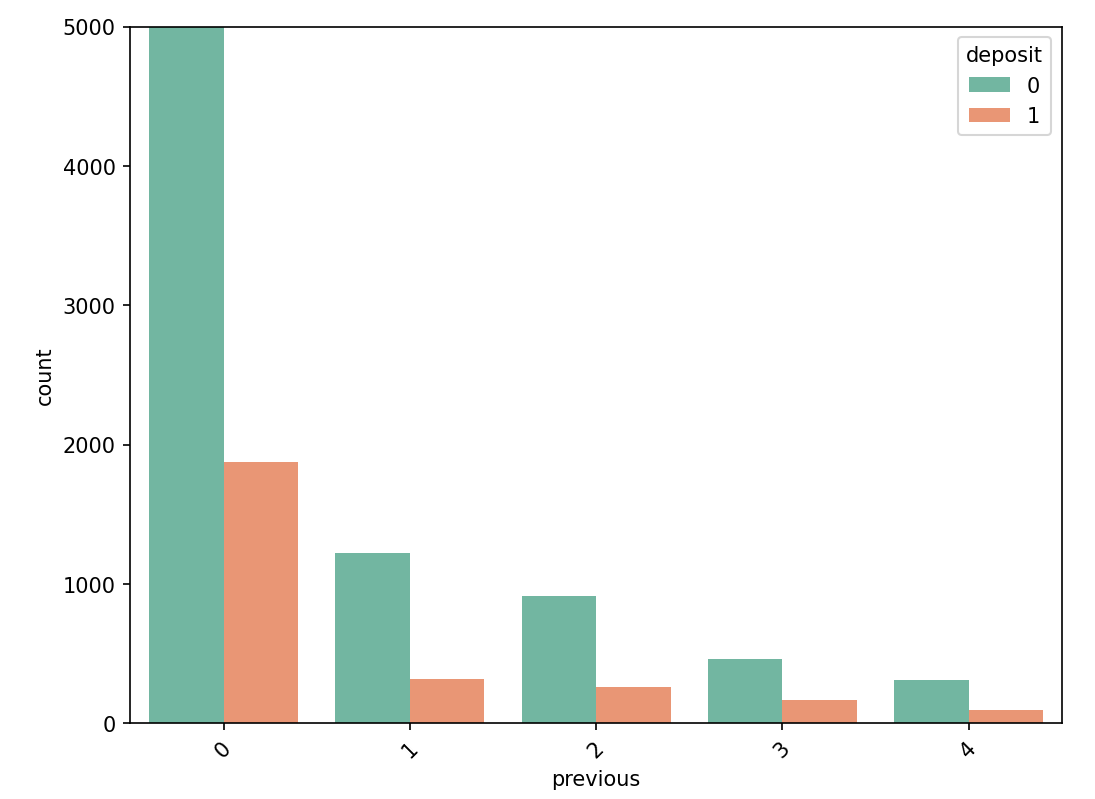
Figure 4: The relationship between previous and deposit
(3) Compared with customers who have not participated in marketing, customers who have participated in marketing have a stronger propensity to deposit, and customers who have deposited in the last marketing campaign have a higher probability of deposit (Figure 5).
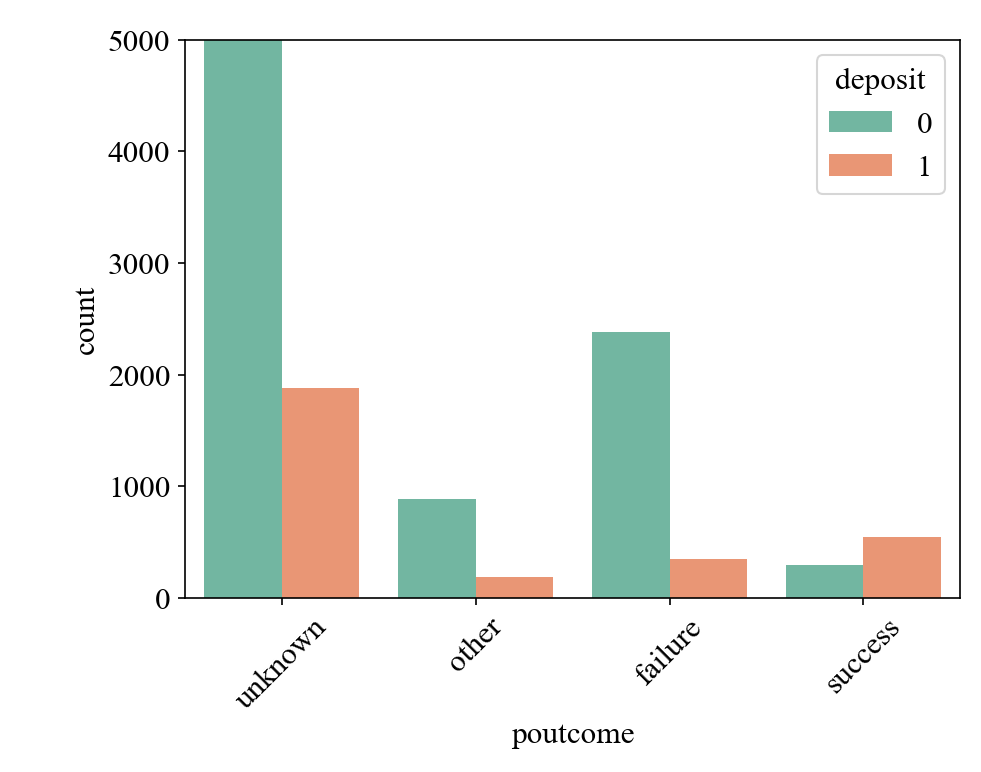
Figure 5: The relationship between poutcome and deposit
(4) Customers without housing loans are more willing to save, probably because those without housing loans tend to have higher disposable income and less economic pressure, so they choose a more conservative financial strategy (Figure 6).
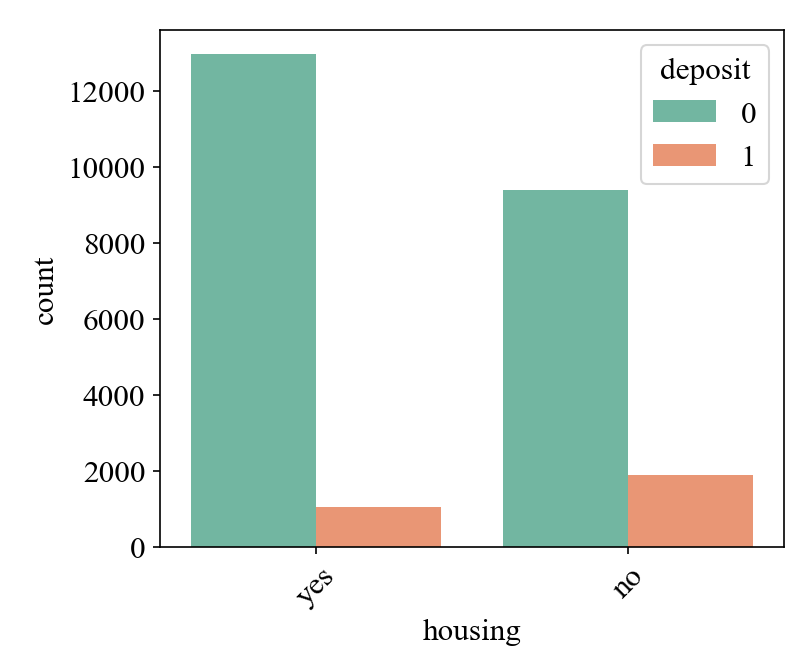
Figure 6: The relationship between housing and deposit
3.3. XGBoost model
XGBoost stands for eXtreme Gradient Boosting Tree. It is a Boosting algorithm based on the GBDT model, and its basic idea is to use the CART regression tree model as a weak processor and form a strong processor by integrating multiple weak processors. In the process of iteration, the generation of the latter regression tree will refer to the results of the previous tree, continuously learn the previous errors, and train the next decision tree based on the adjusted sample distribution, to reduce the probability of mistakes, and take the weighted sum of the predicted values of all CART regression trees as the final prediction result of the model. The objective function of XGBoost regression prediction consists of the loss function and regularization function, and the calculation formula is as follows:
\( O=\sum _{i=1}^{n}L({y_{i}},{\hat{y}_{i}})+\sum _{i=1}^{n}Ω({f_{i}}) \) (1)
In the formula above, \( n \) is the number of test values participating in training; \( {y_{i}} \) is the first test value; \( {\hat{y}_{i}} \) is the predicted value of the test value No. \( i \) ; \( L({y_{i}},{\hat{y}_{i}}) \) is the loss function; \( t \) is the total number of trees.
The loss function is used to measure the error between the prediction result of the model and the true label. The mean square error is selected as the loss function of the model, and the formula is as follows:
\( \sum _{i=1}^{n}L({y_{i}},{\hat{y}_{i}})=\sum _{i=1}^{n}({y_{i}}-{\hat{y}_{i}}{)^{2}} \) (2)
The regularization function can control the complexity of the model and help the model avoid over-fitting, and the formula is as follows:
\( Ω(f)=ηT+\frac{1}{2}λ\sum _{j=1}^{T}ω_{j}^{2} \) (3)
In the formula above, \( η \) is the punishment intensity; \( T \) is the depth of the current subtree; \( λ \) is the weight that controls the leaf nodes; \( {ω_{j}} \) is the node value of the leaf node No. \( j \) .[5]
Compared with models such as GBDT and Random Forest, the XGBoost model introduces second-order Taylor expansion and has advantages such as higher accuracy, greater flexibility, regularization, faster learning speed, and the use of parallel approximation algorithms. In the use of the XGBoost model in this study, the learning rate is 0.1, the number of weak classifiers for ensemble learning is 100, and its maximum depth is 3.
3.4. Confusion matrix and evaluating indicator
Figure 7 presents a schematic illustration of the confusion matrix. Herein: True Positive (TP) denotes a positive prediction and a positive label, representing the number of accurately predicted positive samples; False Positive (FP) indicates a positive prediction but a negative label, signifying the number of wrongly predicted negative samples; False Negative (FN) represents a negative prediction and a positive label, indicating the number of wrongly predicted positive samples; True Negative (TN) indicates a negative prediction and a negative label, representing the number of accurately predicted negative samples [6].
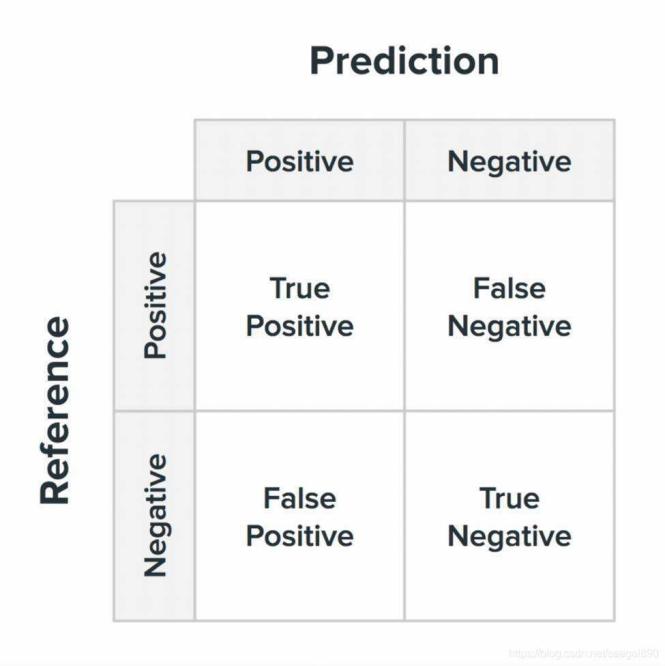
Figure 7: The confusion matrix [7]
In the research of the confusion matrix, the commonly employed evaluation metrics mainly include accuracy, precision, recall, f1-score, etc. The formulas are as follows:
\( {V_{Accuracy}}=\frac{TP+TN}{TP+FP+FN+TN} \) (4)
\( {V_{Pr{e}cision}}=\frac{TP}{TP+FP} \) (5)
\( {V_{Re{c}all}}=\frac{TP}{TP+FN} \) (6)
\( {V_{f1-score}}=\frac{2{V_{Pr{e}cision}}{V_{Re{c}all}}}{{V_{Pr{e}cision}}+{V_{Re{c}all}}} \) (7)
In other words, accuracy refers to the proportion of correct predictions; precision refers to the frequency of correctly predicting positive classes; recall refers to the frequency at which the model correctly identifies positive classes among all actual positive class labels; and F1-score is the harmonic mean of precision and recall [6].
Another useful evaluation metric is the AUC, which stands for the Area Under the ROC Curve. The ROC (Receiver Operating Characteristic) curve is a curve formed by TPR (True Positive Rate) and FPR (False Positive Rate) at different classification thresholds. Here, TPR is the vertical axis and FPR is the horizontal axis. Generally speaking, the larger the area under the ROC curve, the better the performance of the classification model. The formulas for TPR and FPR are as follows [8][9]:
\( TPR=\frac{TP}{TP+FN} \) (8)
\( FPR=\frac{FP}{FP+TN} \) (9)
In this research, as the gains derived from successfully facilitating customer deposits are much higher than the costs of marketing to customers, the False Negative portion of the confusion matrix is of greater significance, that is, while considering and comparing the other three evaluating indicators, \( {V_{Re{c}all}} \) is more important. Consequently, the required model should emphasize identifying more deposit customers rather than placing excessive emphasis on the proportion of deposit customers among the marketed customers.
3.5. Model performance comparison
By observing the performance of the evaluation metrics precision, recall, and f1 of the LR (Logistic Regression), DT (Decision Tree), Bagging, RF (Random Forest), GBDT (Gradient Boosting Decision Tree), and XGBoost models in 0 (non-deposit customers) and 1 (deposit customers), as well as the performance of the evaluation metrics auc and accuracy in the prediction of all customers through the following Figure 8, Figure 9, and Figure 10. It can be found that the XGBoost model performs better than other models in this dataset. The reasons are as follows: This study focuses on the recall rate of deposit customers. Since LR, Bagging, RF, and GBDT perform poorly in this metric, they are not considered. While the XGBoost model has a similarly high recall rate for deposit customers as the DT model, it also has significantly higher precision, AUC value, and accuracy than the DT model. Therefore, the XGBoost model performs more outstandingly.
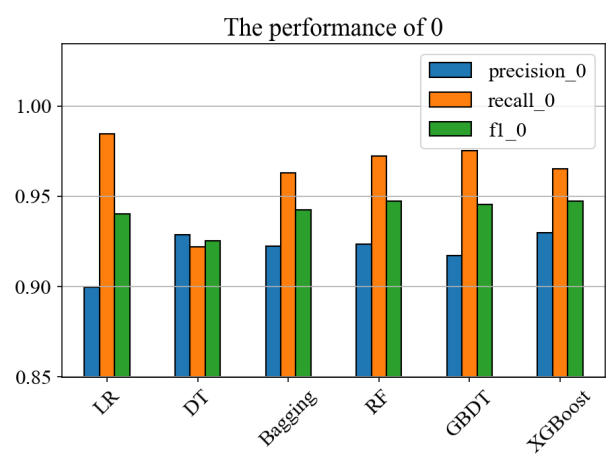
Figure 8: The performances of different models in non-deposit customers

Figure 9: The performances of different models in deposit customers
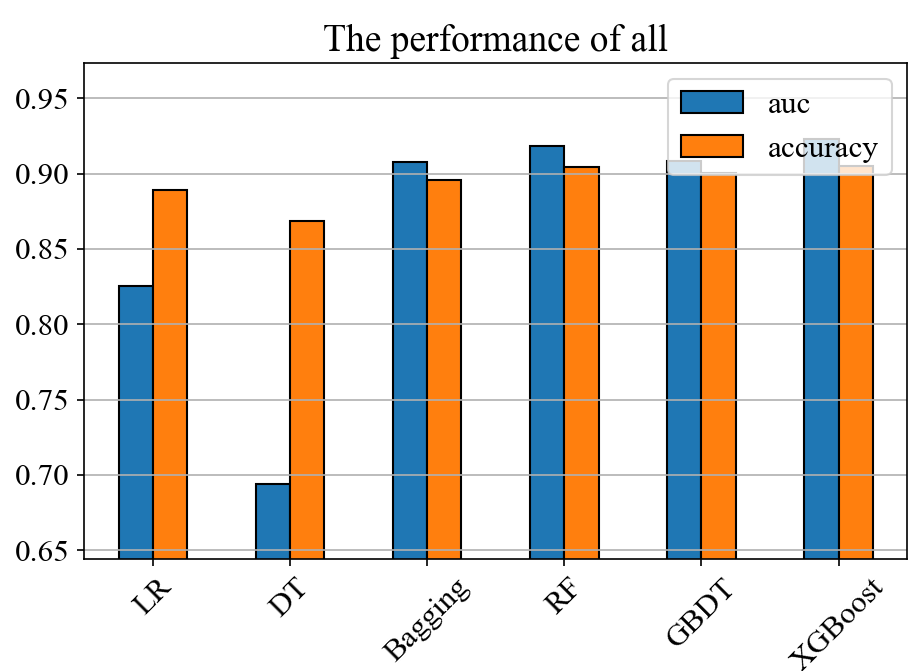
Figure 10: The performances of different models in all customers
3.6. Handling imbalanced data
An imbalanced dataset refers to a dataset whose number of samples in each class within the dataset varies significantly. When directly applying machine learning models to handle imbalanced datasets, it is prone to inflated accuracy rates, insufficient features in the classification with fewer samples, and difficulty in extracting patterns. Even if a classification model is obtained, it is likely to overfit due to its excessive reliance on limited data samples. When the model is applied to new data, its accuracy and robustness will be poor. Therefore, it is crucial to preprocess the dataset using certain methods when dealing with imbalanced datasets [8].
Upon observing Figure 11, it is found that deposit customers only account for 11.6% of all customers, clearly indicating that this dataset is imbalanced. Under the condition of using the XGBoost model, the performance of six data imbalance handling methods, namely SMOTE (Synthetic Minority Oversampling Technique), ADASYN (Adaptive Synthetic Sampling), RandomOverSampler, RandomUnderSampler, SMOTEENN (SMOTE and Edited Nearest Neighbours, and SMOTETomek, were compared. Ultimately, RandomUnderSampler, which achieved the highest recall rate (84.3%) for deposit customer data, was adopted. This method can reduce the risk of overfitting when the model encounters imbalanced datasets and significantly improve the recall rate (Figure 12).
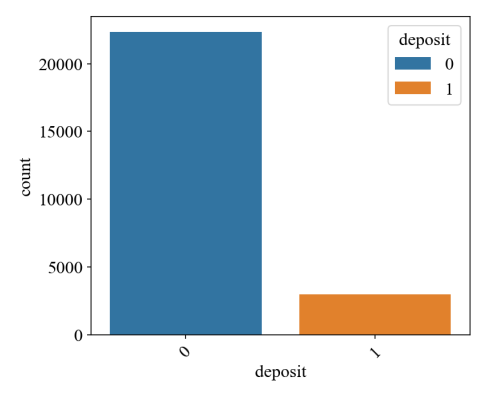
Figure 11: The number of non-deposit customers and deposit customers
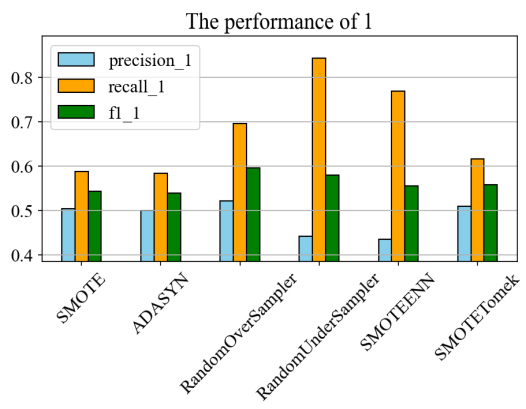
Figure 12: The performance of different methods in deposit customers
3.7. Feature selection
Feature screening is an important part of feature engineering. Its purpose is to remove irrelevant or redundant fields in the dataset, find the optimal feature subset, thereby reducing the number of features, reducing the running time, thereby improving the model performance and reducing the impact of overfitting on the model prediction results [10].
By observing Figure 13 and Figure 14, it can be known that after only retaining the fields with high spearman correlation for feature screening, the precision rate and recall rate of most models in predicting deposit customers decrease significantly. This indicates that there is still important information that has not been extracted in the unretained data, and the noise ratio is not high. Therefore, these fields with lower correlation cannot be directly removed.
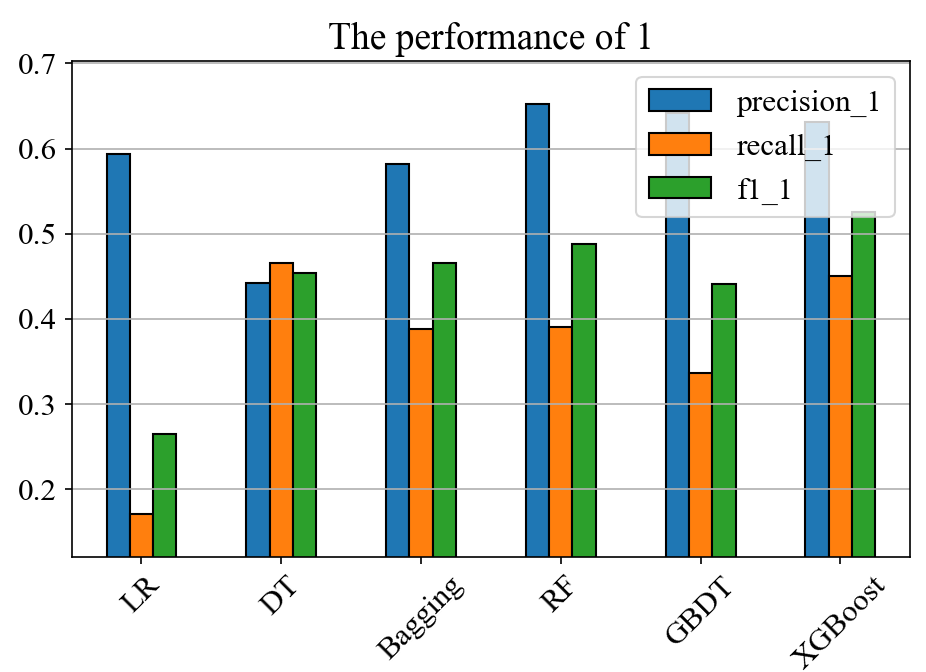
Figure 13: Before spearman feature selection
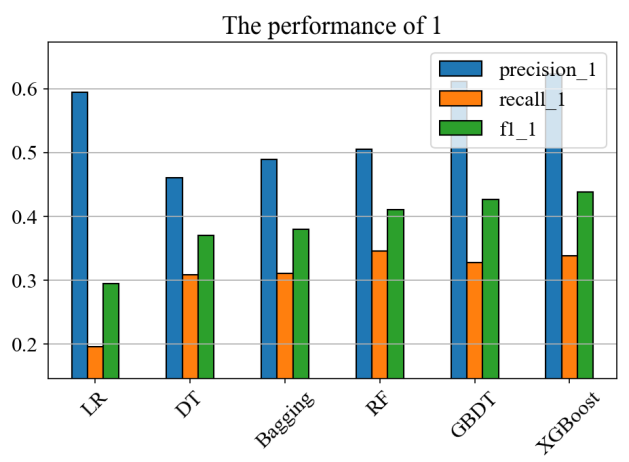
Figure 14: After spearman feature selection
4. Conclusion
Through Spearman correlation analysis, it is known that whether customers deposit or not has a certain correlation with marketing call duration, marketing contact methods, cumulative marketing contact times, the outcome of the last marketing effort, and whether customers have a mortgage. This study compared six models, namely LR (Logistic Regression), DT (Decision Tree), Bagging, RF (Random Forest), GBDT (Gradient Boosting Decision Tree), and XGBoost, as well as six data imbalance processing methods, namely SMOTE, ADASYN, RandomOverSampler, RandomUnderSampler, SMOTEENN, and SMOTETomek. Under the premise of mainly focusing on recall rate, after applying research methods such as data cleaning, model selection, data imbalance processing, and feature screening, it was found that the XGBoost model and the RandomUnderSampler method were relatively excellent. The combined recall rate of the two could reach 84.3%.
The current research is based on public, past datasets, which may lead to issues such as insufficient model robustness. In the future, tests will be conducted based on real, up-to-date online datasets to verify the robustness and effectiveness of this method. Due to the influence of the dataset size, the data dimensions may be insufficient. In the future, more dimensional data from social media, social networks, etc. can be used to enhance the model's performance and thereby optimize the prediction effect of the model.
References
[1]. Jin, J. (2025) Research on marketing digital transformation strategy of city commercial bank.Market Modernization, (02):138-140.
[2]. Li, J. (2024) Research on digital precision marketing strategy of commercial banks. Market Modernization, (24):106-108.
[3]. Lu L. (2022) Research on customer precision marketing of housing savings banks in China and Germany based on data mining.University of International Business and Economics.
[4]. Tang X, Zhu Y. (2024) Enhancing bank marketing strategies with ensemble learning: Empirical analysis. PLoS One. Jan 11;19(1):e0294759.
[5]. Zhang X, Liu J, Zhang W. (2025) Prediction of mechanical properties of PVC-P geomagnetic film with scratch damage based on XGBoost algorithm[J/OL].Water Resourses and Power,(05):111-115.
[6]. Assalé P Y F, Kouao A F A, Kessé T M. (2025) Machine learning and neural networks in predicting grain-size of sandy formations. Results in Earth Sciences, 3100084-100084.
[7]. Confusion Matrix. Retrieved from https://blog.csdn.net/seagal890/article/details/105059498
[8]. Imani M, Beikmohammadi A, Arabnia R H. (2025) Comprehensive Analysis of Random Forest and XGBoost Performance with SMOTE, ADASYN, and GNUS Under Varying Imbalance Levels.Technologies, 13(3):88-88.
[9]. Liu S,Tian Q , Liu Y, et al. (2024) Joint Statistical Inference for the Area under the ROC Curve and Youden Index under a Density Ratio Model. Mathematics, 12(13):2118-2118.
[10]. Zou Q, Wang J, Li Q, et al. (2025) The accurate estimation of soil available nutrients achieved by feature selection coupled with preprocessing based on MIR and pXRF fusion. European Journal of Agronomy, 168127633-127633.
Cite this article
Zheng,Y. (2025). Prediction of the Effectiveness of Bank Marketing Strategies Using the XGBoost Model . Advances in Economics, Management and Political Sciences,170,17-28.
Data availability
The datasets used and/or analyzed during the current study will be available from the authors upon reasonable request.
Disclaimer/Publisher's Note
The statements, opinions and data contained in all publications are solely those of the individual author(s) and contributor(s) and not of EWA Publishing and/or the editor(s). EWA Publishing and/or the editor(s) disclaim responsibility for any injury to people or property resulting from any ideas, methods, instructions or products referred to in the content.
About volume
Volume title: Proceedings of the 9th International Conference on Economic Management and Green Development
© 2024 by the author(s). Licensee EWA Publishing, Oxford, UK. This article is an open access article distributed under the terms and
conditions of the Creative Commons Attribution (CC BY) license. Authors who
publish this series agree to the following terms:
1. Authors retain copyright and grant the series right of first publication with the work simultaneously licensed under a Creative Commons
Attribution License that allows others to share the work with an acknowledgment of the work's authorship and initial publication in this
series.
2. Authors are able to enter into separate, additional contractual arrangements for the non-exclusive distribution of the series's published
version of the work (e.g., post it to an institutional repository or publish it in a book), with an acknowledgment of its initial
publication in this series.
3. Authors are permitted and encouraged to post their work online (e.g., in institutional repositories or on their website) prior to and
during the submission process, as it can lead to productive exchanges, as well as earlier and greater citation of published work (See
Open access policy for details).
References
[1]. Jin, J. (2025) Research on marketing digital transformation strategy of city commercial bank.Market Modernization, (02):138-140.
[2]. Li, J. (2024) Research on digital precision marketing strategy of commercial banks. Market Modernization, (24):106-108.
[3]. Lu L. (2022) Research on customer precision marketing of housing savings banks in China and Germany based on data mining.University of International Business and Economics.
[4]. Tang X, Zhu Y. (2024) Enhancing bank marketing strategies with ensemble learning: Empirical analysis. PLoS One. Jan 11;19(1):e0294759.
[5]. Zhang X, Liu J, Zhang W. (2025) Prediction of mechanical properties of PVC-P geomagnetic film with scratch damage based on XGBoost algorithm[J/OL].Water Resourses and Power,(05):111-115.
[6]. Assalé P Y F, Kouao A F A, Kessé T M. (2025) Machine learning and neural networks in predicting grain-size of sandy formations. Results in Earth Sciences, 3100084-100084.
[7]. Confusion Matrix. Retrieved from https://blog.csdn.net/seagal890/article/details/105059498
[8]. Imani M, Beikmohammadi A, Arabnia R H. (2025) Comprehensive Analysis of Random Forest and XGBoost Performance with SMOTE, ADASYN, and GNUS Under Varying Imbalance Levels.Technologies, 13(3):88-88.
[9]. Liu S,Tian Q , Liu Y, et al. (2024) Joint Statistical Inference for the Area under the ROC Curve and Youden Index under a Density Ratio Model. Mathematics, 12(13):2118-2118.
[10]. Zou Q, Wang J, Li Q, et al. (2025) The accurate estimation of soil available nutrients achieved by feature selection coupled with preprocessing based on MIR and pXRF fusion. European Journal of Agronomy, 168127633-127633.