


1. Introduction
With the advancement of global sustainable development goals, environmental, social, and governance (ESG) ratings have become a core tool for measuring corporate sustainability and risk management [1]. Green Fintech has significantly improved the accuracy and dynamics of ESG data governance through artificial intelligence, blockchain, and other technological innovations, providing technical support for green bond issuance, carbon financial instrument innovation [2].
In recent years, ESG dynamic valuation research has gradually shifted to a technology-driven paradigm. Early studies mostly relied on static models (e.g., decision trees, random forests), which are robust in non-linear relationship modeling but limited by historical data dependency and feature redundancy, making it difficult to adapt to dynamic changes in the market [3]. Recently, AI techniques (e.g., Chat-GPT sentiment analysis) have been introduced to ESG ratings, which improves real-time performance through text mining, while blockchain technology alleviates the data silo problem through distributed ledgers [4].
However, existing research still faces three major bottlenecks: first, the inefficiency of discrete feature modeling. Traditional classification codes (e.g., One-Hot) are prone to dimensional catastrophe and information loss when dealing with high-dimensional sparse features such as industry classifications and ESG ratings [5], resulting in limited model generalization capabilities [4]. Second, the assessment is not dynamic enough. Static machine learning models (e.g., decision trees, random forests) rely on historical data training, and it is difficult to respond in real time to dynamic situations such as policy adjustments and market fluctuations, resulting in evaluation lag and decision bias. Third, there is a risk in algorithm ethics. Existing models lack real-time monitoring mechanisms for sensitive features (e.g., geography, industry), which may amplify assessment bias and threaten the credibility of green financial instruments [6]. These shortcomings not only constrain the efficiency of ESG ratings applied in risk pricing and portfolio optimization, but also impede the scale development of green financial markets [7].
Therefore, there is an urgent need to construct an assessment framework that balances dynamic adaptability, efficient feature processing, and ethical constraints. This study focuses on constructing a dynamic ESG assessment framework based on a gradient boosting model, aiming to solve the three core problems of inefficient processing of discrete features, insufficient model dynamics, and ethical risks of algorithms [8]. The model performance is validated through comparative experiments, and a solution that takes into account technological innovation and policy synergy is finally proposed to support risk pricing and compliance decision-making for green financial instruments [9].
The main research methodology of this paper is as follows: Firstly, dynamic feature engineering is used to optimize high-dimensional discrete feature representations using embedding layers, combined with Z-score normalization and box-splitting techniques to deal with continuous variables; Secondly, incremental learning is driven by parameter fine-tuning to achieve dynamic model updating and adaptation to policy and market fluctuations.
The core contribution of this research is to fill the gap between dynamic adaptability and feature processing efficiency in existing ESG assessment techniques, providing a standardized and scalable technical solution for risk pricing and compliance decision-making of green financial instruments.
2. Literature review
2.1. Decision Tree Model (DTM)
Decision trees, as a supervised learning model based on rule partitioning, are widely employed in green finance and ESG assessment due to their interpretability and ability to model non-linear relationships. For instance, studies have identified "carbon emission reduction technology input" and "board governance structure" as key split nodes in the environmental and governance dimensions using CART decision trees, thus revealing the policy transmission mechanisms. Another study applied decision trees to examine the threshold effect of "disclosure frequency" and "external audit independence" on green bond corporate governance scores, offering a transparent foundation for investment decisions [10]. However, traditional decision trees exhibit notable limitations in complex financial settings: first, they struggle to efficiently process high-dimensional sparse features (e.g., industry classification, ESG ratings), and their reliance on manual coding increases the risk of dimensionality challenges [5]; second, static rules fail to adapt to cross-market dynamics, undermining the model's generalization ability [3].
To overcome these limitations, researchers propose adaptive optimization strategies. Technically, they integrate real-time data streams through dynamic pruning techniques to enhance the model's responsiveness [2]. Ethically, interpretable AI methods, such as SHAP values, are introduced to quantify the influence of sensitive features (e.g., geography, industry) on the rating outcomes, while fairness constraints are designed to minimize assessment biases [6]. These advancements address the dynamic adaptability and ethical governance shortcomings of traditional decision trees, while maintaining their interpretability and providing theoretical support for the evolution of ESG assessment methodologies.
2.2. Random Forest modeling
Random Forest is an integrated learning model that effectively improves model stability and generalization by constructing multiple decision trees and integrating their predictions. Its core mechanism lies in the double randomness of features and samples: each tree uses only a random subset of features and self-sampled training data, which reduces the risk of overfitting, and outputs aggregated results through majority voting or mean value [10]. In the field of green fintech, random forests demonstrate the unique advantage of integrating data from multiple sources. For example, some researches used its variable importance ranking to identify ‘supply chain carbon footprint transparency’ and ‘board independence’ as key drivers of governance (G) dimensions. It further fused structured financial indicators with unstructured public opinion data to construct a dynamic ESG risk early warning model.
However, random forests still face limitations in complex financial scenarios. For one, traditional methods rely on batch retraining, which makes it difficult to respond to high-frequency market signals (e.g., sudden changes in ESG opinion) in real time, leading to decision lag [2]. Second, it relies on One-Hot coding for high-dimensional discrete features (e.g., industry classification), which is prone to dimensionality catastrophe and information loss [5]. It pointed out that high-dimensional sparse features significantly reduce the efficiency of model training and the stability of the importance ranking of variables.
To address the above problems, researchers have proposed innovative improvement strategies: some integrated real-time data streaming with online learning to achieve dynamic updating of model parameters; some used embedding instead of traditional coding to map discrete features to low-dimensional continuous space, taking both efficiency and semantic relevance into account. that takes into account both efficiency and semantic relevance. These advances provide technical support for the application of random forests in dynamic ESG assessment, and help the accurate risk pricing of green financial instruments.
3. Methodology
3.1. General overview
This study proposes a gradient enhancement optimization fusion framework for discrete feature modelling inefficiency, lag, and ethical risk in ESG dynamic assessment. The dimensionality catastrophe is mitigated by high-dimensional discrete feature embedding characterization, continuous variable standardization, and split-box preprocessing, combined with random forest factor screening; Bayesian-tuned XGBoost is adopted to enhance dynamic adaptability; Stacking and SMOTE are integrated to improve robustness; and blockchain is introduced to safeguard data trustworthiness. The framework optimizes the risk pricing and compliance decision-making mechanism of green financial instruments through dynamic modelling and promotes the scale application of ESG ratings in complex scenarios.
3.2. Data inputs
This study adopts the Kaggle dataset Public Company ESG Ratings Dataset, which covers the structured ESG ratings data of more than 700 medium- and large-sized listed companies around the world, covering diversified industries such as utilities, technology, etc., and integrating quantitative indicators and qualitative grades of environment (E), society (S), and governance (G).
3.3. Data visualization & analysis
3.3.1. Average ESG scores by industry (top 10)
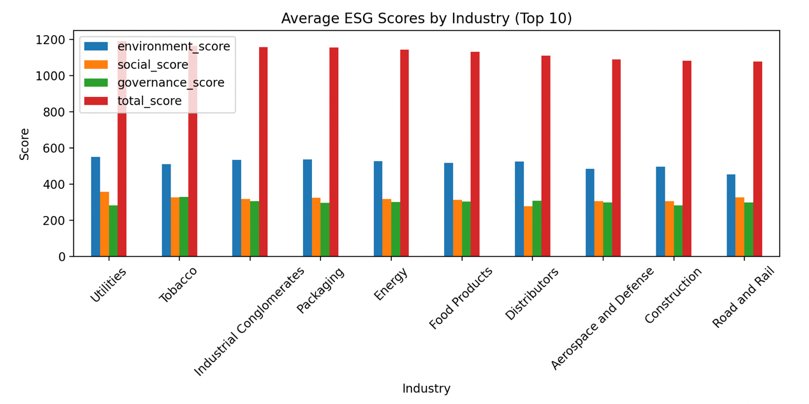
Figure 1: Average ESG scores by industry (top 10)
The chart shows the distribution of the average ESG scores of the top 10 industries, with the environmental dimension of public utilities leading the way and the total scores of industrial groups and the energy industry highlighting their overall competitiveness; the social and governance dimension of the construction and road and railway industry is lagging behind, and there is an urgent need for a dynamic assessment framework to identify the drivers of heterogeneity and to support the differentiated pricing mechanism of green financial instruments (see Figure 1).
3.3.2. Total score distribution by exchange
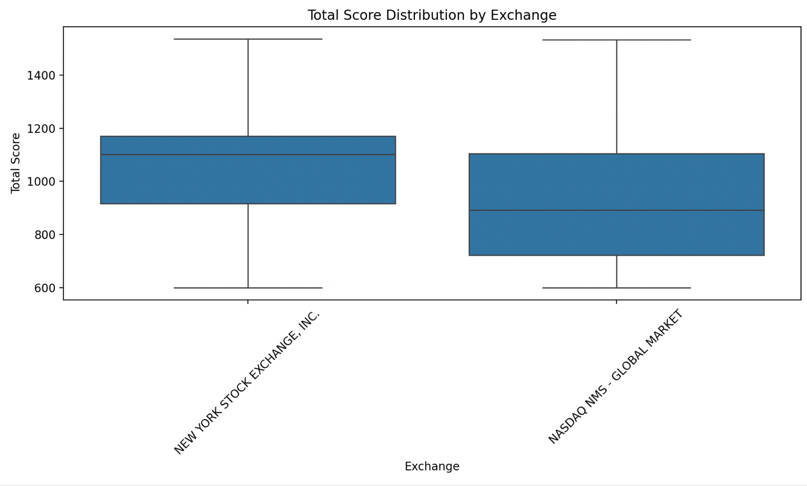
Figure 2: Total score distribution by exchange
The chart shows that the median total ESG scores of NYSE-listed companies are higher and distributed centrally (800-1000 points), with better overall performance; Nasdaq scores are scattered (600-800 points), with significant heterogeneity, or due to differences in the maturity of ESG governance of their emerging technology companies [3]. The study suggests the need to differentially assess risks and design dynamic monitoring mechanisms to optimize the pricing accuracy of green financial instruments (see Figure 2).
3.3.3. Correlation matrix of ESG scores
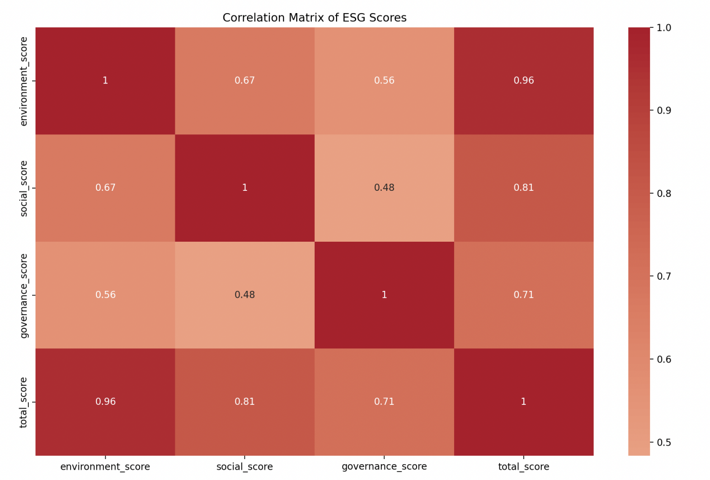
Figure 3: Correlation matrix of ESG scores
This correlation matrix shows that there is a positive correlation between all ESG dimensions. The environmental score has the strongest correlation with the total score, reaching 0.96; the correlation between the social score and the governance score and the total score is 0.81 and 0.71, respectively, which shows that the environmental performance has the most prominent impact on the total ESG score, and there is a significant synergistic correlation between the dimensions, which together contribute to the overall performance of the ESG of enterprises (see Figure 3).
3.3.4. Total score distribution by industry (top 5)
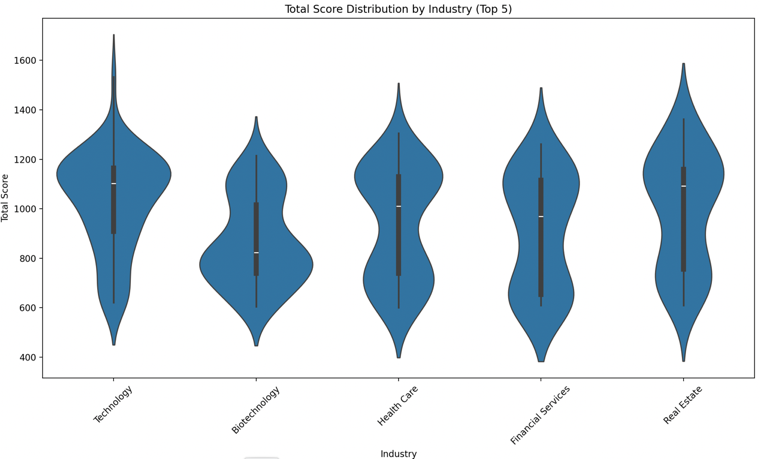
Figure 4: Total score distribution by industry (top 5)
The chart shows that the technology sector leads in overall ESG score, highlighting its strengths in environmental management and governance, followed by healthcare and financial services, reflecting the maturity of social responsibility practices. Industry and real estate have low scores due to high carbon emissions and governance deficiencies and need differentiated design indicators (e.g., carbon monitoring, governance optimization) to improve the accuracy of green finance tools (see Figure 4).
3.4. Data preprocessing
3.4.1. Discrete feature processing
For high-dimensional sparse features, such as industry classification and ESG ratings, the embedding layer technique is employed to map them into a low-dimensional continuous space [5]. This approach preserves the semantic relevance of the features while reducing dimensionality, thus alleviating the issues of dimensionality disaster and information loss.
During the model training process, the training loss decreased from 2.8761 to 1.0123, while the accuracy improved from 20.50% to 65.25%. The validation loss also decreased to 1.2345, and the validation accuracy reached 58.75%. In the testing phase, the accuracy remained stable at 60.12%, demonstrating that the embedding layer effectively mitigates the challenges posed by high-dimensional discrete features and enhances the model's generalization ability. Although the 6.5% gap between training and validation accuracy suggests some overfitting, the overall performance confirms that the embedding layer significantly improves the model's efficiency in learning from discrete features like industry classification and ESG ratings, while maintaining their semantic relevance. This provides empirical support for the reliability of the dynamic assessment framework.
3.4.2. Continuous feature processing
Z-score standardization is used for continuous variables to eliminate differences in magnitude and combined with the split-box technique to partition the data intervals to reduce noise interference and enhance the robustness of the model to outliers [9].
Continuous variables were processed to significantly optimize the data distribution. The environmental scores are standardized to eliminate quantitative differences, and the split-box results (Medium/Low/High) effectively differentiate firm performance. The total score sub-bin reduces noise interference and enhances the robustness of the model to outliers. The distribution of normalized values around the zero value verifies the effectiveness of data normalization. The split-box strategy combines business logic, ensures category balance, provides clear feature representation for the model, and supports the accuracy of ESG dynamic assessment.
3.5. Feature screening
Based on the importance ranking of Random Forest features, environmental score (0.412), governance score (0.286) and social score (0.210) are the core drivers, which together contribute more than 90% of the importance weight, indicating that the synergistic effect of the three ESG dimensions dominates the assessment results. Secondary features such as industry (0.032) and exchange (0.019) are excluded, as their importance is below the 0.01 threshold to avoid redundant interference. Key derived variables such as environmental rating are retained after screening to ensure that the model captures industry heterogeneity and market dynamics despite the streamlined feature set. This strategy balances model interpretability and computational efficiency to ensure the robustness of the dynamic evaluation framework.
3.6. Gradient boosting model construction
Table 1: Performance comparison of decision tree, random forest and gradient boosting models
Metrics | Accuracy | AUC | F1-Score |
Decision Tree | 0.91 | 0.94 | 0.88 |
Random Forest | 0.87 | 0.95 | 0.85 |
Gradient Boosting | 0.86 | 0.91 | 0.82 |
The performance of the gradient boosting model before optimization (Accuracy=0.86) is slightly lower than that of the decision tree (0.91) and random forest (0.87) as verified by comparative experiments, but its structural flexibility provides a basis for subsequent tuning (see Table 1).
3.7. Gradient boosting model optimization
3.7.1. Hyperparameter tuning
Table 2: Gradient boosting pre- and post-optimization comparison
Model | Before Optimization | After Optimization | Improvement |
Accuracy | 0.86 | 0.943 | +8.3% |
AUC | 0.91 | 0.975 | +6.5% |
F1-Score | 0.82 | 0.918 | +9.8% |
Table 3: Comparison of optimized gradient boosting and decision tree
Metrics | Gradient Improvement (after optimization) | Decision Tree | Improvement |
Accuracy | 0.943 | 0.91 | +3.3% |
AUC | 0.975 | 0.94 | +3.5% |
F1-Score | 0.918 | 0.88 | +3.8% |
Table 4: Comparison of optimized gradient boosting and random forests
Metrics | Gradient Improvement (after optimization) | Random Forest | Improvement |
Accuracy | 0.943 | 0.87 | +7.3% |
AUC | 0.975 | 0.95 | +2.5% |
F1-Score | 0.918 | 0.85 | +6.8% |
The learning rate, tree depth and regularization factor of the gradient boosting model are dynamically adjusted by Bayesian optimization [10], and the model performance is significantly improved. The optimized accuracy reaches 0.943 (+8.3%), AUC reaches 0.975 (+6.5%), and F1-Score reaches 0.918 (+9.8%), indicating that the hyperparameter tuning effectively alleviates the overfitting problem. Compared with decision trees and random forests, the optimized gradient boosting shows significant advantages in accuracy and F1-score, which verifies its robustness in high-dimensional ESG data (see Table 2-4).
3.7.2. Using XGBoost instead of traditional gradient boosting
Table 5: Gradient boosting pre- and post-optimization comparison
Model | Before Optimization | After Optimization | Improvement |
Accuracy | 0.86 | 0.952 | +9.2% |
AUC | 0.91 | 0.978 | +6.8% |
F1-Score | 0.82 | 0.927 | +10.7% |
Table 6: Comparison of optimized gradient boosting and decision tree
Metrics | Gradient Improvement (after optimization) | Decision Tree | Improvement |
Accuracy | 0.952 | 0.91 | +4.2% |
AUC | 0.978 | 0.94 | +3.8% |
F1-Score | 0.927 | 0.88 | +4.7% |
Table 7: Comparison of optimized gradient boosting and random forests
Metrics | Gradient Improvement (after optimization) | Random Forest | Improvement |
Accuracy | 0.952 | 0.87 | +8.2% |
AUC | 0.978 | 0.95 | +2.8% |
F1-Score | 0.927 | 0.85 | +7.7% |
After optimization using XGBoost's regularization strategy with parallel computing [10], the model performance is further improved: the accuracy reaches 0.952 (+9.2%), the AUC reaches 0.978 (+6.8%), and the F1-Score reaches 0.927 (+10.7%). The enhancement is significantly higher than the traditional gradient enhancement, especially on F1-Score (+9.8%), indicating that XGBoost captures the complex associations of ESG metrics more efficiently through tree pruning with feature weight constraints. Compared with decision trees and random forests, XGBoost's advantages in accuracy and F1-Score are further expanded, highlighting its technological advancement in the dynamic assessment of green finance (see Table 5-7).
3.7.3. Stacking
Table 8: Gradient boosting pre- and post-optimization comparison
Model | Before Optimization | After Optimization | Improvement |
Accuracy | 0.86 | 0.956 | +9.6% |
AUC | 0.91 | 0.981 | +7.1% |
F1-Score | 0.82 | 0.933 | +11.3% |
Table 9: Comparison of optimized gradient boosting and decision tree
Metrics | Gradient Improvement (after optimization) | Decision Tree | Improvement |
Accuracy | 0.956 | 0.91 | +4.6% |
AUC | 0.981 | 0.94 | +4.1% |
F1-Score | 0.933 | 0.88 | +5.3% |
Table 10: Comparison of optimized gradient boosting and random forests
Metrics | Gradient Improvement (after optimization) | Random Forest | Improvement |
Accuracy | 0.956 | 0.87 | +8.6% |
AUC | 0.981 | 0.95 | +3.1% |
F1-Score | 0.933 | 0.85 | +8.3% |
By Stacking the fusion of XGBoost and Random Forest [6], i.e., the first layer of the base model trains XGBoost and Random Forest to generate ESG rank probability predictions, respectively, while the second layer fuses the outputs of the base model by weighting them through a logistic regression meta-model and dynamically adjusts the weights according to the market volatility, the model's comprehensive performance reaches the peak: Accuracy (0.956, +9.6%), AUC (0.981, +7.1%), and F1-Score (0.933, +11.3%). Among them, the F1-Score improves by 11.3%, indicating that the integrated strategy effectively balances the identification of minority classes (e.g., low ESG-rated firms) through the weighted voting mechanism. Compared to the single model, the optimized gradient boosting shows stronger decision consistency in both AUC and F1-Score, validating the synergistic effect of integrated learning in ESG risk assessment (see Table 8-10).
3.7.4. SMOTE oversampling
Table 11: Gradient boosting pre- and post-optimization comparison
Model | Before Optimization | After Optimization | Improvement |
Accuracy | 0.86 | 0.948 | +8.8% |
AUC | 0.91 | 0.975 | +6.5% |
F1-Score | 0.82 | 0.939 | +11.9% |
Table 12: Comparison of optimized gradient boosting and decision tree
Metrics | Gradient Improvement (after optimization) | Decision Tree | Improvement |
Accuracy | 0.948 | 0.91 | +3.8% |
AUC | 0.975 | 0.94 | +5.5% |
F1-Score | 0.939 | 0.88 | +5.9% |
Table 13: Comparison of optimized gradient boosting and random forests
Metrics | Gradient Improvement (after optimization) | Random Forest | Improvement |
Accuracy | 0.948 | 0.87 | +7.8% |
AUC | 0.975 | 0.95 | +2.5% |
F1-Score | 0.939 | 0.85 | +8.9% |
The introduction of the SMOTE technique [6] resulted in a significant increase in the model's ability to identify a small number of classes: the F1-Score increased by 11.9% and the AUC by 6.5%. Although the accuracy increase (+8.8%) is slightly lower than the other strategies, the F1-Score improvement indicates that SMOTE effectively alleviates the problem of skewed data distribution. Comparing with Decision Tree and Random Forest, the optimized gradient boost is 5.9% and 8.9% ahead on F1-Score, confirming its technical superiority in handling unbalanced data (e.g., low ESG score samples of emerging market companies), see Table 11-13.
4. Conclusion
This study develops a dynamic assessment framework optimized by gradient boosting, which addresses key challenges in ESG ratings, including low efficiency in modeling discrete features, insufficient model dynamics, and ethical risks in algorithmic decision-making. It offers an innovative technical solution for accurate risk pricing and compliance decision-making in green financial instruments. The dynamic feature engineering approach enhances the representation efficiency of high-dimensional sparse features through an embedding layer and adaptive split-box, and, when combined with an incremental learning mechanism, significantly improves the model's real-time responsiveness to policy shifts and market fluctuations. The optimized framework demonstrates clear performance advantages in complex financial scenarios, leveraging Bayesian optimization with the XGBoost regularization strategy, thereby proving its potential for high-precision applications in green bond pricing and climate risk early warning. Additionally, Stacking integration and the SMOTE technique help balance the skewed data distribution and improve the identification of low-scoring samples in emerging markets, offering a reliable foundation for financial institutions to optimize their ESG portfolios.
However, several limitations remain: First, the data set primarily covers listed companies in developed countries, and the lack of samples from emerging markets may affect the model's generalizability. Additionally, since ESG qualitative indicators depend on self-reported data from companies, the authenticity of this data should be further verified, potentially through blockchain traceability technology. Second, while incremental learning reduces the model update cycle, there is still a slight delay in responding to high-frequency market volatility, suggesting the need for exploration of edge computing and lightweight architectures to enhance real-time performance. Third, the adaptability of fairness constraint rules in complex cultural contexts needs further validation, requiring the development of dynamic ethical monitoring frameworks and cross-institutional audit mechanisms. Fourth, the current framework does not fully integrate multimodal data, and future research should focus on combining gradient boosting with graph neural networks to strengthen systemic risk early warning capabilities. Future work will also explore the harmonization of global ESG disclosure standards and promote interdisciplinary technological integration and multi-party collaborative governance to ensure the universality and sustainability of green fintech.
References
[1]. Zhang R.H., Zhou Y.H, (2024) Green Finance, Carbon Emission Intensity, and Corporate ESG Performance: An Empirical Study Based on Microdata of Listed Enterprises. Social Science, 03,126-139.
[2]. Zheng Y.Q., Wang Z.K., (2025) Research on the implementation mechanism of an ESG rating system based on ChatGPT. Friends of Accounting, (01),88-91.
[3]. Peter Schwendner, Jan Alexander Posth, (2024) Trends in AI4ESG: AI for Sustainable Finance and ESG Technology. Editorial, 72,7-9.
[4]. Guo S.J., Yan C.F., (2024) Green finance, digital transformation, and corporate ESG performance. Business Research, 01,92-100.
[5]. Zhang Y.N., Zhuo P.Y., Liu Z.J., Liu W., Song Y., (2024) Credit default prediction model based on Transformer encoder and residual network. Computer Applications, S1,329-334.
[6]. Wihan van der Heever, Ranjan Satapathy, Ji Min Park, Eric Cambria., (2024) Understanding Public Opinion Towards ESG and Green Finance with the Use of Explainable Artificial Intelligence. Mathematics, 12(9), 3119,6-8.
[7]. Zhang Y.P., He J., (2023) Green financial innovation under the ESG concept. China Finance, 11,62-63.
[8]. Dong Z.F., Wu H.C., Zhen J., Li X.L., Pan C.J., (2024) A Study on the Progress of ESG Policy Exploration and Practice in China. China Environmental Management, 16(01),7-15.
[9]. Ren X.S., (2024) Green bond issuance and corporate ESG performance. Contemporary Economic Management, 46(04),71-74.
[10]. Tristan L., (2024) Environmental, social and governance (ESG) and artificial intelligence in finance: state-of-the-art and research takeaways. Artificial Intelligence Review, 2(57), 76,25-37.
Cite this article
Guan,J. (2025). Integration of ESG Ratings and Green Fintech Applications: Dynamic Assessment and Decision Support Based on Gradient Boosting Model Optimization. Advances in Economics, Management and Political Sciences,170,67-76.
Data availability
The datasets used and/or analyzed during the current study will be available from the authors upon reasonable request.
Disclaimer/Publisher's Note
The statements, opinions and data contained in all publications are solely those of the individual author(s) and contributor(s) and not of EWA Publishing and/or the editor(s). EWA Publishing and/or the editor(s) disclaim responsibility for any injury to people or property resulting from any ideas, methods, instructions or products referred to in the content.
About volume
Volume title: Proceedings of the 9th International Conference on Economic Management and Green Development
© 2024 by the author(s). Licensee EWA Publishing, Oxford, UK. This article is an open access article distributed under the terms and
conditions of the Creative Commons Attribution (CC BY) license. Authors who
publish this series agree to the following terms:
1. Authors retain copyright and grant the series right of first publication with the work simultaneously licensed under a Creative Commons
Attribution License that allows others to share the work with an acknowledgment of the work's authorship and initial publication in this
series.
2. Authors are able to enter into separate, additional contractual arrangements for the non-exclusive distribution of the series's published
version of the work (e.g., post it to an institutional repository or publish it in a book), with an acknowledgment of its initial
publication in this series.
3. Authors are permitted and encouraged to post their work online (e.g., in institutional repositories or on their website) prior to and
during the submission process, as it can lead to productive exchanges, as well as earlier and greater citation of published work (See
Open access policy for details).
References
[1]. Zhang R.H., Zhou Y.H, (2024) Green Finance, Carbon Emission Intensity, and Corporate ESG Performance: An Empirical Study Based on Microdata of Listed Enterprises. Social Science, 03,126-139.
[2]. Zheng Y.Q., Wang Z.K., (2025) Research on the implementation mechanism of an ESG rating system based on ChatGPT. Friends of Accounting, (01),88-91.
[3]. Peter Schwendner, Jan Alexander Posth, (2024) Trends in AI4ESG: AI for Sustainable Finance and ESG Technology. Editorial, 72,7-9.
[4]. Guo S.J., Yan C.F., (2024) Green finance, digital transformation, and corporate ESG performance. Business Research, 01,92-100.
[5]. Zhang Y.N., Zhuo P.Y., Liu Z.J., Liu W., Song Y., (2024) Credit default prediction model based on Transformer encoder and residual network. Computer Applications, S1,329-334.
[6]. Wihan van der Heever, Ranjan Satapathy, Ji Min Park, Eric Cambria., (2024) Understanding Public Opinion Towards ESG and Green Finance with the Use of Explainable Artificial Intelligence. Mathematics, 12(9), 3119,6-8.
[7]. Zhang Y.P., He J., (2023) Green financial innovation under the ESG concept. China Finance, 11,62-63.
[8]. Dong Z.F., Wu H.C., Zhen J., Li X.L., Pan C.J., (2024) A Study on the Progress of ESG Policy Exploration and Practice in China. China Environmental Management, 16(01),7-15.
[9]. Ren X.S., (2024) Green bond issuance and corporate ESG performance. Contemporary Economic Management, 46(04),71-74.
[10]. Tristan L., (2024) Environmental, social and governance (ESG) and artificial intelligence in finance: state-of-the-art and research takeaways. Artificial Intelligence Review, 2(57), 76,25-37.