1. Introduction
Credit card fraud has emerged as a critical issue in the digital finance landscape, causing substantial economic losses and eroding consumer trust. In the dynamic environment of financial crime investigation, the strategies adopted by fraudsters are constantly evolving, which requires continuous improvement of analytical methods [1]. In recent years, with the rapid development of Internet technology, the number of credit card users has increased significantly. Subsequently, credit card fraud caused significant economic losses to individual users and related financial enterprises [2]. Global annual losses from credit card fraud exceed $30 billion, with financial institutions bearing the brunt of direct costs and reputational risks. No matter how much loss fraud causes, people are likely to be psychologically affected [3]. Due to various reasons, the reporting rate of consumer fraud (excluding identity fraud) is very low [4].
This study addresses the research questions: What specific machine - learning models, when combined with visual analytics, can most accurately classify fraudulent transactions using a dataset with 15 features (encompassing transaction details, customer information, and a binary fraud indicator)? How do these integrated approaches effectively mitigate fraud risks and enhance transaction security?
The contribution lies in providing a rigorous, practical framework for financial institutions. By systematically comparing multiple classification models and leveraging visual analytics, this research not only offers a novel approach to accurately identify fraudulent transactions but also enables institutions to proactively enhance transaction security and restore customer trust.
2. Machine learning models and performance comparison
For binary classification, four distinct models were put to the test. Logistic Regression, a linear model, excels in interpreting class probabilities, making it a valuable tool for understanding the likelihood of an instance belonging to a particular class. The Support Vector Machine (SVM) proves effective when dealing with high-dimensional data, but it has a drawback in being quite sensitive to class imbalance, which can impact its performance. Naive Bayes, a probabilistic model, operates under the assumption of feature independence. This characteristic makes it robust when working with small datasets. Finally, the Random Forest stands out as an ensemble method that combines multiple decision trees. It is highly resistant to overfitting and is well-equipped to handle non-linear relationships within the data, offering a comprehensive approach to binary classification.
2.1. Evaluation metrics
Performance was measured using accuracy, precision, recall, and F1-score (Table 1). The random forest model outperformed others with 98.26% accuracy, 97.8% precision, and 98.5% recall, indicating strong ability to identify both legitimate and fraudulent transactions. SVM showed lower precision (92.3%) due to misclassifying positive samples, while logistic regression and naive Bayes offered balanced but less robust performance.
2.2. Random forest advantages
The superiority of the random forest model can be attributed to several key aspects. Firstly, bootstrap sampling plays a crucial role. By training individual trees on random subsets of the data, it effectively reduces the variance of the overall model. Secondly, the feature randomness mechanism, which involves selecting random subsets of features at each node during the tree - building process, further enhances the diversity among the trees in the forest. This diversity contributes to better generalization. Additionally, the random forest model demonstrates remarkable robustness. It is insensitive to outliers and, when combined with the Synthetic Minority Over-sampling Technique (SMOTE), can handle imbalanced data effectively.
3. Basic data source analysis
This dataset contains credit card transactions from the western United States. It has 14446 entries and 15 columns. It includes various information about each transaction, which can be roughly divided into several types: transaction details: transaction amount, transaction date and time, indicating the exact date and time when the transaction occurred. Customer information: Customer city, customer status, customer latitude and longitude (geographic coordinates displaying the customer's location), customer date of birth (can be used to infer their age). Fraud indicator: A binary indicator (0 or 1) that displays whether a transaction is fraudulent (see Table 1).
Table 1: Credit card transaction dataset structure
Data Name | Data type | |
1 | Trans_date_trans_time | Object |
2 | Merchant | Object |
3 | Category | Object |
4 | Amt | Float64 |
5 | Trans_num | Object |
6 | City | Object |
7 | State | Object |
8 | Lat | Float64 |
9 | Long | Float64 |
10 | Merch_lat | Float64 |
11 | Merch_long | Float64 |
12 | City_pop | Int64 |
13 | Job | Object |
14 | Dob | Object |
15 | Is fraud | Object |
4. Visual result analysis
In recent years, both credit card usage and fraudulent activities have significantly increased [5]. Fraud detection has always been a major challenge faced by society, especially in the fields of banking, insurance, and healthcare. As more and more people use credit cards for payments, the fraud rate is also on the rise [6]. Visualize different features using charts and graphs to identify patterns and relationships between features, helping to understand their impact on the dataset. Tools such as scatter plots, bar charts, partition statistics, histograms, and violin plots are used to identify distributions that affect data behavior. Consumers still face many challenges in terms of the level of credit card usage. The spread and adoption of credit cards for online purchases are influenced by certain factors that affect customer consumption behavior [7].
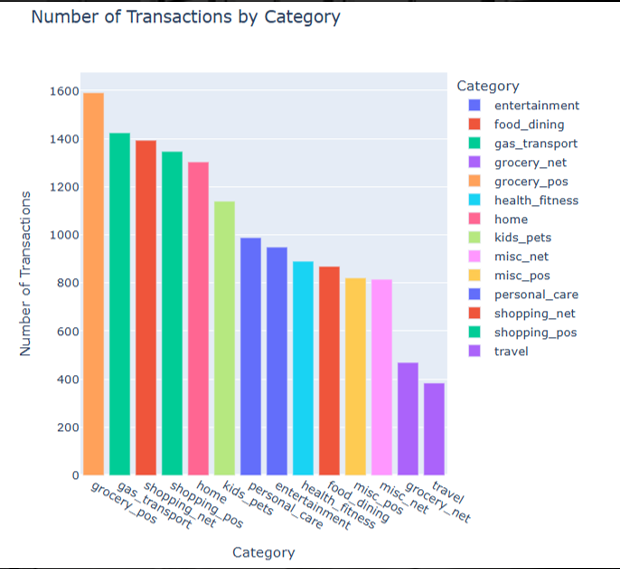
Figure 1: Number of transactions by category
This is a bar chart titled 'Number of Transactions by Category', displaying the number of credit card transactions for different transaction categories. The horizontal axis represents the transaction category, such as "grocery_pos" and "gas_transport"; The vertical axis represents the number of transactions. Different colors correspond to different categories, with "grocery_pos" having the highest transaction volume, while "travel" and "grocery_net" have relatively low transaction volumes.
Categories with high transaction volumes such as "grocery_pos" and "shopping_net" have become the focus of fraudsters due to their frequent transactions and large cash flow. Many transactions means that fraudsters have more opportunities to infiltrate illegal transactions, and small-scale high-frequency fraud is not easily detected by consumers and merchants immediately. Fraudsters may believe that the cost of fraud is low and the potential benefits are high in such transactions. Categories with low transaction volumes such as "travel" and "grocery_net" have relatively low fraud risks. On the one hand, the transaction frequency is low and there are few opportunities for fraud; On the other hand, such transactions often involve large amounts, and the verification process during the transaction may be stricter, increasing the difficulty of fraud. But it cannot be ruled out that fraudsters carefully plan fraudulent activities targeting such low-frequency high-value transactions, and once successful, the profits are also relatively lucrative (see Figure 1).
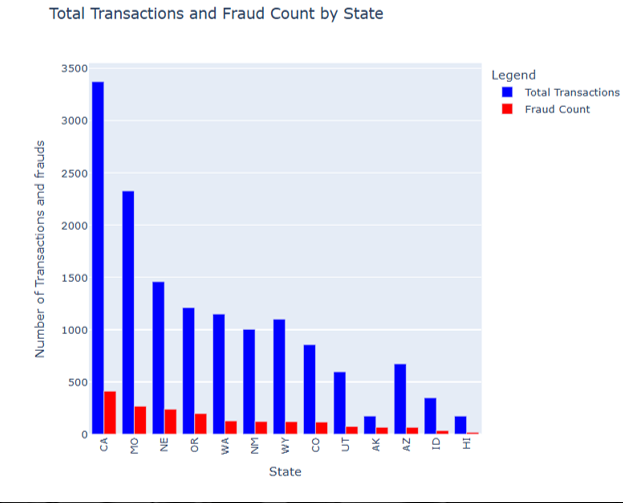
Figure 2: Total transactions and fraud count by state
This is a bar chart titled 'Total Transactions and Fraud Count by State', showing the total number of credit card transactions and fraud in different states. The horizontal axis represents different states, including CA, MO, NE, etc; The vertical axis represents the number of transactions and fraud. The blue column represents the total transaction quantity, and the red column represents the fraud quantity. The total number of transactions and fraud in CA state is relatively high among all states, while there are differences in the total number of transactions and fraud in other states. Overall, the total number of transactions is generally higher than the number of frauds.
States with a high total transaction volume, such as CA state, typically have larger economies, active commercial activities, and frequent market transactions. This means that there are more business opportunities in the state, and the degree of participation of businesses and consumers in economic activities is high. From a fraud perspective, many transactions also provide fraudsters with more potential targets. Fraudsters believe that committing fraud in economically active and high trading areas has a higher chance of successful profit, as there are more transactions and fraudulent behavior is more likely to mix in and not easily detected in a timely manner (see Figure 2).
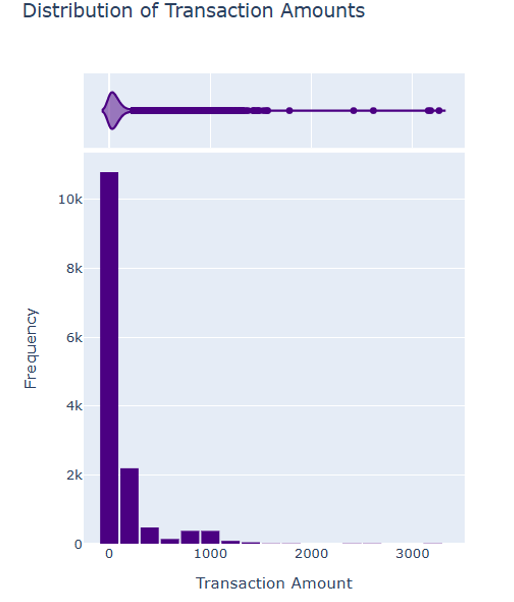
Figure 3: Distribution of transaction amounts
This is a chart displaying the distribution of credit card transaction amounts, titled 'Distribution of Transaction Amounts'. The horizontal axis represents the transaction amount, and the vertical axis represents the frequency. The chart is presented as a combination of a box plot and a bar chart. From the bar chart, the transaction amount is concentrated around 0, and as the transaction amount increases, the frequency rapidly decreases. The frequency of transactions above 1000 is extremely low. The box plot also shows that the data is mainly concentrated in the low value area on the left (see Figure 3).
The concentration of transaction amounts in the low range indicates that many credit card transactions are small-scale transactions. Fraudsters tend to exploit this characteristic to carry out small-scale high-frequency fraud. The cost of small-scale fraud is relatively low, and the risk of being discovered and pursued is small. However, they can accumulate illegal gains through multiple operations. The frequency of high-value transactions is extremely low, and for fraudsters, although the potential benefits of implementing large-scale fraud are high, the difficulty and risk are also high.

Figure 4: Age of fraud victims by transaction date
This is a scatter plot titled 'Age of Fraud Victims by Transaction Date', showing the age distribution of credit card fraud victims on different transaction dates . The horizontal axis represents the transaction date, from January 1, 2019 to January 1, 2021; The vertical axis represents the age of the victim. Scattered colors represent different ages, with a yellowish color indicating older age and a purple color indicating younger age. The scatter distribution shows that there are fraud victims of different ages at different times, and overall, each age group is distributed on different transaction dates (see Figure 4).
All other factors remaining constant, elderly people are generally more likely to suffer from fraud [8]. Middle aged and elderly people (scattered in yellow) have uneven financial literacy, and some have limited understanding of complex financial products and new forms of fraud. Some fraudsters specifically design scams targeting middle-aged and elderly people, such as inducing false projects in investment and financial management, health preservation, etc., and using their needs for wealth appreciation and health protection to commit fraud. Once middle-aged and elderly people are deceived, not only will their personal property be damaged, but it may also affect their family's economic situation, and even lead to the unreasonable occupation of social pension security resources, affecting economic stability. Young people (scattered in purple) usually have a strong ability to accept emerging technologies and financial knowledge, and are more familiar with credit card security and fraud prevention methods. They can better protect personal information and identify common fraud methods, so they are relatively less affected by fraud during certain periods of time.
Credit cards have different characteristics compared to traditional fraud, Traditional fraud scenarios are mostly offline, such as street scams, face-to-face contract scams, etc. The types of transactions are not fixed and may involve various goods, services, or assets. Fraudsters often deceive through direct contact, false promises, and other means. From the chart 'Fraud Count by Product Category', it can be inferred that credit card fraud is highly prevalent in categories such as' grocery_pos' and 'shopping_net', and is concentrated in online and offline shopping consumption scenarios. As a payment tool, credit cards are exploited by fraudsters to commit fraudulent activities such as fraud and false transactions during shopping transactions, taking advantage of loopholes in the payment systems of e-commerce platforms or physical merchants to achieve their goals. Traditional fraud mainly relies on the fraudster's language skills, forgery of documents and other simple means, with relatively low technical content. For example, using sweet words to gain trust or forging IOUs to commit fraud. Credit card fraud often involves higher technological means. Fraudsters may use network technology to steal credit card information, such as obtaining cardholder information through hacker attacks, or exploiting payment system vulnerabilities for cardless transaction fraud; It is also possible to use counterfeit credit cards for transactions, which involves card duplication technology, etc.
5. Main methods for predicting credit card fraud
In today's era, artificial intelligence is redefining the boundaries of financial markets based on state-of-the-art machine learning and deep learning algorithms [9]. So, we can predict the fraud risk of credit cards through different machine learning models, and this article mainly uses the random forest model. Random forest is an algorithm grounded in ensemble learning concepts. Its main approach to enhancing a model's accuracy and stability involves building numerous decision trees. It then combines the prediction outcomes from these individual decision trees. This way, the overall performance of the model is significantly improved. Collect a large amount of credit card transaction data, which should include various transaction characteristics such as transaction time, transaction amount, transaction location, merchant type, and need to have labeled information, that is, whether the transaction is a fraudulent transaction. Handle missing values and outliers in data. For example, for transaction amounts that are negative or abnormally large, they need to be checked and corrected; For missing transaction location information, appropriate methods can be used to fill in, such as mean filling and mode filling. After processing, there are no missing values in the data.
Build a random forest model and use a self-sampling method to randomly extract multiple subsets from the training set, with each subset used to train a decision tree. This makes the training data for each decision tree slightly different, increasing the diversity of the model. When creating each node of every decision tree, pick a random subset of features. For this randomly chosen subset of features, apply the decision tree algorithm to train a decision tree. By doing so, we build a decision tree using only the features within that subset. This process helps in the construction of multiple decision trees which are then combined, as seen in algorithms like the random forest algorithm. The decision tree divides the dataset into different subsets by continuously partitioning the features. Prediction: For new credit card transaction data, it is input into each decision tree in the random forest. Each decision tree predicts whether the transaction is a fraudulent transaction based on its own rules and outputs a prediction result (usually 0 for normal transactions and 1 for fraudulent transactions).
5.1. Different machine models predict data performance indicators
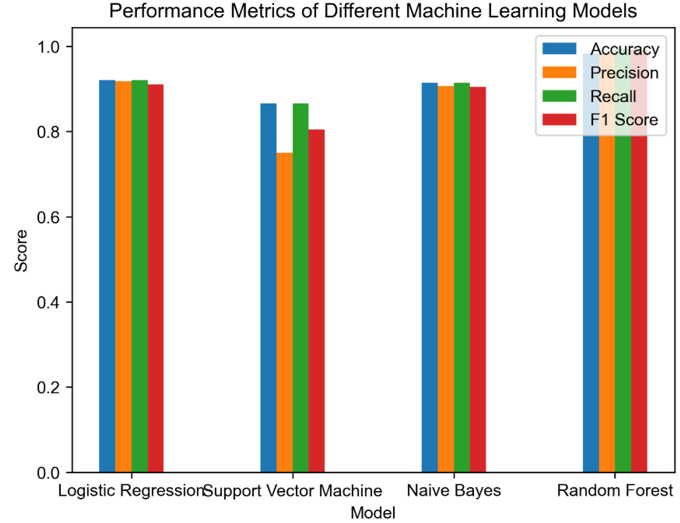
Figure 5: Performance metrics of different machine learning models
From the comparison of model performance, logistic regression model and naive Bayes model are very similar, and their models are both at a relatively high level. However, compared to other models, the accuracy of support vector machine models is lower because there may be more false positives when identifying real samples, leading to a decrease in accuracy. The best one is the random forest model, which leads in both accuracy and recall, and has a high F1 score. It even successfully predicted score trading with an accuracy of 98.26% (see Figure 5).
6. Discussion
The study confirms that credit card fraud differs from traditional fraud in its reliance on technical means (e.g., data theft, payment system exploitation) and concentration in high-frequency, low-value transactions. Visual analytics effectively identify risky categories (e.g., "grocery_pos") and demographics (mid-to-older adults), guiding targeted fraud prevention strategies.
While the random forest model excels in accuracy, challenges remain, such as real-time processing of large transaction volumes and adapting to evolving fraud patterns. Future research could integrate deep learning (e.g., LSTM for time-series analysis) and graph neural networks to detect fraud networks, enhancing proactive risk management [10].
7. Conclusion
With the development of technology, fraud detection has become increasingly important. On the one hand, the number of sub transactions in various business environments is constantly increasing, and on the other hand, the development of software and technology has led to a positive increase in electronic crime. Authentication methods are no longer the only way to prevent fraud. This research presents a data-driven approach to credit card fraud detection, combining visual analytics and machine learning to identify critical patterns and classify transactions accurately. The random forest model, with its robust performance, provides a practical solution for financial institutions to reduce losses and improve security. By leveraging multi-dimensional data and advanced models, the framework supports real-time fraud monitoring and contributes to the resilience of digital payment systems.The analysis project is based on integrated models such as decision trees and random forests, combined with SMOTE oversampling technology to solve the problem of highly imbalanced data. Key behavioral patterns such as transaction time, amount, and geographic location are extracted through feature engineering, and the model parameters are optimized using grid search to provide high-precision and low latency real-time fraud detection capabilities for risk control systems, effectively reducing losses for financial institutions.
The prospects of credit card fraud analysis projects are full of opportunities and challenges. In the future, the project will introduce multi-dimensional third-party data to build a more three-dimensional user profile and accurately identify fraudulent behavior. By continuously optimizing and improving the model, cross institutional data fusion can be achieved while ensuring data privacy, and potential risks can be explored. In addition, with the help of graph neural networks, in-depth analysis of user relationship networks can effectively identify fraudulent groups. The project will continue to optimize the model, combine real-time monitoring and dynamic adjustment strategies, comprehensively improve the level of credit card risk prevention and control, and safeguard financial security.
Acknowledgements
The authors thank Mr. Huang and Ms. Tan for their guidance and support throughout the project. Special thanks to the financial institution that provided the dataset for analysis.
Authors contribution
All the authors contributed equally and their names were listed in alphabetical order.
References
[1]. Jiang, S.S., et al., (2023) Credit Card Fraud Detection Based on Unsupervised Attentional Anomaly Detection Network. Systems, 11, 305. Retrieved from www.mdpi.com/2079-8954/11/6/305, https://doi.org/10.3390/systems11060305. Accessed 28 June 2023.
[2]. Alashwali, E., Chandrashekar, R. M., Lanyon, M., Cranor, L. F., (2024) Detection and Impact of Debit/Credit Card Fraud: Victims’ experiences. arXiv (Cornell University). Retrieved from https://doi.org/10.48550/arxiv.2408.08131
[3]. Button, Mark, et al, (2024). Online Frauds: Learning from Victims Why They Fall for These Scams. Australian & New Zealand Journal of Criminology, 47, 391–408, Retrieved from https://doi.org/10.1177/0004865814521224.
[4]. Breskuvienė, D., Gintautas D., (2024) Enhancing Credit Card Fraud Detection: Highly Imbalanced Data Case. Journal of Big Data, 11, 28-32. Retrieved from https://doi.org/10.1186/s40537-024-01059-5.
[5]. Zhang, Y.T., (2023) Root Cause Analysis of Credit Card Fraud. Advances in Economics Management and Political Sciences, 24, 300–310. Retrieved from https://doi.org/10.54254/2754-1169/24/20230454. Accessed 17 Mar. 2025.
[6]. Pundkar, Sumedh N., Mohd Z.i., (2023) Credit Card Fraud Detection Methods: A Review. E3S Web of Conferences, 453, 01015–01015. Retrieved from https://doi.org/10.1051/e3sconf/202345301015. Accessed 31 Jan. 2024.
[7]. Sishany, A., (2022) Mallak Al-Bashrah. Perceptual Exploration of Credit Cards’ Adoption: Customer Perspective. International Journal of Data and Network Science, 4, 407–416. Retrieved from https://doi.org/10.5267/j.ijdns.2020.x.003. Accessed 1 Aug. 2022.
[8]. Kemp, Steven, Nieves Erades P., (2023) Consumer Fraud against Older Adults in Digital Society: Examining Victimization and Its Impact. International Journal of Environmental Research and Public Health, 20, 5404. Retrieved from https://doi.org/10.3390/ijerph20075404.
[9]. Sonkavde, Gaurang, et al, (2023). Forecasting Stock Market Prices Using Machine Learning and Deep Learning Models: A Systematic Review, Performance Analysis and Discussion of Implications. International Journal of Financial Studies, 11, 94. Retrieved from www.mdpi.com/2227-7072/11/3/94, https://doi.org/10.3390/ijfs11030094.
[10]. Vynokurova, Olena, et al., (2021) Hybrid Machine Learning System for Solving Fraud Detection Tasks. IEEE Xplore, 1, 20-23. Retrieved from ieeexplore.ieee.org/abstract/document/9204244/.
Cite this article
Chen,Z.;Zhang,Z. (2025). Exploring the Intricacies of Credit Card Fraud. Advances in Economics, Management and Political Sciences,170,29-37.
Data availability
The datasets used and/or analyzed during the current study will be available from the authors upon reasonable request.
Disclaimer/Publisher's Note
The statements, opinions and data contained in all publications are solely those of the individual author(s) and contributor(s) and not of EWA Publishing and/or the editor(s). EWA Publishing and/or the editor(s) disclaim responsibility for any injury to people or property resulting from any ideas, methods, instructions or products referred to in the content.
About volume
Volume title: Proceedings of the 9th International Conference on Economic Management and Green Development
© 2024 by the author(s). Licensee EWA Publishing, Oxford, UK. This article is an open access article distributed under the terms and
conditions of the Creative Commons Attribution (CC BY) license. Authors who
publish this series agree to the following terms:
1. Authors retain copyright and grant the series right of first publication with the work simultaneously licensed under a Creative Commons
Attribution License that allows others to share the work with an acknowledgment of the work's authorship and initial publication in this
series.
2. Authors are able to enter into separate, additional contractual arrangements for the non-exclusive distribution of the series's published
version of the work (e.g., post it to an institutional repository or publish it in a book), with an acknowledgment of its initial
publication in this series.
3. Authors are permitted and encouraged to post their work online (e.g., in institutional repositories or on their website) prior to and
during the submission process, as it can lead to productive exchanges, as well as earlier and greater citation of published work (See
Open access policy for details).
References
[1]. Jiang, S.S., et al., (2023) Credit Card Fraud Detection Based on Unsupervised Attentional Anomaly Detection Network. Systems, 11, 305. Retrieved from www.mdpi.com/2079-8954/11/6/305, https://doi.org/10.3390/systems11060305. Accessed 28 June 2023.
[2]. Alashwali, E., Chandrashekar, R. M., Lanyon, M., Cranor, L. F., (2024) Detection and Impact of Debit/Credit Card Fraud: Victims’ experiences. arXiv (Cornell University). Retrieved from https://doi.org/10.48550/arxiv.2408.08131
[3]. Button, Mark, et al, (2024). Online Frauds: Learning from Victims Why They Fall for These Scams. Australian & New Zealand Journal of Criminology, 47, 391–408, Retrieved from https://doi.org/10.1177/0004865814521224.
[4]. Breskuvienė, D., Gintautas D., (2024) Enhancing Credit Card Fraud Detection: Highly Imbalanced Data Case. Journal of Big Data, 11, 28-32. Retrieved from https://doi.org/10.1186/s40537-024-01059-5.
[5]. Zhang, Y.T., (2023) Root Cause Analysis of Credit Card Fraud. Advances in Economics Management and Political Sciences, 24, 300–310. Retrieved from https://doi.org/10.54254/2754-1169/24/20230454. Accessed 17 Mar. 2025.
[6]. Pundkar, Sumedh N., Mohd Z.i., (2023) Credit Card Fraud Detection Methods: A Review. E3S Web of Conferences, 453, 01015–01015. Retrieved from https://doi.org/10.1051/e3sconf/202345301015. Accessed 31 Jan. 2024.
[7]. Sishany, A., (2022) Mallak Al-Bashrah. Perceptual Exploration of Credit Cards’ Adoption: Customer Perspective. International Journal of Data and Network Science, 4, 407–416. Retrieved from https://doi.org/10.5267/j.ijdns.2020.x.003. Accessed 1 Aug. 2022.
[8]. Kemp, Steven, Nieves Erades P., (2023) Consumer Fraud against Older Adults in Digital Society: Examining Victimization and Its Impact. International Journal of Environmental Research and Public Health, 20, 5404. Retrieved from https://doi.org/10.3390/ijerph20075404.
[9]. Sonkavde, Gaurang, et al, (2023). Forecasting Stock Market Prices Using Machine Learning and Deep Learning Models: A Systematic Review, Performance Analysis and Discussion of Implications. International Journal of Financial Studies, 11, 94. Retrieved from www.mdpi.com/2227-7072/11/3/94, https://doi.org/10.3390/ijfs11030094.
[10]. Vynokurova, Olena, et al., (2021) Hybrid Machine Learning System for Solving Fraud Detection Tasks. IEEE Xplore, 1, 20-23. Retrieved from ieeexplore.ieee.org/abstract/document/9204244/.


