


1. Introduction
With the continuous development of financial markets, stock trading has become increasingly active. However, traditional forecasting methods struggle to effectively capture the complex patterns of stock price fluctuations. Therefore, predicting stock prices more accurately has become an important topic in financial research.
The stock market is well-funded, with a large base of investors. Stock price prediction can assist investors in optimizing decisions and reducing risks, while also providing critical information for financial institutions’ asset allocation and policymakers’ market regulation. It has wide applications across multiple areas in finance. Given this, this paper proposes the use of the Backpropagation Neural Network (BPNN) model for stock price prediction, providing more decision-making support for investors or financial institutions.
This paper is structured into five sections. The next section briefly reviews existing research on stock price movements and the application of neural network models in stock price prediction. Following the description of our data and research methodology in the third section, the fourth section presents the analysis results. Finally, the reasons behind the results will be explored, and conclusions will be drawn.
2. Literature review
Stock price prediction has long been a hot topic in financial research. With technological iteration and model innovation, related studies have gradually evolved from basic neural networks to multi-technology integration. Cao et al. [1] first demonstrated the advantages of Artificial Neural Networks (ANN) in nonlinear prediction using data from the Chinese A-share market (1999–2008), with the Mean Absolute Deviation (MAD), Mean Absolute Percentage Error (MAPE), and Mean Squared Error (MSE) all significantly lower than those of linear models. Subsequently, Principal Component Analysis (PCA) was introduced to optimize model performance. For instance, Shi and Liu [2] proposed the PCA-Elman model, using empirical data from the Baotou Steel stock price (2013–2014). The results showed that its MSE was superior to both the BP and basic Elman networks, although the optimization of the hidden layer neurons remained unresolved. Zahedi and Rounaghi [3] further combined ANN with PCA, applying it to data from the Tehran Stock Exchange (2006–2012) to achieve dimensionality reduction while maintaining a high goodness of fit (R²=0.99). However, they also pointed out that PCA has limitations in its applicability to nonlinear data. Gao et al. [4] built a prediction system based on data from the S&P 500 Index (2004–2016) by combining Deep Belief Networks (DBNs) with two-dimensional PCA ((2D)²PCA), achieving better MAE and RMSE compared to traditional BP networks, thus validating the advantages of deep architectures.
After 2017, hybrid models became a trend. For example, Yu et al. [5] proposed the LLE-BP model, using stock data from Pingtan Development (2016–2017) to validate the dimensionality reduction advantages of Locally Linear Embedding (LLE) in nonlinear data. Their RMSE and MAE were significantly better than the PCA-BP and ARIMA models. Dong and Zhao [6] combined the fractional-order grey model with BP neural networks (FGMC(1,m)-BP) to achieve comprehensive optimization of MAE, RMSE, and MAPE in Chinese stock data, highlighting the effectiveness of complex time series modeling. Bui and Huynh [7] integrated Long Short-Term Memory (LSTM) RNN with the Fama-French Five-Factor model, using data from the Ho Chi Minh City Stock Exchange (2010–2022) to demonstrate that their RMSE was lower than the Maximum Likelihood Estimation (MLE) method, showing the potential of deep learning in factor investing. In the same year, Zhao et al. [8] constructed a unified time series relationship multi-factor model (TRMF) based on Graph Convolutional Networks (GCN), using data from the S&P 500 constituents (2018–2019) to extract industry-related features. Their Information Ratio (IRR) and Sharpe Ratio (SR) were superior to the Attn-LSTM model. In 2023, Wang et al. [9] proposed the PCA-IGRU model, which improved training efficiency and accuracy (R², DS) through enhanced Gated Recurrent Units.
Recent research, such as the Factor-GAN model proposed by Wang and Chen [10], optimized factor investing through a Generative Adversarial Network framework using Chinese A-share data (2002–2020). Their monthly errors and long-short returns significantly outperformed traditional models. Sarıkoç and Celik [11] designed the PCA-ICA-LSTM model, which achieved an R² of 0.96 in S&P 500 predictions (2000–2017). After adjusting for pandemic parameters, their strategy’s return rate increased by over 220%, demonstrating robustness in extreme market conditions.
3. Methodology
This paper collects daily data on opening price, closing price, lowest and highest prices, and trading volume from various securities markets in the Kaggle database. A multivariate time series forecasting model is built based on the Backpropagation Neural Network (BPNN) to explore the nonlinear mapping relationship between historical stock market data and the next day’s closing price. The specific steps are as follows:
1. Research Design and Experimental Framework
To verify the impact of data time span on the model’s prediction performance, two sets of comparative experiments were designed using the control variable method:
Experimental Group 1: The input features are the opening price, closing price, highest price, and lowest price from May 28, 2019, to May 27, 2021 (two years) for each stock market, with the goal of predicting the next day’s closing price.
Experimental Group 2: Based on Experimental Group 1, this group expands the data time span to include historical data from May 28, 2018, while keeping the input features and model structure unchanged. The impact of the change in data scale on prediction accuracy is analyzed.
By fixing hyperparameters (learning rate, number of iterations (epochs), and neural network structure), and controlling other variables except for the data volume, the focus is placed on the impact mechanism of time span variation on prediction error.
2. Data Preprocessing and Feature Engineering
Data Cleaning: The Pandas library is used to remove invalid samples containing null values, ensuring data integrity.
Normalization: The MinMaxScaler is used to scale the input features to the range [0, 1], eliminating the interference caused by dimensional differences in model training. The formula is as follows:
\( {X_{norm}}=\frac{X-{X_{min}}}{{X_{max}}-{X_{min}}} \) (1)
Dataset Division: The dataset is divided into training and test sets in chronological order. Both experimental groups use a 4:1 ratio for training set to test set, which helps retain the temporal dependency features of stock data.
3. Model Construction and Training
Network Structure Design: A three-layer BPNN network structure is constructed. The input layer has nodes corresponding to the four features (opening price, closing price, highest price, lowest price). The number of neurons in the hidden layer is set differently for different stock markets. The output layer has one node that directly maps to the next day’s closing price.
Optimization Algorithm: Mini-batch stochastic gradient descent (MSGD) is used to update weights and biases through full-batch training (mini_batch_size = training set length). The loss function is defined as Mean Squared Error (MSE):
\( MSE=\frac{1}{n}\sum _{i=1}^{n}{({y_{i}}-{\hat{y}_{i}})^{2}} \) (2)
Backpropagation Mechanism: The gradient is calculated through the chain rule [12]. The error in the output layer is directly represented by the difference between the predicted value and the true value. The error in the hidden layer is propagated backward through the weight matrix and multiplied by the derivative of the Sigmoid activation function, achieving efficient parameter updates.
4. Evaluation Metrics and Result Analysis
To better quantify the model performance, the following four metrics are used in this study:
MSE: Measures the squared error between the predicted and true stock prices.
MAE: Measures the absolute error between the predicted and true stock prices, reflecting the degree of deviation between the predicted and actual values. The formula is as follows:
\( MAE=\frac{1}{n}\sum _{i=1}^{n}|{y_{i}}-{\hat{y}_{i}}| \) (3)
R²: Assesses the explanatory power of the prediction model for the variation in the dependent variable. The formula is as follows:
\( {R^{2}}=1-\frac{\sum _{i=1}^{n}{({y_{i}}-{\hat{y}_{i}})^{2}}}{\sum _{i=1}^{n}{({y_{i}}-\bar{y})^{2}}} \) (4)
MAPE: Calculates the relative error percentage between the predicted and true stock prices, highlighting the deviation of the prediction results in terms of the true value scale. The formula is as follows:
\( MAPE=\frac{1}{n}\sum _{i=1}^{n}|\frac{{y_{i}}-{\hat{y}_{i}}}{{y_{i}}}|×100\% \) (5)
4. Result
4.1. Results and analysis of experimental group 1
Firstly, this paper uses the BPNN model to predict the next day’s stock closing prices for 13 major global securities markets (including the Shanghai Stock Exchange, Shenzhen Component Index, Nasdaq, New York Stock Exchange, Tokyo Stock Exchange, etc.). Table 1 summarizes the model parameter settings and performance metrics for different markets:
Table 1: Model settings and performance of different markets in experiment 1
Stock Market Code | Network Structure | Iterations | Learning Rate | MAE/MSE/ \( {R^{2}} \) /MAPE |
000001.SS | (4,10,1) | 1000 | 0.1 | 0.044/0.0028/0.49/5.31% |
399001.SZ | (4,10,1) | 3000 | 0.2 | 0.028/0.0012/0.85/3.36% |
GDAXI | (4,18,1) | 2000 | 0.2 | 0.019/0.0006/0.93/2.29% |
GSPTSE | (4,10,1) | 2000 | 0.1 | 0.055/0.0037/0.22/6.17% |
HSI | (4,8,1) | 3000 | 0.15 | 0.043/0.0028/0.56/5.43% |
IXIC | (4,8,1) | 2000 | 0.1 | 0.095/0.010/-2.92/10.25% |
KS11 | (4,19,1) | 2000 | 0.1 | 0.019/0.0006/0.61/2.06% |
N100 | (4,19,1) | 2000 | 0.1 | 0.021/0.0006/0.92/2.46% |
N225 | (4,14,1) | 2000 | 0.1 | 0.130/0.0190/-5.14/14.94% |
NYA | (4,18,1) | 2000 | 0.1 | 0.047/0.0030/0.44/5.21% |
NSEI | (4,14,1) | 2800 | 0.1 | 0.106/0.0123/-4.23/11.63% |
SSMI | (4,10,1) | 3000 | 0.1 | 0.031/0.0013/0.71/3.59% |
TWII | (4,10,1) | 2000 | 0.1 | 0.033/0.0016/0.78/3.80% |
From the results in the table, it can be observed that the performance of the BPNN model varies across different stock markets. Some markets, such as GDAXI and N100, demonstrate better model fitting, while others, like HSI, IXIC, and N225, show poorer performance.
The reasons for this variation could be attributed to several factors. For example, the excellent performance in stable markets, such as GDAXI (R² = 0.93), may be due to the market’s origin in stable industrial trends (e.g., automotive, chemicals) and low policy volatility. The Shenzhen Component Index (R² = 0.85) may perform well because the dominant high-tech sectors (such as Tencent, Huawei) enable the BPNN model to capture growth momentum.
On the other hand, some high-volatility markets perform poorly. For instance, Nasdaq (R² = -2.92) may have been negatively affected by extreme events (e.g., the pandemic crash in 2020, the tech bubble in 2021), causing a shift in the training-test distribution. Similarly, India’s Nifty50 (NSEI, R² = -4.23) might also have been distorted by external factors not fully considered, such as monsoon impacts and fluctuations in Foreign Direct Investment (FDI).
4.2. Results and analysis of experimental group 2
To further investigate the prediction performance of the model, the time prediction span for each stock market was extended. Experiment 2 was designed accordingly, yielding the following results:
Table 2: Model settings and performance of different markets in experiment 2
Stock Market Code | MAE/MSE/ \( {R^{2}} \) /MAPE |
000001.SS | 0.063/0.0054/0.12/7.56% |
399001.SZ | 0.033/0.0019/0.66/3.95% |
GDAXI | 0.050/0.0035/0.81/6.09% |
GSPTSE | 0.043/0.0025/0.81/5.11% |
HSI | 0.029/0.0015/0.94/4.45% |
IXIC | 0.049/0.0032/0.68/5.51% |
KS11 | 0.075/0.0070/0.67/8.63% |
N100 | 0.024/0.0010/0.95/3.25% |
N225 | 0.026/0.0011/0.94/3.07% |
NYA | 0.086/0.0101/0.40/10.06% |
NSEI | 0.205/0.0513/-2.11/23.20% |
SSMI | 0.054/0.0040/0.71/6.67% |
TWII | 0.021/0.0009/0.96/2.74% |
From the results in the table, it is evident that extending the time span has improved the prediction performance of the model for certain stock markets. The figure below shows a comparison of the fitting curves for the HSI stock market before and after extending the time span:
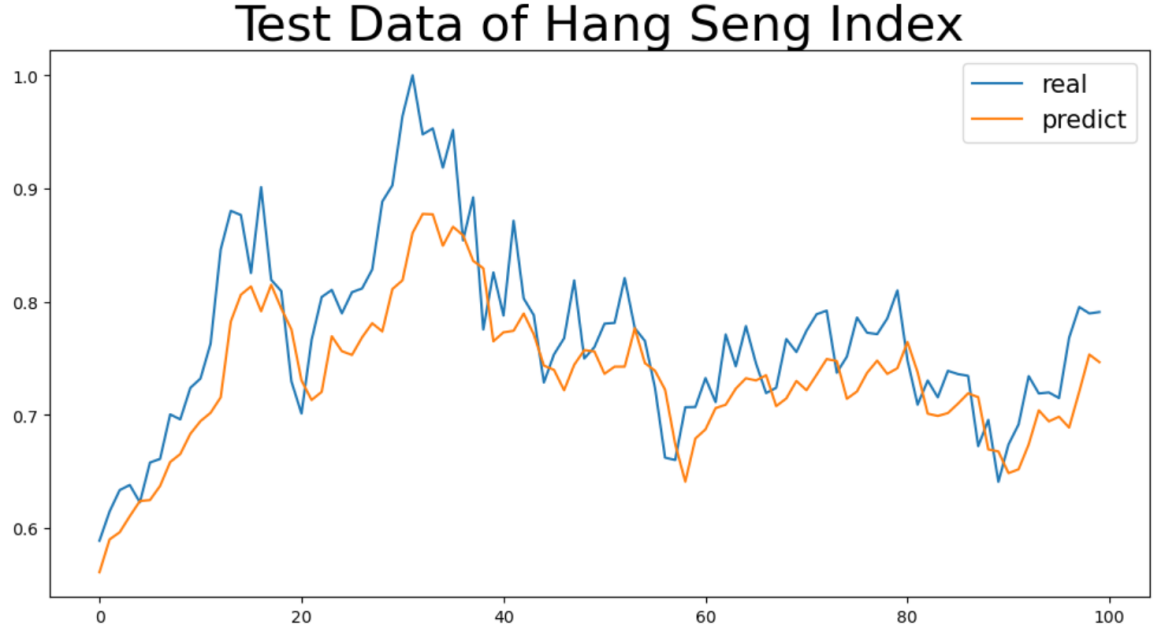
Figure 1: HSI market two-year data closing price prediction
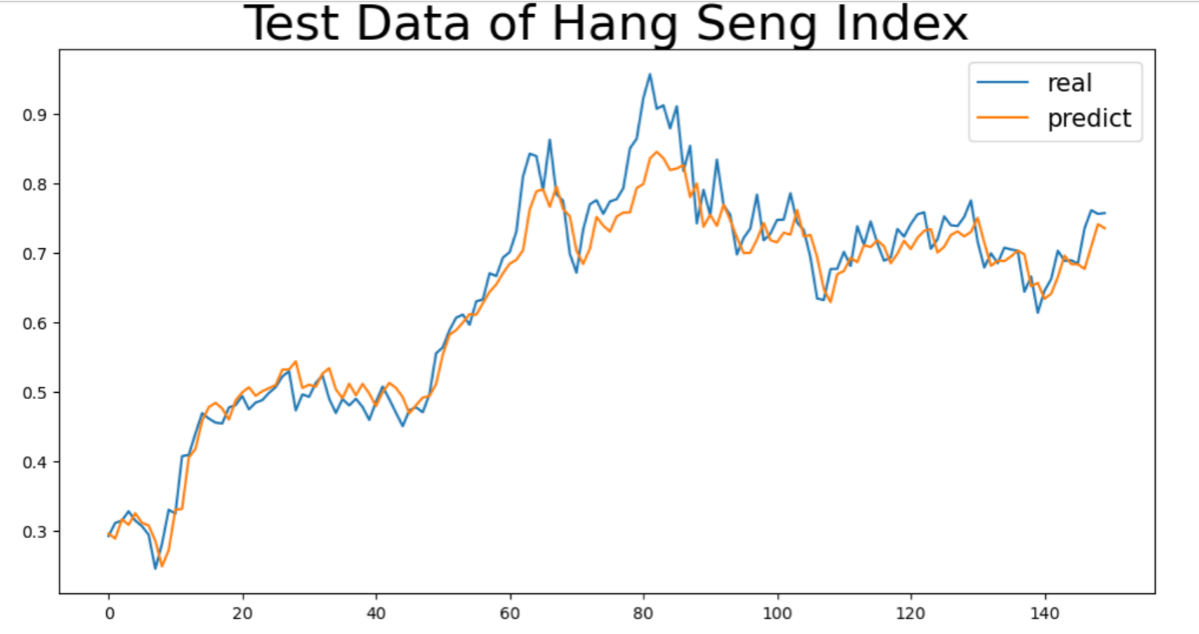
Figure 2: HSI market three-year data closing price prediction
From the comparison of the two experimental results for the HSI market above, it can be seen that the increase in the time span incorporates a richer variety of stock market scenarios (such as upward cycles, downward adjustments, and consolidation phases), allowing the model to be exposed to a more diverse set of price fluctuation patterns during training. For example, Figure 2 may include a complete market up-and-down cycle, enabling the model to learn more complex trend evolution patterns, which in turn allows it to better match the fluctuation rhythm of real data during prediction.
However, it was also observed that extending the time span did not enhance the prediction performance across all stock markets. The figure below shows a comparison of the fitting curves before and after extending the time span for the Shanghai Stock Exchange Composite Index:
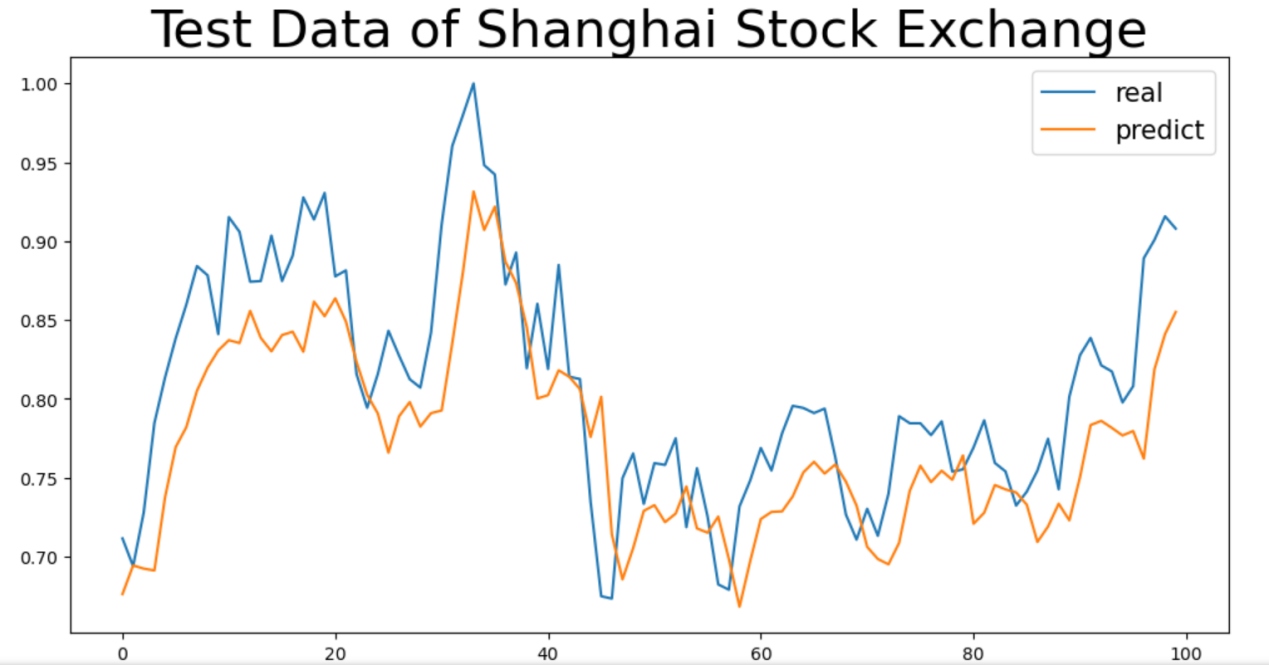
Figure 3: 000001.SS market two-year data closing price prediction
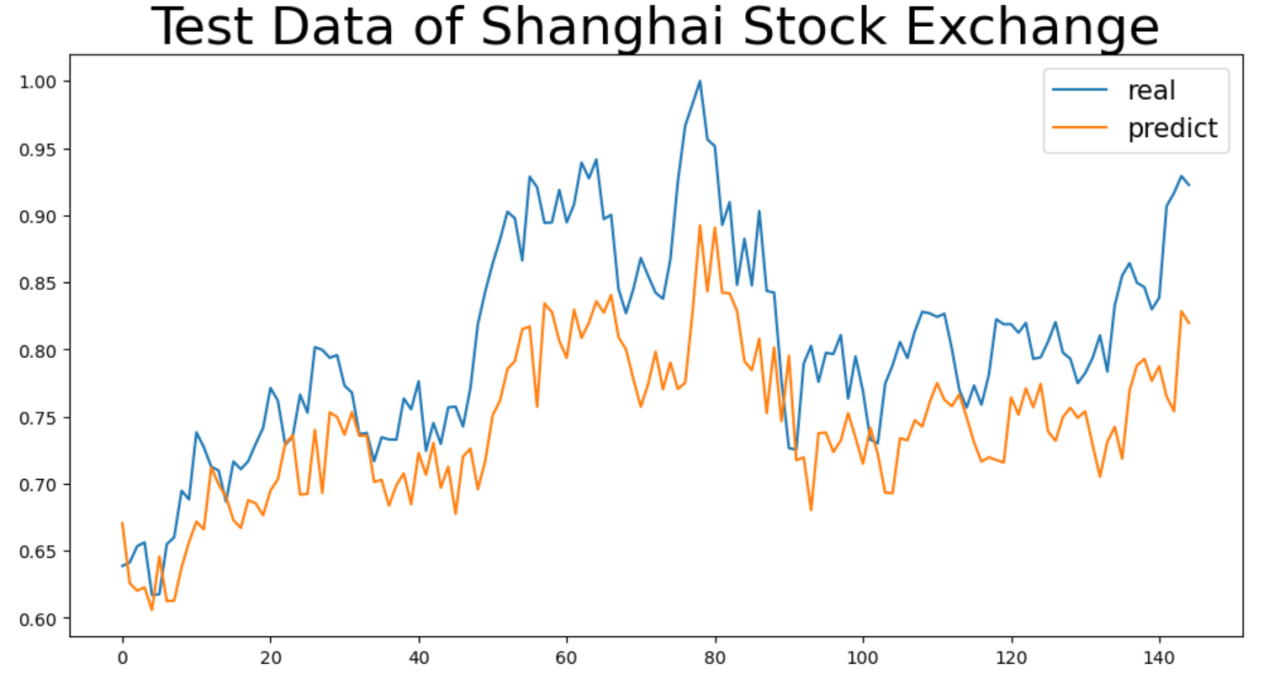
Figure 4: 000001.SS market three-year data closing price prediction
From the comparison of the two experimental results for the Shanghai Stock Exchange market above, it is evident that extending the time span did not improve the prediction performance. This may be because the increased time span incorporated more policy-sensitive events (such as the financial deleveraging in 2018 and the trade war), which triggered abnormal market fluctuations and created significant non-regular noise. During model training, the system was not exposed to a variety of effective price fluctuation patterns but rather to a chaotic volatility scenario dominated by policy shocks. For instance, in the period with the extended time span, extreme fluctuations caused by policy interventions masked the market patterns, and under fixed parameters (e.g., hidden layer nodes, learning rate), the model was unable to extract stable trend evolution patterns from this noisy data. On the contrary, the complex noise interfered with the model’s ability to learn the existing limited patterns, making it difficult to match the real data’s fluctuation rhythm during prediction, ultimately resulting in a more significant deviation between the predicted and actual curves and a deterioration in metrics such as MAE and MSE.
5. Conclusion
5.1. Research summary
This paper starts from the complexity of stock price prediction and the practical demands, designing two comparative experiments based on the Backpropagation Neural Network (BPNN) model, with time spans of two years and three years, respectively. Empirical analysis was conducted to examine the impact of data time span on multivariate time series prediction performance. A total of 13 major global stock markets (including Nasdaq, the Shanghai Composite Index, and Germany’s DAX) were covered, and using features such as opening price, closing price, highest price, and lowest price, a nonlinear mapping model was constructed to predict the next day’s closing price based on historical data.
The experimental results indicate:
Model Advantages: BPNN performs excellently in certain stable markets (such as Germany’s DAX and Shenzhen Component Index), with R² reaching up to 0.96, proving its effectiveness in capturing local trends and nonlinear relationships.
Time Span Impact: Properly extending the data time span can improve the prediction accuracy for certain markets (e.g., the Hang Seng Index). The primary reason for this is that it covers a more complete market cycle (such as alternating up and down trends, and consolidation), allowing the model to learn more complex fluctuation patterns.
Multimarket Applicability: This paper reveals the differences in market sensitivity to time span, providing data selection and model optimization references for investors and financial institutions.
5.2. Research limitations
Despite achieving certain results through empirical analysis, this study still has limitations:
Limitations of Model Structure: As a shallow neural network, BPNN struggles to effectively capture long-term dependencies in time series. It also has weak adaptability to extreme events (such as pandemic crashes or policy shocks), which may result in negative R² values for high-volatility markets (e.g., Nasdaq and India’s Nifty50).
Data Range Constraints: The experimental data in this study has a maximum time span of only three years, which does not fully cover long market cycles (such as a ten-year economic cycle). Additionally, external influencing factors (such as macroeconomic indicators and policy changes) that impact stock prices were not included, which limits the model’s generalization ability to some extent.
5.3. Research outlook
Finally, in response to the aforementioned limitations, future related research could be expanded in the following three directions:
Model Innovation: Introduce more advanced deep learning architectures (e.g., LSTM, Transformer, or hybrid models like Factor-GAN) to enhance the modeling ability for long-term dependencies and nonlinear noise in time series.
Data Expansion: Attempt to incorporate longer historical data and multidimensional external features (such as news sentiment and macroeconomic indicators) within the model’s performance range, improving the model’s explanatory power for complex market environments.
Robustness Enhancement: Explore adversarial training or phased modeling strategies to mitigate the distribution shift caused by extreme events, enhancing the model’s prediction stability in non-stationary and volatile markets.
References
[1]. Cao, Q., Parry, M. E., & Leggio, K. B. (2011). The three-factor model and artificial neural networks: Predicting stock price movement in China. Annals of Operations Research, 185, 25–44.
[2]. Shi, H., & Liu, X. (2014). Application on stock price prediction of Elman neural networks based on principal component analysis method. In Proceedings of the 2014 11th International Computer Conference on Wavelet Active Media Technology and Information Processing (ICCWAMTIP) (pp. 411–414).
[3]. Zahedi, J., & Rounaghi, M. M. (2015). Application of artificial neural network models and principal component analysis method in predicting stock prices on Tehran Stock Exchange. Physica A: Statistical Mechanics and Its Applications, 438, 178–187.
[4]. Gao, T., et al. (2016). Deep learning with stock indicators and two-dimensional principal component analysis for closing price prediction system. In Proceedings of the 7th IEEE International Conference on Software Engineering and Service Science (ICSESS) (pp. 166–169).
[5]. Yu, Z., et al. (2020). Stock price forecasting based on LLE-BP neural network model. Physica A: Statistical Mechanics and Its Applications, 553, 124197.
[6]. Dong, W., & Zhao, C. (2021). Stock price forecasting based on fractional grey model with convolution and BP neural network. In Proceedings of the 33rd Chinese Control and Decision Conference (CCDC) (pp. 1995–2000).
[7]. Bui, T. K., & Tran, T. H. (2022). Long short-term memory recurrent neural network for predicting the return of rate under the Fama-French 5 factor. Discrete Dynamics in Nature and Society, 2022, Article ID 3936122.
[8]. Bui, T. K., & Tran, T. H. (2022). Long short-term memory recurrent neural network for predicting the return of rate under the Fama-French 5 factor. Discrete Dynamics in Nature and Society, 2022, Article ID 3936122.
[9]. Wang, J., et al. (2023). A PCA-IGRU model for stock price prediction. Journal of Internet Technology.
[10]. Wang, J., & Chen, Z. (2024). Factor-GAN: Enhancing stock price prediction and factor investment with generative adversarial networks. PLOS ONE, 19(6), e0306094.
[11]. Sarıkoç, M., & Celik, M. (2024). PCA-ICA-LSTM: A hybrid deep learning model based on dimension reduction methods to predict S&P 500 index price. Computational Economics.
[12]. Rumelhart, D. E., et al. (1986). Learning representations by back-propagating errors. Nature, 323(6088), 533–536.
Cite this article
Jin,H. (2025). Data Time Span’s Impact on Stock Price Prediction: An Empirical Study Across Multiple Markets Based on BP Neural Networks. Advances in Economics, Management and Political Sciences,191,1-9.
Data availability
The datasets used and/or analyzed during the current study will be available from the authors upon reasonable request.
Disclaimer/Publisher's Note
The statements, opinions and data contained in all publications are solely those of the individual author(s) and contributor(s) and not of EWA Publishing and/or the editor(s). EWA Publishing and/or the editor(s) disclaim responsibility for any injury to people or property resulting from any ideas, methods, instructions or products referred to in the content.
About volume
Volume title: Proceedings of ICEMGD 2025 Symposium: The 4th International Conference on Applied Economics and Policy Studies
© 2024 by the author(s). Licensee EWA Publishing, Oxford, UK. This article is an open access article distributed under the terms and
conditions of the Creative Commons Attribution (CC BY) license. Authors who
publish this series agree to the following terms:
1. Authors retain copyright and grant the series right of first publication with the work simultaneously licensed under a Creative Commons
Attribution License that allows others to share the work with an acknowledgment of the work's authorship and initial publication in this
series.
2. Authors are able to enter into separate, additional contractual arrangements for the non-exclusive distribution of the series's published
version of the work (e.g., post it to an institutional repository or publish it in a book), with an acknowledgment of its initial
publication in this series.
3. Authors are permitted and encouraged to post their work online (e.g., in institutional repositories or on their website) prior to and
during the submission process, as it can lead to productive exchanges, as well as earlier and greater citation of published work (See
Open access policy for details).
References
[1]. Cao, Q., Parry, M. E., & Leggio, K. B. (2011). The three-factor model and artificial neural networks: Predicting stock price movement in China. Annals of Operations Research, 185, 25–44.
[2]. Shi, H., & Liu, X. (2014). Application on stock price prediction of Elman neural networks based on principal component analysis method. In Proceedings of the 2014 11th International Computer Conference on Wavelet Active Media Technology and Information Processing (ICCWAMTIP) (pp. 411–414).
[3]. Zahedi, J., & Rounaghi, M. M. (2015). Application of artificial neural network models and principal component analysis method in predicting stock prices on Tehran Stock Exchange. Physica A: Statistical Mechanics and Its Applications, 438, 178–187.
[4]. Gao, T., et al. (2016). Deep learning with stock indicators and two-dimensional principal component analysis for closing price prediction system. In Proceedings of the 7th IEEE International Conference on Software Engineering and Service Science (ICSESS) (pp. 166–169).
[5]. Yu, Z., et al. (2020). Stock price forecasting based on LLE-BP neural network model. Physica A: Statistical Mechanics and Its Applications, 553, 124197.
[6]. Dong, W., & Zhao, C. (2021). Stock price forecasting based on fractional grey model with convolution and BP neural network. In Proceedings of the 33rd Chinese Control and Decision Conference (CCDC) (pp. 1995–2000).
[7]. Bui, T. K., & Tran, T. H. (2022). Long short-term memory recurrent neural network for predicting the return of rate under the Fama-French 5 factor. Discrete Dynamics in Nature and Society, 2022, Article ID 3936122.
[8]. Bui, T. K., & Tran, T. H. (2022). Long short-term memory recurrent neural network for predicting the return of rate under the Fama-French 5 factor. Discrete Dynamics in Nature and Society, 2022, Article ID 3936122.
[9]. Wang, J., et al. (2023). A PCA-IGRU model for stock price prediction. Journal of Internet Technology.
[10]. Wang, J., & Chen, Z. (2024). Factor-GAN: Enhancing stock price prediction and factor investment with generative adversarial networks. PLOS ONE, 19(6), e0306094.
[11]. Sarıkoç, M., & Celik, M. (2024). PCA-ICA-LSTM: A hybrid deep learning model based on dimension reduction methods to predict S&P 500 index price. Computational Economics.
[12]. Rumelhart, D. E., et al. (1986). Learning representations by back-propagating errors. Nature, 323(6088), 533–536.