


1. Introduction
The study of the impact of exchange rate fluctuations on macroeconomy is surly an important topic in economics, particularly in the economic globalization context. The examples of rapidly growing economies have shown that governments can influence their domestic currency exchange rates through various methods in order to gain advantages in their export-oriented economies and promote economic development. Typical examples include Japan, China, and some other East Asian countries or regions over the past few decades, where appropriate exchange rate adjustments have played a significant role in maintaining their international competitiveness [1].
For a long time, researchers have primarily concentrated on the adverse effects of exchange rate misalignment on the economy. Both empirical evidence and theoretical perspectives generally suggest that an overvalued currency is detrimental to economic development and is often associated with macroeconomic instability [2].
Rodrik's research, using cross-country data over a longer time span, found a strong correlation between economic growth and undervalued real exchange rates (RER) [3]. Since then, the relationship between them has become a popular research topic. Increasingly, studies have found that an undervalued exchange rate may contribute to economic growth, particularly for developing countries [4]. China's recent performance has attracted widespread international attention to this phenomenon. It is widely believed internationally that the People's Bank of China has maintained a lower exchange rate for the renminbi to achieve a trade surplus, which has made a significant contribution to China's long-term economic growth.
However, it is worth noting that the stimulative impact of an undervalued exchange rate on economic development is indeed complicated. In the short term, it is intuitively understood that a lower real exchange rate fosters economic growth by boosting exports. However, the mechanisms underlying this relationship become much more complex when viewed from a long-term perspective, simply speaking, there is a lack of consensus among these theories. Different theories may emphasize different economic factors and channels, making it difficult to form a unified theoretical framework to guide policy-making. For instance, some theories emphasize market failures and suboptimal adjustment mechanisms [3], while others focus on structural changes and mobilization of surplus labour [5].
In view of this, this study employed a comparative perspective, focusing on two primary channels: capital and trade. Two mediation effects, foreign direct investment (FDI) and net export (NX), are thereby selected. The capital channel is represented by foreign direct investment, where an undervaluation of a country's currency can attract more foreign investment and capital inflows, thereby promoting economic growth. The trade channel encompasses exports and imports, where an undervalued currency can lead to relatively lower export prices, potentially boosting net exports and thus leading to economic growth. Additionally, different countries may exhibit variations in the impact of currency undervaluation due to factors such as their development level, domestic economic policies, degree of market openness, and industrial structure. Therefore, the objective of this study is to investigate the underlying link between currency undervaluation and economic growth by conducting cross-country comparisons and examining how national attributes influence the channels through which undervaluation influences economic growth. This will provide valuable references for policymakers making optimal choices based on local conditions.
The thesis includes the following parts: Chapter 2 gives a brief review of the related studies on the influence mechanism of the real exchange rate underestimate on economic growth. Chapter 3 illustrates how the variables are chosen and how data is processed. Chapter 4 is about the methodology related to this research, specifically panel regression, mediation effects, and vector autoregression. The exploratory analysis is carried out step by step in Chapter 5, where the results will be discussed as well. Chapter 6 draws the final conclusion on this thesis and gives possible directions for future researches based on this.
2. Literature review
Academic consensus on the precise mechanism through which undervalued real exchange rates affect economic growth is yet to be established. Existing theories suggest that exchange rate fluctuations can impact economic development through various channels, including international trade, capital flows, and price levels. Hu et al., through empirical analysis of 179 countries worldwide, found that undervalued real exchange rates are conducive to promoting economic growth, with industrial expansion, labor mobility, capital investment, and technological progress being the main channels of influence [6]. Freund and Pierola, by analyzing export surges in 92 countries, discovered that in developing countries, such upswings are typically preceded by a substantial real depreciation, resulting in a significantly undervalued exchange rate, along with a decrease in exchange rate volatility. They argue that by maintaining a competitive currency, firms tend to expand their product offerings and explore new export markets, significantly reorientating the tradable sector [7]. Guzman et al. found that changes in the real exchange rate affect industrial growth through the investment channel. However, the differential spillover effects across sectors also have an impact on industrial structure [8]. Markusen et al. comprehensively explored the facilitative role of foreign direct investment (FDI) in promoting local industrial development [9]. In a separate study, Tiange Z. specifically examined the effects of fluctuations in the Vietnamese dong exchange rate on Vietnam's economic growth through an empirical analysis using the VAR (Vector Autoregression) model and compared the contributions of the investment and trade channels [10].
3. Exploratory data analysis
3.1. Data acquisition and description
3.1.1. Theoretical analysis of the impact of exchange rate undervaluation on macroeconomy
The real exchange rate has been considered one of the rarest and most poorly defined concepts in economics [11]. The real exchange rate can be subdivided into external real exchange rate and internal real exchange rate. First of all, the external one refers to the exchange rate between a basket of representative goods of two countries, excluding the factor of the currency itself, which is used to reflect the international competitiveness of the country's commodity prices. In addition, the internal real exchange rate refers to the internal price of a country's non-tradables compared to its tradables. The dimension chosen in this paper is the external real exchange rate.
Whether based on the theory of purchasing power parity, RER should be basically stable since it is affected by supply and demand factors, it is believed that various economic factors endogenously determine the real exchange rate, that is, the real exchange rate must change when other economic factors vary, therefore cannot be used as a policy tool. It also provides theoretical support for the choice of empirical analysis method below.
3.1.2. Influence mechanism of exchange rate fluctuation on economic growth
3.1.2.1. Channel of international trade
According to the GDP expenditure method formula:
From the demand perspective, net export constitutes a part of total demand, and increasing a country's net exports will inevitably lead to economic growth. At the same time, import and export trade is closely related to investment and consumption, while the changes in import and export trade will also affect the changes in investment and consumption, affecting the total demand and economic growth. From the supply perspective, import and export trade is conducive to domestic technological progress, institutional innovation, and optimal allocation of resources. The technology spillover effect of import and export trade helps domestic enterprises to introduce and learn advanced technologies, enhance their competitiveness and innovation ability, improve their production efficiency, drive the improvement of total factor productivity of industries, and promote economic growth. Enterprises' management systems and business model have an important impact on their long-term development. At the same time, production based on factor endowment has a comparative advantage, which is conducive to improving the efficiency of domestic resource utilization, optimizing resource allocation, and promoting economic growth.
3.1.2.2. Channels of international capital flow
According to the new classical economic growth theory:
Foreign direct investment constitutes a part of a country's capital factors and directly affects economic growth. At the same time, foreign direct investment also impacts a country's industrial structure adjustment, technological progress, system reform, etc. Foreign direct investment indirectly promotes the country's economic growth by affecting the total factor productivity. In terms of direct impact, the production and sales of foreign-funded enterprises are conducive to increasing import and export trade and promoting economic growth. Meanwhile, the inflow of foreign direct investment drives part of the employment, affects the input of human capital factors, and therefore affects economic growth. In terms of indirect effect, on the one hand, the industrial transfer brought by foreign direct investment directly affects the industrial structure of the host country. The increase in foreign direct investment has a thorough effect along the entire industrial chain, affecting the production layout of upstream, middle, and downstream enterprises and then affecting the industrial structure of the host country. When the industrial structure is optimized and upgraded, the total factor productivity will be improved, which is conducive to promoting economic growth. From a different perspective, though, the technology spillover effect of foreign direct investment is conducive to promoting the technological progress of host countries. Foreign enterprises intensify the market competition of host countries.
3.2. Data preprocessing
According to the above analysis, exchange rate fluctuations will affect economic growth through international trade channels and capital flow. Previous studies often used import and export and foreign direct investment as proxy variables for the main channels affecting economic growth. Therefore, the same proxy variables are selected to reflect the influence of international trade and international capital flow channels in the model construction of this chapter. In addition, this paper studies the growth rate of real GDP as an indicator to reflect economic growth. To sum up, in this paper, four endogenous variables are selected to model the impact of exchange rate undervaluation on economic growth: exchange rate undervaluation (udv) of various countries, net export (nx) as the proxy variable of international trade channel, that is, the difference between the export volume and import volume of the country's goods trade, foreign direct investment(fdi) as the proxy variable of international capital flow channel. And gross domestic product (gdp). The net export of goods trade and foreign direct investment data are from the CEIC database. To avoid the bias caused by the COVID, the sample interval of this model is annual data from 1970 to 2019, and all variables except net export (nx) are taken as natural logarithms.
3.3. Feature engineering
Countries with missing values are excluded from the calculation. The remaining data has no outliers, and then the log of the real exchange rate (RER), undervaluation, and GDP per capital is taken to ensure the data is more available for regression analysis. The details of the calculation of RER, undervaluation and the growth rate will be further discussed in the subsequent section.
3.4. Statistical analysis and data visualization
Figure 1 below shows the growth rates and real exchange rates for Brazil, Australia, and the United Kingdom. The curve is quite smooth, indicating that the data is available.
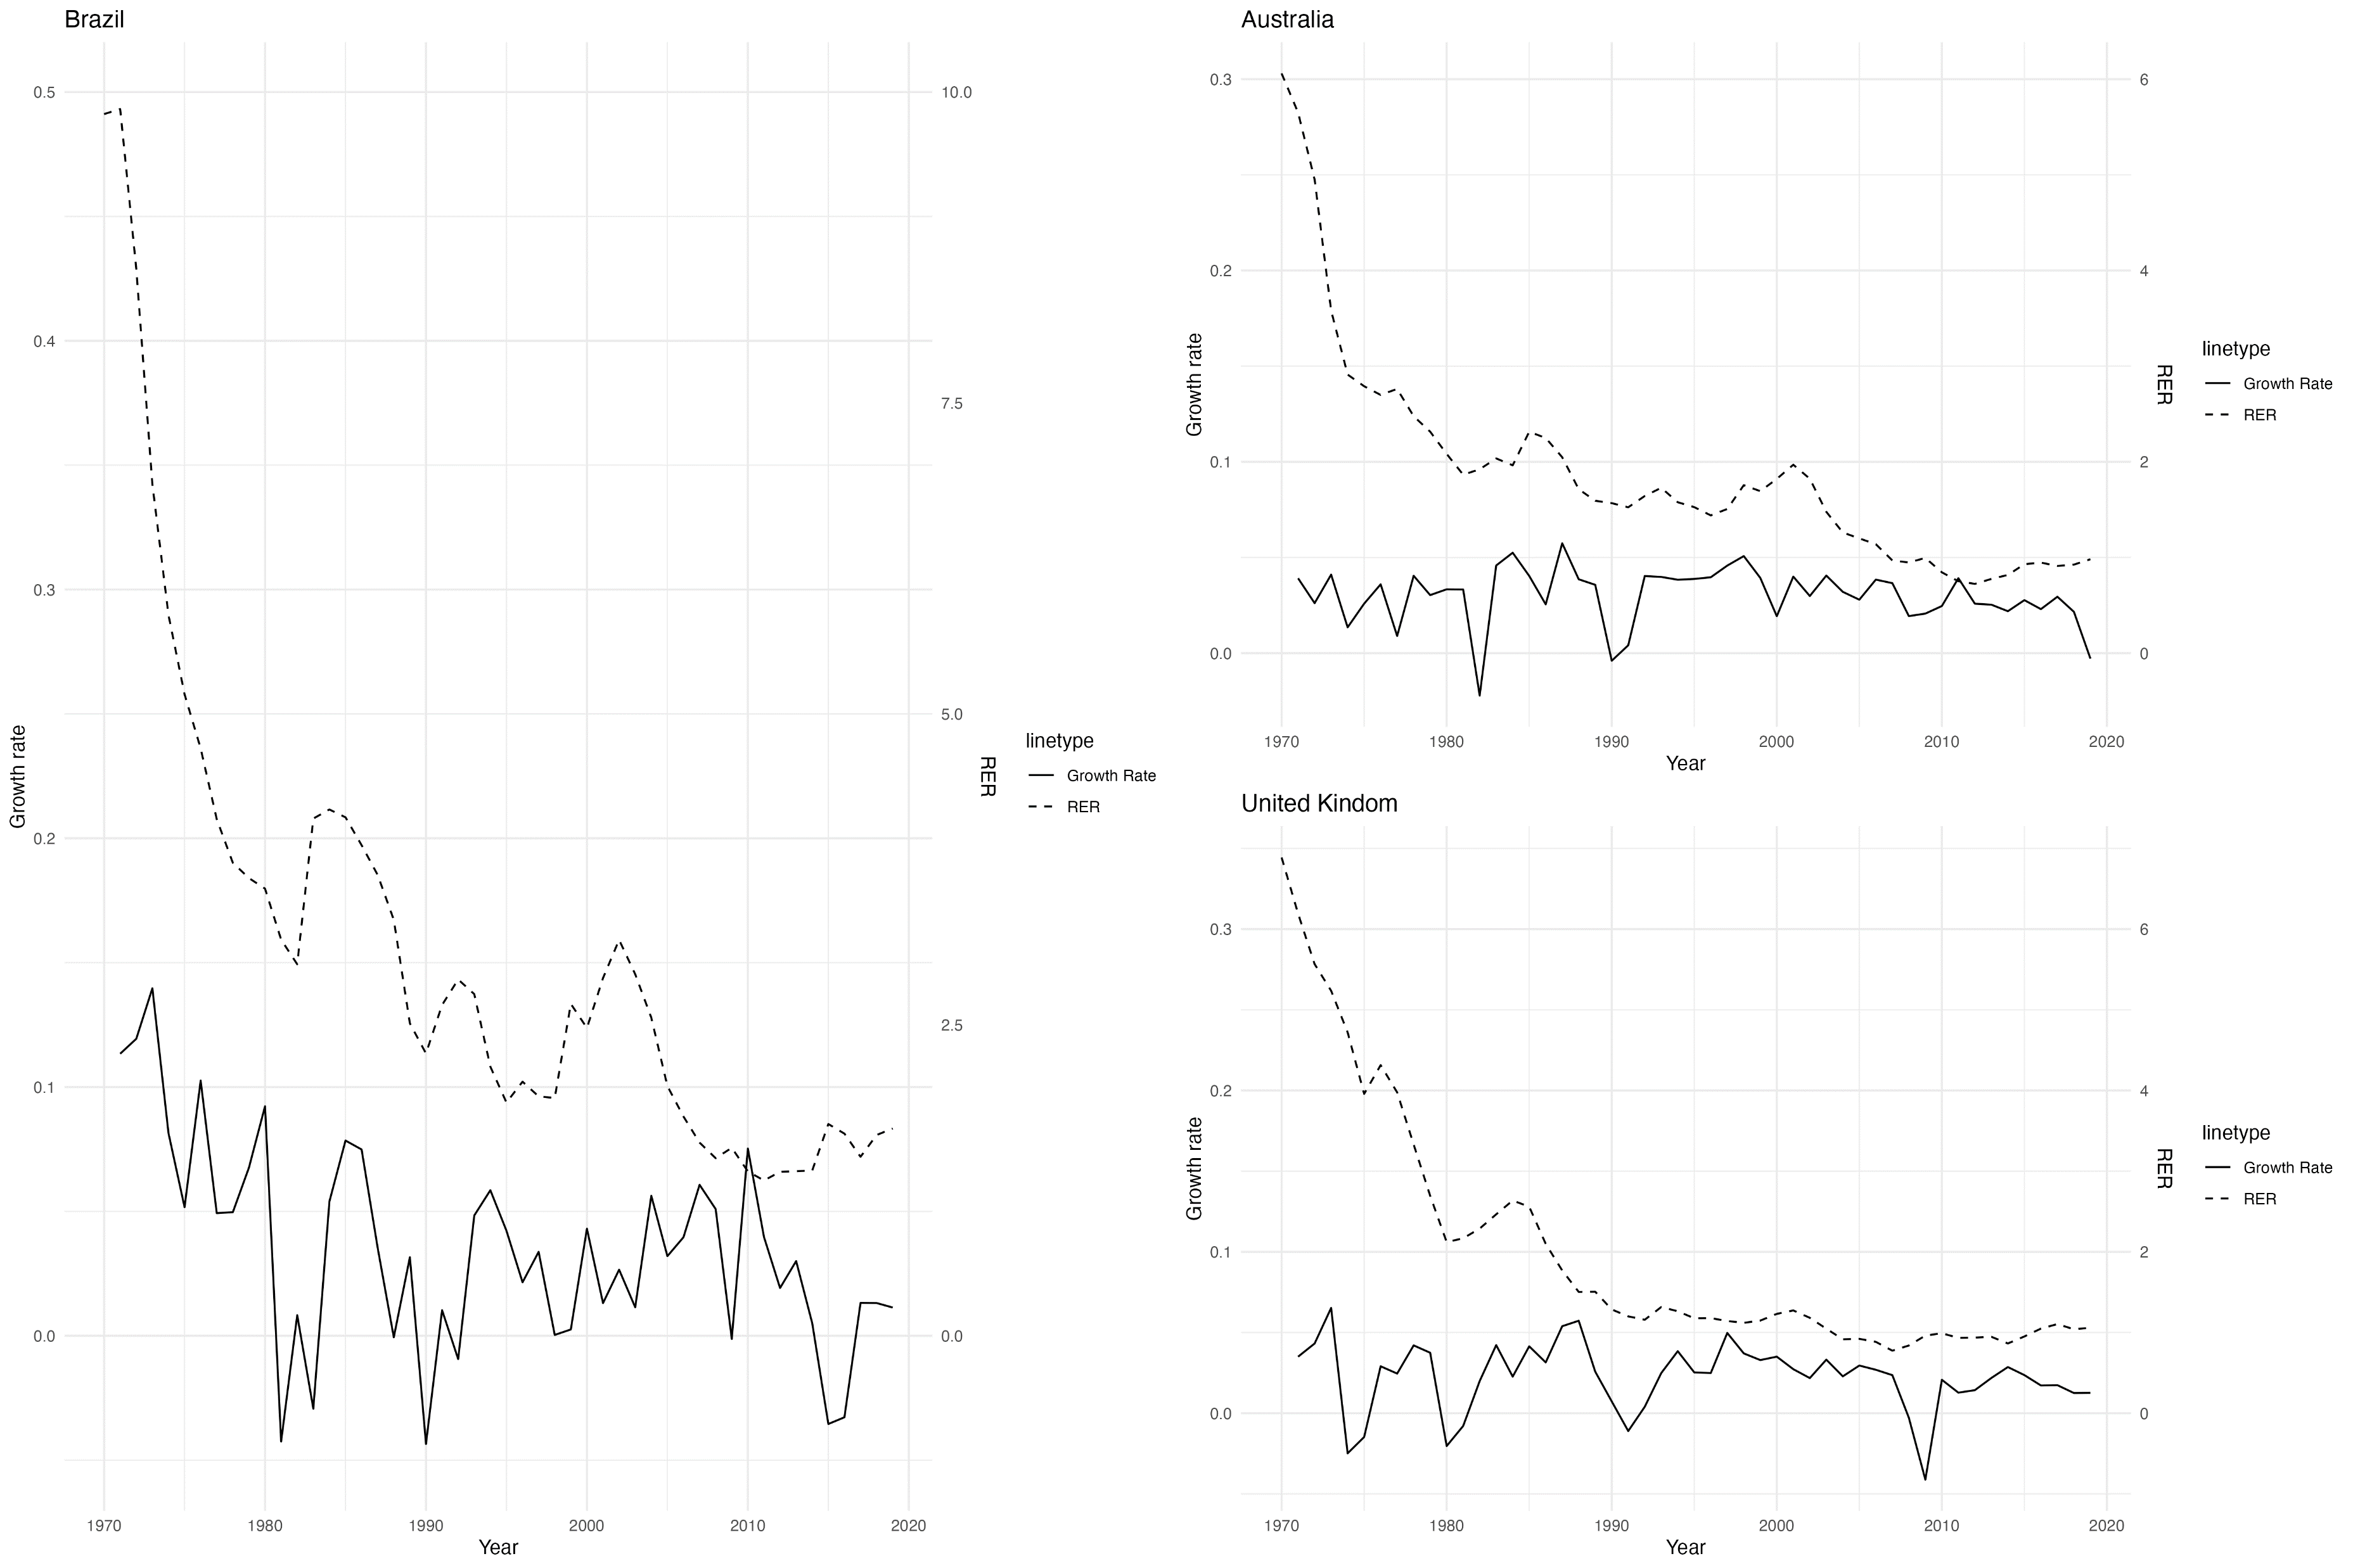
Figure 1: Growth rate v.s. RER
4. Methodology
4.1. Panel data regression: time fixed effects model
Panel data is a type of data that combines cross-sectional and time series information. In panel data, we observe the changes in multiple entities (such as countries, companies, or individuals) over multiple time periods. This data type provides more information and allows us to simultaneously consider the differences among entities and the changes over time.
The fixed effects model is a commonly used approach to deal with panel data. The mathematical expression of individual fixed effects can be represented as follows:
Here,
In the fixed effects model, we assume that the inter-individual differences are fixed, meaning they do not vary over time and are uniquely associated with individual characteristics. This would help to control the differences between individuals and, therefore, obtain more accurate estimates of the effects of independent variables on dependent variables.
Similarly, the time-fixed effects model is another variation of the fixed effects model. It can be expressed as:
Here,
4.1.1. Process introduction
RER (Real Exchange Rate) represents the ratio of a country's price level to the price level in the United States. The underestimation of RER refers to a situation where the actual value of RER is higher than its theoretical value, indicating that the purchasing power of the country’s currency is underestimated.
The calculation process is divided into three steps.
4.1.2. Calculate RER
In the first step, we calculate the actual value of RER using two methods:
Since the method of calculating RER is not fixed, we plan to test the stability of the model by using multiple calculation methods. The first method uses data from Penn World, which assesses the overall price level across countries, while the second method uses data from the World Table, which conducts a weighted average of a basket of goods to examine a country's price level. The second method considers fewer types of goods than the first, but the quality of the calculation method also affects the accuracy of RER.
4.1.3. Calculate undervaluation
In the second step, we calculate the underestimation based on panel data. As the method for calculating underestimation is also not fixed, this article adopts three different calculation methods to test the stability of the model. The first method is based on the PPP (Purchasing Power Parity) theory, which states that in the long run, the same goods should have the same prices across different countries. Suppose a good is more expensive in one country than another. In that case, people will tend to buy from the cheaper country, leading to balanced prices under conditions without trade barriers and transportation costs. Thus, RER should theoretically equal 1. The latter two methods utilize data from CEIC. As shown in Figure 2, China is taken as an example, the second method calculates the true value of RER by averaging the RER data over a long time frame, which is a rather rough calculation. The third method is based on the Balassa-Samuelson effect, which indicates that non-tradable goods generally have lower prices in developing countries. Therefore, we need to adjust the theoretical value of RER appropriately:
Where
Then, we obtain the calculation results for UNDERVAL:
If the calculated lnUDV is greater than 1, it indicates that the actual price level in that country, in relation to the price level in the United States, is lower than the theoretical ratio, therefore indicating that RER is underestimated in that country.
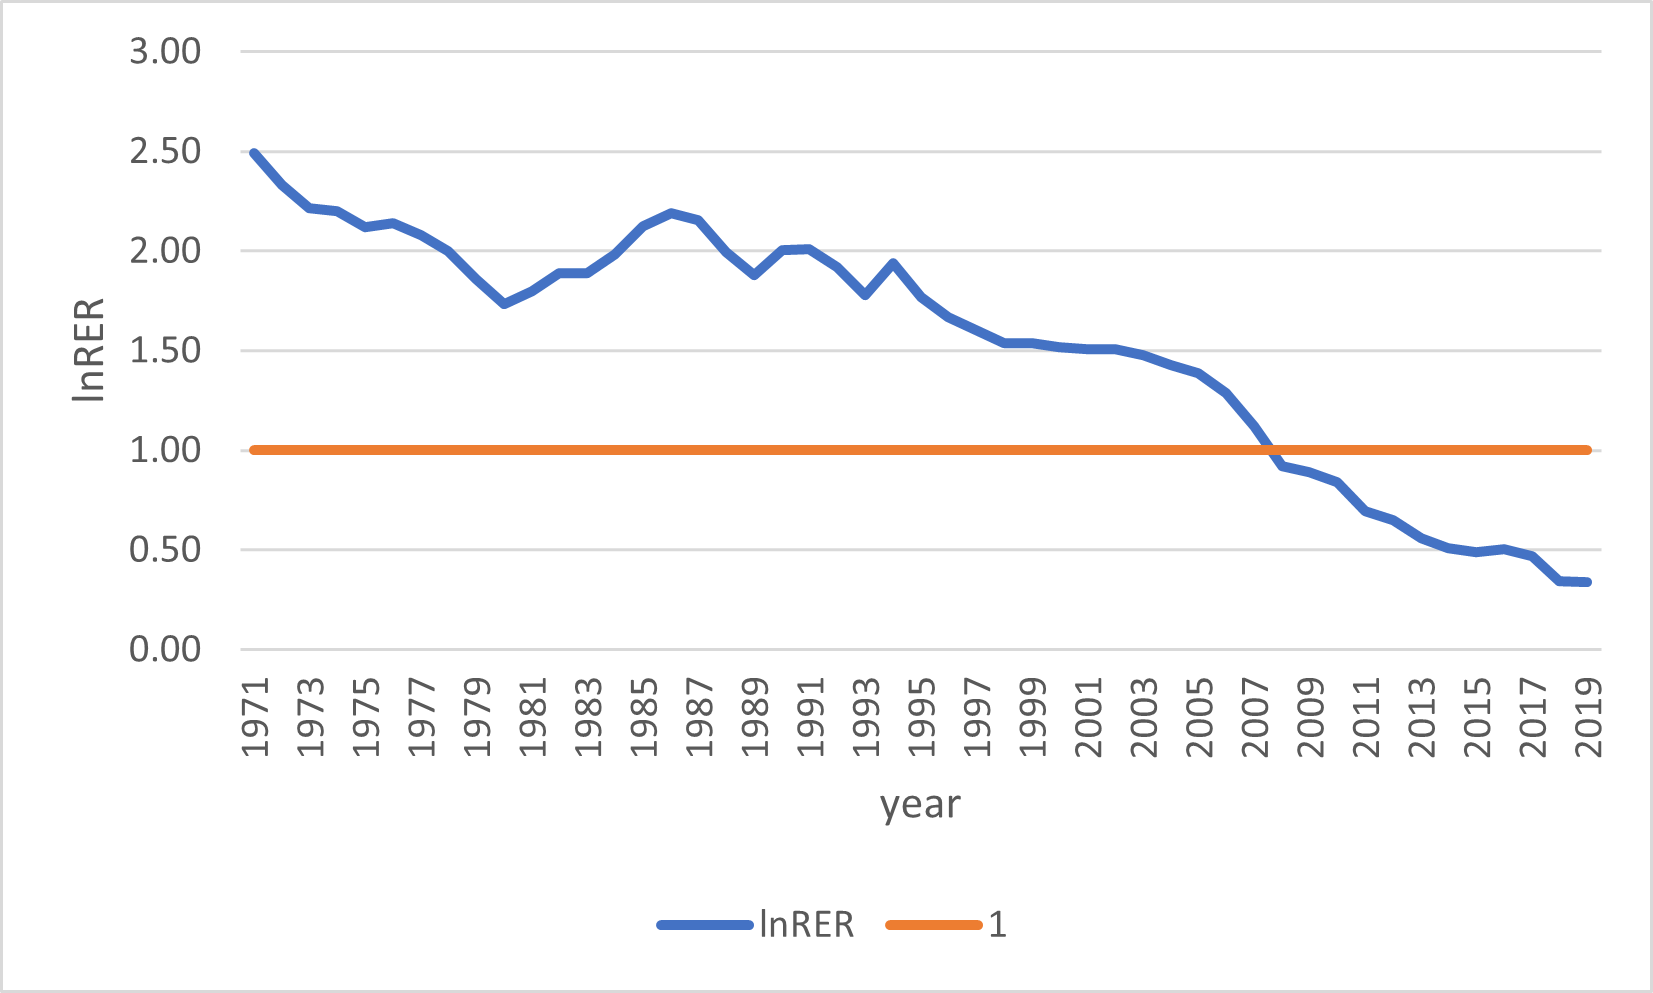
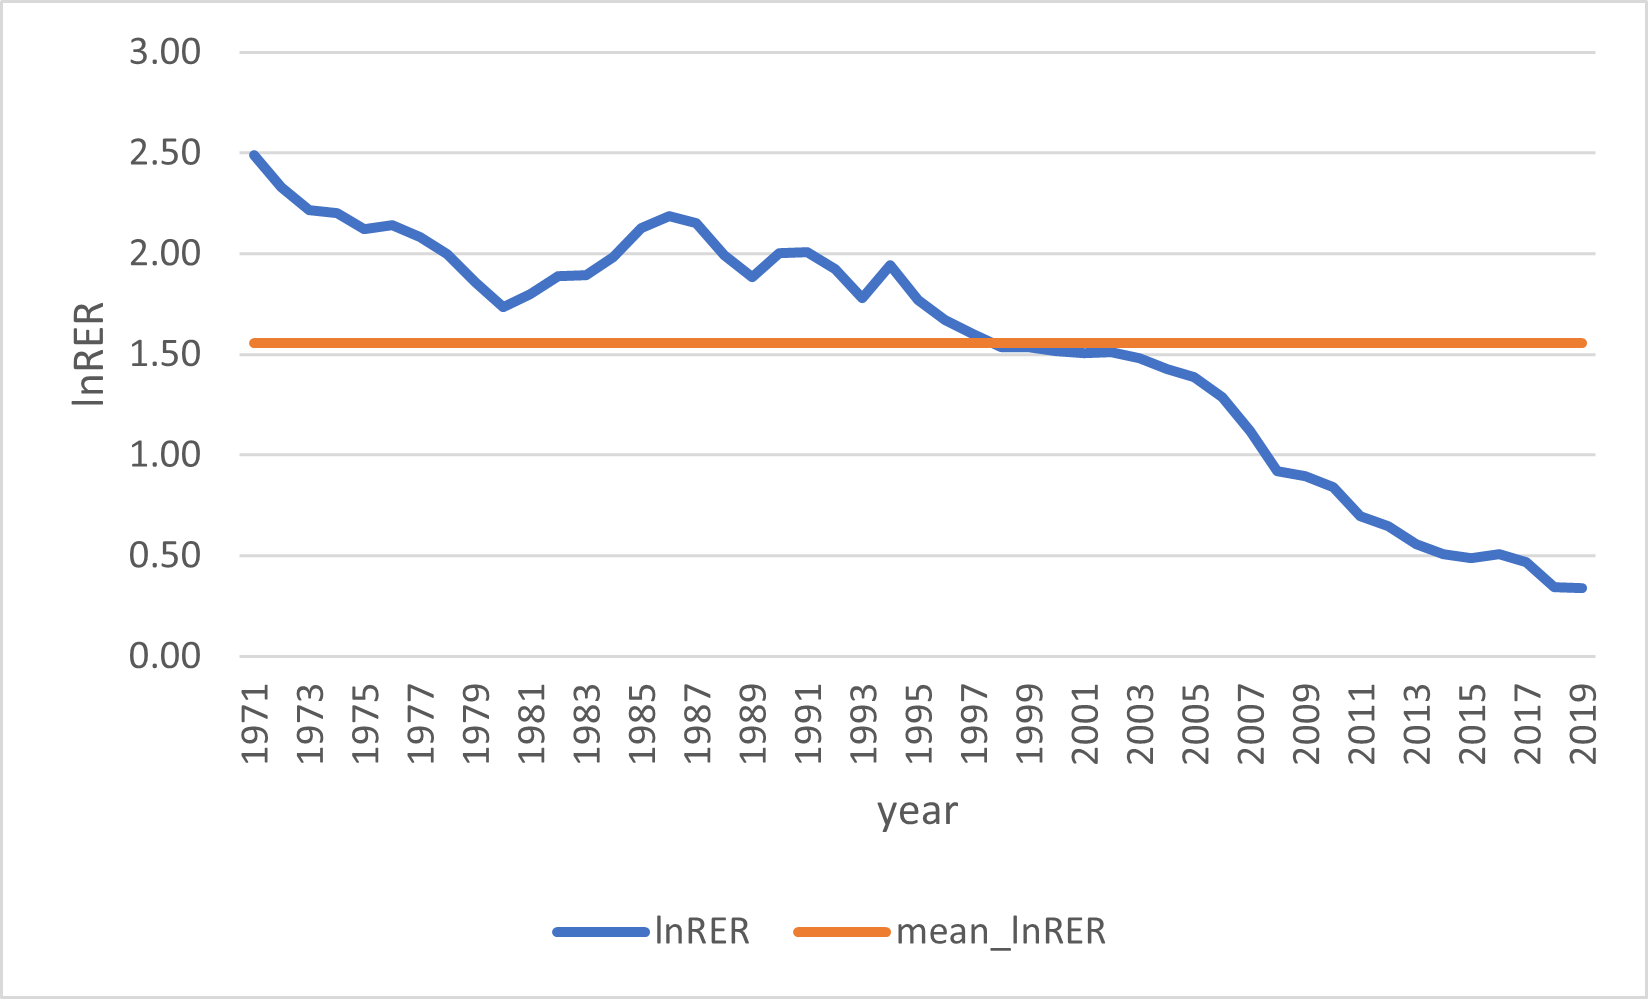
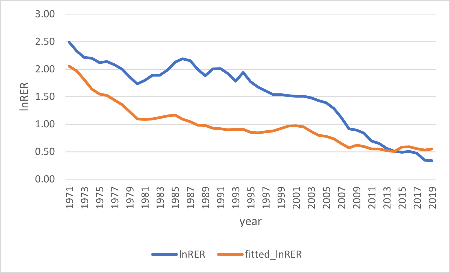
Figure 2: Different measurements of RER undervaluation
4.1.4. Regression
In the third step, we establish a panel regression model between the economic growth rate and underestimation, using data from Penn World for the calculations. First, we calculate the economic growth rate using the country's real GDP. Then, we build the model:
The dependent variable is the economic growth rate, the standard convergence term is the initial income, and the model also includes time, country dummy variables, and error terms.
4.2. Assessing mediation effects using bootstrap methodology
4.2.1. Data standardized
First, the variables in the data, FDI, GDP, NX and UnderValuation, are standardized. The purpose of this step is to eliminate dimensional effects between different variables, thus ensuring the validity and robustness of the regression model calculations.
4.2.2. Construction of mediation effect model
First, establish the regression model between the independent variable and the intermediary variable:
Where
4.2.3. Build a dependent variable model
Then, establish the regression model among independent variables, intermediate variables, and dependent variables.
Where
4.2.4. Calculation of intermediary effects
As shown in Figure 3 below, the left side represents the influence of independent variable
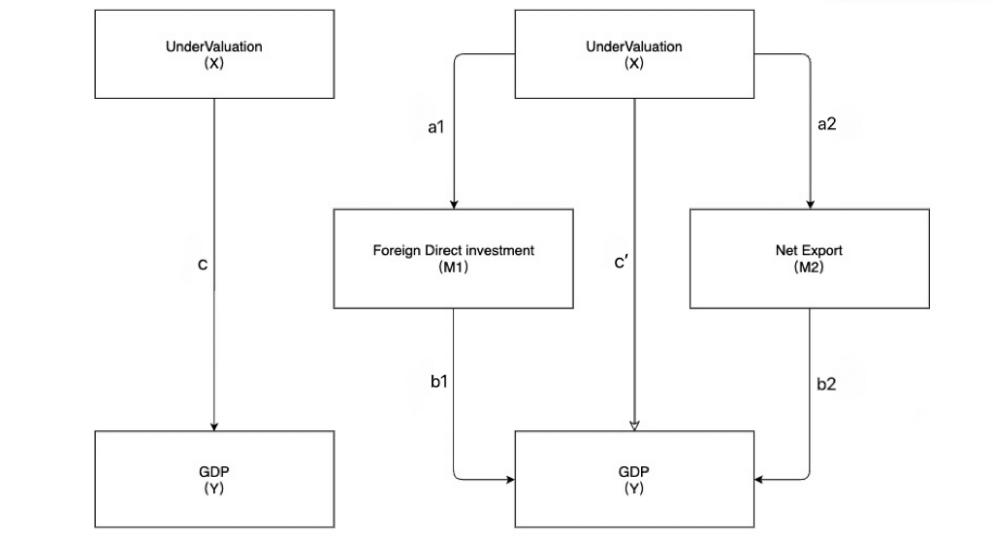
The total effect can be expressed as: 𝑐
4.2.5. Bootstrap significance testing
Bootstrap is a resampling method widely used in statistical inference to assess the reliability and significance of estimators, such as mediating effects. Especially when dealing with small samples or complex models, Bootstrap effectively constructs confidence intervals of estimators and tests their significance.
The basic idea of the Bootstrap method is to repeatedly sample the original sample and then calculate the statistics of interest (such as mediating effects) to construct its distribution. The specific steps include: randomly sampling samples from the original sample in the way of putting back to form multiple Bootstrap samples. Calculate the required statistics (e.g., direct effects, indirect effects) in each Bootstrap sample. Based on the distribution of these statistics, confidence intervals are constructed, and significance tests are carried out.
This method's advantage is that it does not depend on the data's distribution assumption, which makes it more applicable than traditional parameter testing methods (such as the t-test).
4.3. Vector autoregression model
This study chooses a vector autoregressive model (VAR) to conduct an empirical analysis of the impact of exchange rate undervaluation on economic growth. The VAR model is a model that regresses the schedule variable on the lag period of all variables. The VAR model treats all variables as endogenous variables to study the dynamic relationship between variables and does not require the distinction between endogenous and exogenous variables, which corresponds to the theoretical part above that treats real exchange rate undervaluation as an endogenous variable. VAR uses the Granger causality test to analyze the causal relationship between variables, uses impulse response to study the direction, size, and duration of dynamic shocks of each variable, and uses variance decomposition to study the contribution of each variable fluctuation.
The reason for choosing the VAR model in this paper is that the explanatory variables of the model are the lagged variables of the explained variables, and there will be no problems existing in the simultaneous equation model. The disadvantage of the VAR model is that it does not directly explain the causal relationship between variables in the economic system but reflects the sequence of variable changes in time. In addition, the VAR model requires a large number of parameters to be estimated, and a large sample size can improve the accuracy of the model.
The basic form of the VAR model with
Where:
5. Results and discussion
5.1. Panel data regression: time fixed effects model
5.1.1. RER fitting result
We obtain the fitted
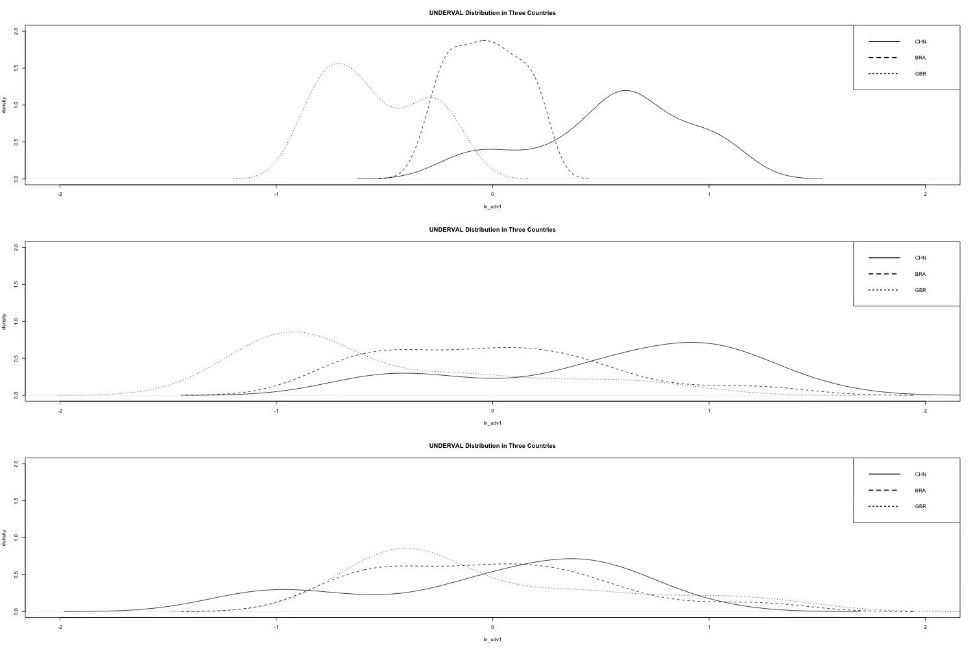
Figure 4: Undervaluation calculated in three countries
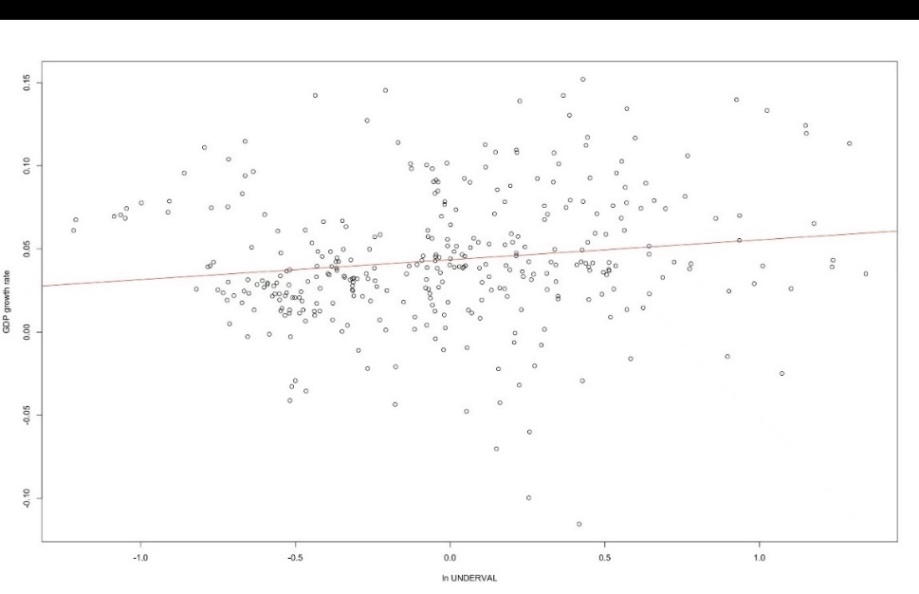
5.1.2. Panel regression results
Table 1 shows the regression results, which are also visually demonstrated in Figure 5. The regression results based on the three calculation methods are quite similar, demonstrating a high robustness of RER. Additionally, the results obtained from the other two calculation methods are identical, possibly due to the individual fixed effect and the time fixed effect, and the result is canceled out. Both the
Consideration about difference between countries will be further explored in the subsequent section.
|
Real exchange rate measure |
|||||||||
|
Developing |
Developed |
All |
Developing |
Developed |
All |
Developing |
Developed |
||
|
ln gdppc |
-0.0259 |
-0.0261 |
-0.0271 |
-0.0261 |
-0.0262 |
-0.0272 |
-0.0261 |
-0.0262 |
-0.0272 |
|
(-10.86) |
(-10.04) |
(-6.31) |
(-10.98) |
(-10.16) |
(-6.37) |
(-10.98) |
(-10.16) |
(-6.37) |
|
|
lnUNDERVAL |
0.0109 |
0.0109 |
0.0049 |
0.0124 |
0.0124 |
0.006 |
0.0124 |
0.0124 |
0.006 |
|
-4.44 |
-4.09 |
-0.84 |
-5.01 |
-4.62 |
-1 |
-5.01 |
-4.62 |
-1 |
|
|
No. of observation |
7,640 |
6,660 |
980 |
7,640 |
6,660 |
980 |
7,640 |
6,660 |
980 |
a: The dependent variable is annual growth in GDP per capital, in percent. Observations are also annual. All regressions include time and country fixed effects, Robust t statistics are in parentheses.
b: Sample excludes all countries with missing value.
5.2. Assessing mediation effects using bootstrap methodology
As shown in Table 2, in most countries, FDI and NX have significant Direct effects on GDP, which is reflected in their significant Average Direct Effect (ADE) and Total effects. The Average Causal Mediation Effect (ADCM) results of many of these countries are also significant, which indicates that the Undervaluation will indeed take FDI and NX as the mediating variables to affect GDP.
|
FDI P Value |
ADCM |
ADE |
Total Effects |
NX P Value |
ADCM |
ADE |
Total Effects |
|
Algeria |
0.430 |
0.920 |
0.940 |
Algeria |
0.840 |
0.860 |
0.790 |
|
Argentina |
0.492 |
0.056 |
0.028* |
Argentina |
0.046* |
0.032* |
0.074 |
|
Australia |
0.430 |
0.380 |
0.410 |
Australia |
0.652 |
0.394 |
0.072 |
|
Austria |
0.510 |
0.480 |
0.390 |
Austria |
0.980 |
0.430 |
0.430 |
|
Brazil |
0.710 |
0.002 ** |
0.002 ** |
Brazil |
0.146 |
0.000 *** |
0.002 ** |
|
Canada |
0.360 |
0.000 *** |
0.002 ** |
Canada |
0.024 * |
0.000 *** |
0.006 ** |
|
Chile |
0.840 |
0.170 |
0.160 |
Chile |
0.190 |
0.210 |
0.270 |
|
China |
0.596 |
0.034 * |
0.032 * |
China |
0.664 |
0.026 * |
0.000 *** |
|
Cyprus |
0.400 |
0.540 |
0.680 |
Cyprus |
0.250 |
0.490 |
0.700 |
5.3. Vector autoregression model
5.3.1. Unit root test
In order to guarantee the stationarity of time series data, measures need to be taken before building the VAR model, this study uses ADF method to test. As shown in Table 3, after the first-order difference of the original variables is performed, 97% of the first-order difference series of each variable reject the null hypothesis at the significance level of 5%, that is, there is no unit root, indicating that the first-order difference series of each variable is stationary.
|
P-Value |
dludv |
dlfdi |
dlgdp |
dnx |
conclusion |
|
Algeria |
0.000 |
0.000 |
0.019 |
0.000 |
stable |
|
Australia |
0.000 |
0.000 |
0.000 |
0.000 |
stable |
|
Austria |
0.000 |
0.000 |
0.000 |
0.000 |
stable |
|
Canada |
0.000 |
0.000 |
0.000 |
0.047 |
stable |
|
Chile |
0.000 |
0.000 |
0.000 |
0.008 |
stable |
|
China |
0.000 |
0.009 |
0.000 |
0.000 |
stable |
|
Cyprus |
0.000 |
0.000 |
0.000 |
0.000 |
stable |
5.3.2. Determine the lag order
It is very important to determine the optimal lag order for VAR model. The lag order of the model must be sufficiently large to utilize the variable information in the model effectively. However, the lag order of the model must not be too large, which will lead to too many estimated parameters and insufficient data estimation. In this study, according to the minimum optimal principle of the FPE criterion and AIC criterion, it can be seen from Table 4 that according to the information criterion, the optimal lag order of most countries is between 2 and 4. To make the lag order more compromised, the optimal lag order of this model is 3.
|
country |
Lag |
country |
Lag |
country |
Lag |
|
Algeria |
3 |
Ghana |
3 |
Nigeria |
3 |
|
Australia |
4 |
Iceland |
2 |
Norway |
4 |
|
Austria |
2 |
Israel |
3 |
Oman |
2 |
|
Canada |
2 |
Jordan |
4 |
Panama |
1 |
|
Chile |
2 |
Kenya |
4 |
Philippines |
2 |
|
China |
4 |
Malawi |
0 |
Portugal |
1 |
|
Cyprus |
3 |
Malta |
1 |
Singapore |
4 |
|
Denmark |
0 |
Mexico |
2 |
Spain |
1 |
|
Ecuador |
1 |
Mozambique |
2 |
Sweden |
1 |
|
Finland |
0 |
Myanmar |
2 |
Thailand |
3 |
|
Germany |
3 |
Netherlands |
2 |
Tunisia |
2 |
5.3.3. Cointegration test
Once the optimal lag order of the model has been determined, the cointegration test is conducted to assess the existence of a long-term cointegration relationship among the variables. The significance of the cointegration test is to avoid the spurious regression caused by the absence of a cointegration relationship in the time series. Engle-Granger is only applicable to the two-variable test, while Johansen is applicable to the multivariate test. Therefore, the Johansen cointegration test was used in this thesis. For the null hypothesis of "at most three cointegration relationships," Table 5 lists the trace statistics of all countries, most of which are greater than 3.76 of the critical value of 5% significance, indicating that the model can reject the null hypothesis at the significance level of 5%, and there are at least three cointegration relationships in the four variables of the model. According to the above test results, this section constructs a three-order vector autoregressive model with four variables (DR, DN, DF, DG) to conduct an empirical analysis of the impact of exchange rate changes on economic growth.
|
country |
Trace statistic |
country |
Trace statistic |
country |
Trace statistic |
|
Algeria |
3.77 |
Ghana |
7.08 |
Nigeria |
4.01 |
|
Australia |
10.28 |
Iceland |
3.75 |
Norway |
3.07 |
|
Austria |
3.2 |
Israel |
5.99 |
Oman |
10.15 |
|
Canada |
11.02 |
Jordan |
7.96 |
Panama |
8.48 |
|
Chile |
15.97 |
Kenya |
7.37 |
Philippines |
4.88 |
|
China |
7.58 |
Malawi |
4.83 |
Portugal |
14.32 |
|
Cyprus |
1.82 |
Malta |
5.06 |
Singapore |
10.80 |
|
Denmark |
12.95 |
Mexico |
5.06 |
Spain |
8.62 |
|
Ecuador |
8.93 |
Mozambique |
4.78 |
Sweden |
12.61 |
|
Finland |
9.77 |
Myanmar |
5.80 |
Thailand |
5.30 |
|
Germany |
9.77 |
Netherlands |
14.93 |
Tunisia |
8.76 |
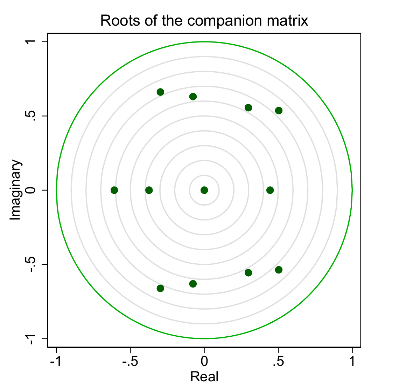
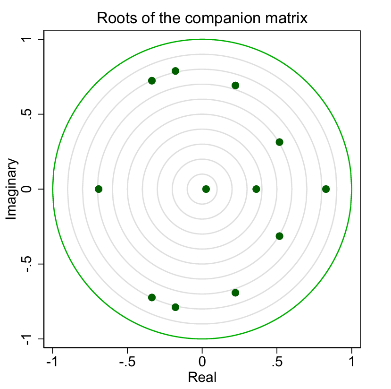
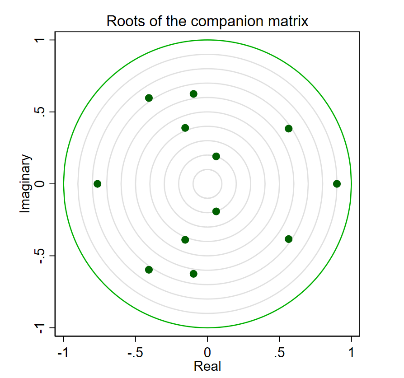
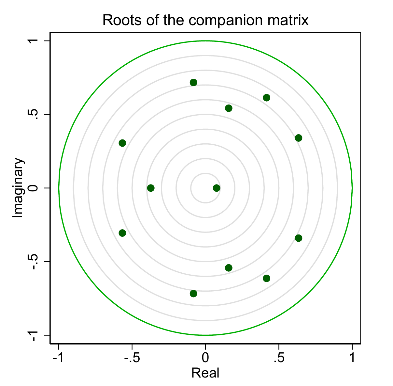
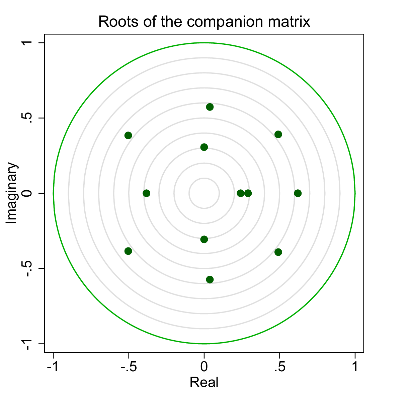
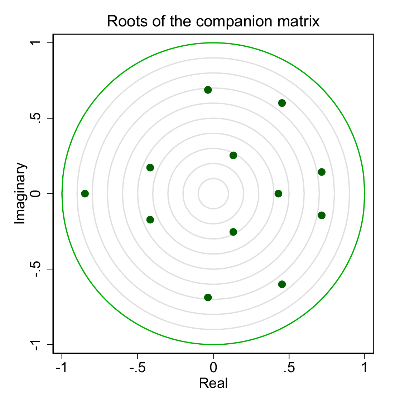
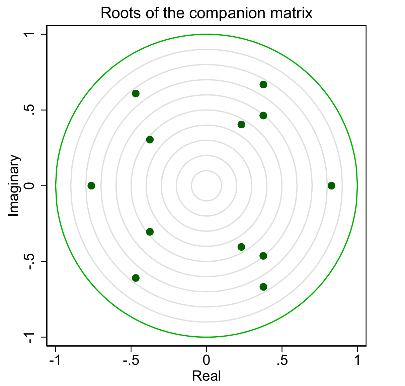
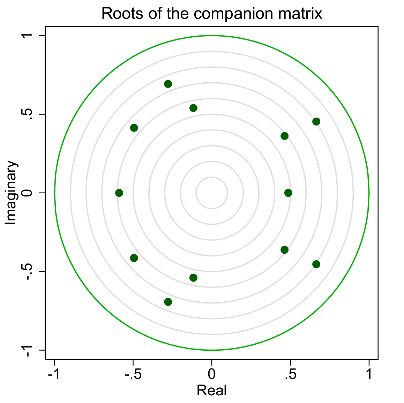
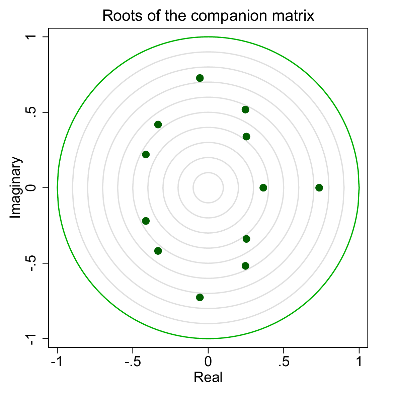
5.3.4. Stability test
After constructing the VAR model, the stability of the model parameters is tested. According to Figure 6, all the characteristic roots of the countries in this study are less than unity, so the model parameters of all countries are stable.
5.3.5. Granger causality test
The Granger causality test is used to determine the interdependence between variables. Since this model focuses on the impact of currency undervaluation on economic growth based on the international trade channel and the international capital flow channel. Table 6 lists the Granger test results for all countries. According to the test results, in all countries, exchange rate undervaluation affects economic growth through both the international trade channel (
|
country |
Granger |
country |
Granger |
country |
Granger |
|
Algeria |
fdi |
Ghana |
fdi |
Nigeria |
none |
|
Australia |
nx |
Iceland |
nx |
Norway |
none |
|
Austria |
none |
Israel |
fdi |
Oman |
none |
|
Canada |
nx |
Jordan |
nx |
Panama |
none |
|
Chile |
nx |
Kenya |
fdi |
Philippines |
nx |
|
China |
fdi |
Malawi |
fdi |
Portugal |
none |
|
Cyprus |
nx |
Malta |
none |
Singapore |
none |
|
Denmark |
nx |
Mexico |
fdi |
Spain |
nx |
|
Ecuador |
fdi |
Mozambique |
none |
Sweden |
fdi |
|
Finland |
nx |
Myanmar |
nx |
Thailand |
none |
|
Germany |
nx |
Netherlands |
fdi |
Tunisia |
none |
The purpose of this research is to obtain a more general result on whether the impact of exchange rate undervaluation differs across countries at different stages of development, based on the results of 33 typical countries at different stages of development.
Tables 7&8 show the Granger causes for all developed and developing countries respectively. It can be seen from the following table that in developed countries, the impact of exchange rate undervaluation on GDP growth is mainly through net export, that is, in developed countries, the exchange rate undervaluation mainly affects the country's economic growth through international trade channels (
|
country |
Granger |
country |
Granger |
|
Australia |
nx |
Israel |
fdi |
|
Austria |
None |
Malta |
none |
|
Canada |
nx |
Netherlands |
fdi |
|
Cyprus |
nx |
Norway |
none |
|
Denmark |
nx |
Portugal |
none |
|
Finland |
nx |
Singapore |
none |
|
Germany |
nx |
Spain |
nx |
|
Iceland |
nx |
Sweden |
fdi |
|
country |
Granger |
country |
Granger |
|
Algeria |
fdi |
Mozambique |
none |
|
Chile |
nx |
Myanmar |
nx |
|
China |
fdi |
Nigeria |
none |
|
Ecuador |
fdi |
Oman |
none |
|
Ghana |
fdi |
Panama |
none |
|
Jordan |
nx |
Philippines |
nx |
|
Kenya |
fdi |
Thailand |
none |
|
Malawi |
fdi |
Tunisia |
none |
|
Mexico |
fdi |
5.4. Discussion
Regarding the second part, to study the channels of exchange rate undervaluation on economic growth, this study makes an in-depth analysis of the relationship between exchange rate undervaluation and economic growth by establishing a VAR model. The research results show that the impact of exchange rate undervaluation on economic growth varies in different countries and development stages. The research of Hu et al. shows that real exchange rate undervaluation is conducive to promoting economic growth, among which industrial expansion, labor flow, capital investment, and technological progress are the main channels of influence [5]. This study finds that currency undervaluation does have an impact on economic growth through international trade and international capital flow channels. From the perspective of international trade channels, net exports constitute a part of aggregate demand. Import and export trade is closely related to investment and consumption, and its changes will affect aggregate demand and economic growth. Import and export trade contributes to domestic technological progress, institutional innovation, and optimal allocation of resources. This is consistent with the technical spillover effect of import and export trade and its impact on the enterprise management system mentioned in Freund and Guzman's literature [7,8]. In terms of international capital flow channels, FDI constitutes a part of the country's capital factor and directly affects economic growth. At the same time, FDI also has an impact on the country's industrial restructuring, technological progress, and institutional reform. This is consistent with the research conclusion of Markusen et al. on FDI promoting local industrial development [9]. Through the Granger causality test, we find that in developed countries, the impact of exchange rate undervaluation on GDP growth is mainly through net exports, that is, mainly through international trade channels, affecting the country's economic growth, while in developing countries, the impact is mainly through foreign direct investment, or in other words, international capital flow channels. This result is consistent with Rodrik's findings that there is a close relationship between real exchange rates and economic growth, and it shows different channels of influence in countries at different stages of development [3]. However, it should be noted that, as pointed out by Haddad and Pancaro, the role of undervalued exchange rates in promoting economic development is not always sustainable, and the long-term maintenance of such policies may distort domestic investment decisions and be detrimental to long-term sustainable development [12]. To sum up, the findings of this study provide a valuable reference for policymakers, who can choose appropriate policies to promote economic growth according to their country's stage of development and specific circumstances. At the same time, future research can further explore how to achieve economic growth while ensuring policy sustainability and stability.
6. Conclusion
The objective of our research is to test whether exchange rate undervaluation will affect national economic growth and to explore the channels through which exchange rate undervaluation affects economic growth. This study divides the channels into trade channels and capital flow channels. First of all, this paper uses the calculation method of exchange rate undervaluation pointed out in the existing literature, concludes that there is a strong correlation between the two, and uses two other methods to calculate exchange rate undervaluation to verify the robustness of our conclusion. Second, this paper introduces the proxy variables of the two channels, net export, and foreign direct investment, and uses the VAR model to find that the impact channels of exchange rate undervaluation on the economic growth of countries at different stages of development do vary. To be specific, developed countries mainly use trade channels, while developing countries mainly use international capital flow channels. This is basically consistent with the conclusions of previous studies.
Acknowledgments
Tianhao Hua, Mingyuan Liu, Kangle Tian, and Zihan Zhang contributed equally to this work and should be considered co-first authors.
References
[1]. Dollar, D. (1992). Outward-Oriented Developing Economies Really Do Grow More Rapidly: Evidence from 95 LDCs, 1976-1985. Economic Development and Cultural Change, 40(3), 523–544. Retrieved from http://www. jstor. org/stable/1154574.
[2]. Easterly, W. (2005). National Policies and Economic Growth: A Reappraisal. In P. Aghion & S. N. Durlauf (Eds. ), Handbook of Economic Growth (Vol. 1, Part A, pp. 1015-1059). Elsevier. ISBN 9780444520418.
[3]. Rodrik, D. (2008) ‘The real exchange rate and economic growth’, Brookings Papers on Economic Activity, 2008(2), pp. 365–412. doi:10. 1353/eca. 0. 0020.
[4]. Eichengreen, B. (2007). The Real Exchange Rate and Economic Growth. Social and Economic Studies, 56(4), 7–20. Retrieved from http://www. jstor. org/stable/27866525.
[5]. Rapetti, M. , Skott, P. and Razmi, A. (2012) ‘The real exchange rate and economic growth: Are developing countries different?’, International Review of Applied Economics, 26(6), pp. 735–753. doi:10. 1080/02692171. 2012. 686483.
[6]. Hu, J. , & Guo, P. (2021). Undervalued real exchange rate, industrialization process, and economic growth. Journal of Jinan University (Philosophy and Social Sciences Edition), 43(5), 115-132.
[7]. Freund, C. L. and Pierola, M. D. (2016) Export surges: The power of a competitive currency, SSRN. Available at: https://papers. ssrn. com/sol3/papers. cfm?abstract_id=1293163 (Accessed: 09 August 2024).
[8]. Guzman, M. , Ocampo, J. A. and Stiglitz, J. E. (2018) ‘Real exchange rate policies for economic development’, World Development, 110, pp. 51–62. doi:10. 1016/j. worlddev. 2018. 05. 017.
[9]. Markusen, J. R. & V. (1999) Foreign direct investment as a catalyst for industrial devel, European Economic Review. Available at: https://ideas. repec. org/a/eee/eecrev/v43y1999i2p335-356. html (Accessed: 09 August 2024).
[10]. Zheng, T. (2023). The impact of Vietnamese Dong exchange rate fluctuations on the macroeconomy of Vietnam (Master's thesis, Guangxi University). Retrieved from https://link. cnki. net/doi/10. 27034/d. cnki. ggxiu. 2023. 001361.
[11]. Sachs, J. and Larrain B. , F. (1993) Macroeconomics in the global economy. New York: Harvester Wheatsheaf.
[12]. Haddad M, Pancaro C. (2010) ‘Can real exchange rate undervaluation boost exports and growth in developing countries? Yes, but not for long’. World Bank-Economic Premise, 2010 (20): 1-5.
Cite this article
Hua,T.;Liu,M.;Tian,K.;Zhang,Z. (2025). The Influence of Currency Undervaluation on Economic Development: A Cross-Country Analysis of National Contexts. Advances in Economics, Management and Political Sciences,198,1-18.
Data availability
The datasets used and/or analyzed during the current study will be available from the authors upon reasonable request.
Disclaimer/Publisher's Note
The statements, opinions and data contained in all publications are solely those of the individual author(s) and contributor(s) and not of EWA Publishing and/or the editor(s). EWA Publishing and/or the editor(s) disclaim responsibility for any injury to people or property resulting from any ideas, methods, instructions or products referred to in the content.
About volume
Volume title: Proceedings of the 3rd International Conference on Financial Technology and Business Analysis
© 2024 by the author(s). Licensee EWA Publishing, Oxford, UK. This article is an open access article distributed under the terms and
conditions of the Creative Commons Attribution (CC BY) license. Authors who
publish this series agree to the following terms:
1. Authors retain copyright and grant the series right of first publication with the work simultaneously licensed under a Creative Commons
Attribution License that allows others to share the work with an acknowledgment of the work's authorship and initial publication in this
series.
2. Authors are able to enter into separate, additional contractual arrangements for the non-exclusive distribution of the series's published
version of the work (e.g., post it to an institutional repository or publish it in a book), with an acknowledgment of its initial
publication in this series.
3. Authors are permitted and encouraged to post their work online (e.g., in institutional repositories or on their website) prior to and
during the submission process, as it can lead to productive exchanges, as well as earlier and greater citation of published work (See
Open access policy for details).
References
[1]. Dollar, D. (1992). Outward-Oriented Developing Economies Really Do Grow More Rapidly: Evidence from 95 LDCs, 1976-1985. Economic Development and Cultural Change, 40(3), 523–544. Retrieved from http://www. jstor. org/stable/1154574.
[2]. Easterly, W. (2005). National Policies and Economic Growth: A Reappraisal. In P. Aghion & S. N. Durlauf (Eds. ), Handbook of Economic Growth (Vol. 1, Part A, pp. 1015-1059). Elsevier. ISBN 9780444520418.
[3]. Rodrik, D. (2008) ‘The real exchange rate and economic growth’, Brookings Papers on Economic Activity, 2008(2), pp. 365–412. doi:10. 1353/eca. 0. 0020.
[4]. Eichengreen, B. (2007). The Real Exchange Rate and Economic Growth. Social and Economic Studies, 56(4), 7–20. Retrieved from http://www. jstor. org/stable/27866525.
[5]. Rapetti, M. , Skott, P. and Razmi, A. (2012) ‘The real exchange rate and economic growth: Are developing countries different?’, International Review of Applied Economics, 26(6), pp. 735–753. doi:10. 1080/02692171. 2012. 686483.
[6]. Hu, J. , & Guo, P. (2021). Undervalued real exchange rate, industrialization process, and economic growth. Journal of Jinan University (Philosophy and Social Sciences Edition), 43(5), 115-132.
[7]. Freund, C. L. and Pierola, M. D. (2016) Export surges: The power of a competitive currency, SSRN. Available at: https://papers. ssrn. com/sol3/papers. cfm?abstract_id=1293163 (Accessed: 09 August 2024).
[8]. Guzman, M. , Ocampo, J. A. and Stiglitz, J. E. (2018) ‘Real exchange rate policies for economic development’, World Development, 110, pp. 51–62. doi:10. 1016/j. worlddev. 2018. 05. 017.
[9]. Markusen, J. R. & V. (1999) Foreign direct investment as a catalyst for industrial devel, European Economic Review. Available at: https://ideas. repec. org/a/eee/eecrev/v43y1999i2p335-356. html (Accessed: 09 August 2024).
[10]. Zheng, T. (2023). The impact of Vietnamese Dong exchange rate fluctuations on the macroeconomy of Vietnam (Master's thesis, Guangxi University). Retrieved from https://link. cnki. net/doi/10. 27034/d. cnki. ggxiu. 2023. 001361.
[11]. Sachs, J. and Larrain B. , F. (1993) Macroeconomics in the global economy. New York: Harvester Wheatsheaf.
[12]. Haddad M, Pancaro C. (2010) ‘Can real exchange rate undervaluation boost exports and growth in developing countries? Yes, but not for long’. World Bank-Economic Premise, 2010 (20): 1-5.