


1. Introduction
Most people view a trip to the cinema as a modest luxury—easy to postpone when budgets tighten, yet still more affordable than a weekend getaway or a new smartphone. Owing to this dual character, box-office figures offer a revealing pulse check on household confidence. A robust ticket market typically signals rising incomes and relaxed leisure budgets, while a sudden decline can foreshadow broader economic caution before it appears in official data. Over the past fifteen years, the world’s two largest film markets, China and the United States, have provided a vivid laboratory for observing this dynamic. Both expanded rapidly following the global financial crisis, reached record highs in 2019, and then collapsed sharply as the pandemic forced theaters to close. Yet their recoveries diverged: China, operating under import quotas and buoyed by targeted policy support, staged a sharp rebound in 2021 before plateauing, while the U.S. industry, shaped by market forces and a faster shift to streaming, has recovered more slowly and remains below its pre-pandemic peak.
This study traces these movements using curated annual data and transparent descriptive methods. The remainder of the paper is organized as follows. Section 2 reviews existing research on economic cycles and cultural spending. Section 3 details the data sources, variable definitions, and the trend-plot and period-average approach. Section 4 presents the results through headline tables, time-series charts, and a concise before-and-after comparison. Section 5 concludes the limitations and suggestions for future research and discusses the implications for studios, exhibitors, and policymakers.
2. Literature review
Scholars increasingly emphasize that shocks to trade relations, macroeconomic conditions, and industry structure shape film-market outcomes. A recent difference-in-differences study shows that the 2018 US–China trade war shifted Chinese audiences away from American titles toward domestic productions, reducing foreign attendance by roughly 25 % [1]. Industry reports further confirm that policy interventions and segmented distribution strategies facilitated the Chinese box-office rebound in 2023, despite continued investment uncertainty [2]. Structural factors also significantly influence market dynamics. Chinese theatre-level data indicate that vertically integrated chains tend to charge lower prices and extend the runs of their own films, without engaging in anti-competitive foreclosure of rival productions [3].
The link between macro conditions and cinema demand has long been debated. Time-series analyses for the United States reject the notionthat the film industry is “recession-proof,” finding that deeper downturns significantly curtail box-office growth [4]. Research in adjacent cultural sectors—such as comic books and the broader urban cultural economy—reports similar cyclicality [5, 6]. Likewise, European studies document production slowdowns during crises, including in Spain’s film sector and across the continental cultural economy [7, 8]. Spatial and labor-market responses to macroeconomic pressures add another dimension. In the United States, aggressive state tax incentives have fragmented production geography, weakening traditional hubs such as California and New York [9]. Comparative studies on Mexico and Spain shows that advertising-driven television markets suffer more during recessions than export-oriented systems, while transnational cinema has used the Great Recession as a narrative subject [10, 11]. Regional analyses within the U.S. creative economy echo these mixed effects, with Austin weathering 2007-09 better than Dallas–Ft. Worth, Houston or San Antonio [12]. Even prior to the 2008 crisis, funding constraints in France highlighted how financial stress can redirect film-makers toward lower-cost locations and genres [13]. Overall, the literature consistently suggests that macro-downturns depress film industry revenue.
3. Methods
This study draws on harmonized annual data for China and the United States covering the priod from 2010 to 2024. The primary objective is to provide an empirically transparent description of how theatrical box-office revenues co-evolve with key macroeconomic indicators before and after the growth slowdown that began in 2019.
3.1. Data sources and sample construction
Box-office revenue: Annual country-level grosses are retrieved from Box Office Mojo (https://www.boxofficemojo.com/), a widely cited industry database reporting nominal U.S. dollar receipts. All values are deflated to constant 2023 U.S. dollars using consumer price indices from the World Bank. Macro-economic indicators: Real GDP growth rates (constant prices) and surveyed unemployment rates are obtained from the World Bank Open Data portal (https://data.worldbank.org.cn/). The World Bank applies consistent national accounting definitions, ensuring cross-country comparability. The resulting balanced panel contains fifteen yearly observations for each country (N = 30). No gaps are present, so no interpolation or imputation is required.
3.2. Variable definitions
BoxOffice: annual theatrical revenue in year t, billions of 2023 USD.
GDP Growth: real year-on-year output change
Unemployment: annual average surveyed unemployment rate, per cent of the labor force.
Post-2019: A binary indicator that equals 1 for 2019-2024 and 0 for 2010-2018; the cut-off captures both the pre-pandemic growth deceleration and the pandemic shock itself.
3.3. Descriptive statistics
For each variable x and sub-period, the sample mean and standard deviation are computed according to the following formulas:
These summary measures, shown in Table 2, give a first look at level and volatility differences between the expansion phase (2010- 2018) and the slowdown phase (2019 - 2024).
3.4. Analytical strategy
Since the objective is to offer a statistically description and analysis, the study uses two tools.
Time-series inspection: Figures 1-3 plot the three variables for each country on a common horizontal axis. Visual comparison identifies turning points (2019 peak, 2020 trough) and the extent of post-shock recovery. This step establishes whether box-office revenue appears to co-move with GDP growth and to move inversely with unemployment.
Period-average contrasts: For each variable (x), the sample is split into Pre-2019 (2010-2018) and Post-2019 (2019-2024). Within each sub-period the mean and standard deviation are calculated.
The resulting panel (Table 2) highlights how typical levels and dispersions change after the downturn, without relying on formal hypothesis tests. Percentage changes quoted in the text (e.g., “box-office falls by 26 %”) are computed as:
4. Results
4.1. Aggregate trends
Table 1 summarizes fifteen years (2010–2024) of box-office revenue, GDP growth, and unemployment rate for China and the United States. Box-office takings rise steadily in both countries until 2019, contract sharply in the pandemic year 2020, and only partly regain pre-shock levels by 2024. GDP growth follows a similar pattern—moderating before 2019 and turning negative only in the United States during 2020—while unemployment moves inversely, spiking in 2020 and declining thereafter. These headline movements establish the macro context for the more detailed visual analysis presented in Figure1-3.
|
Year |
China Box Office |
US Box Office |
China GDP Growth |
US GDP Growth |
China Unemployment |
US Unemployment |
|
2010 |
658594886 |
10585388159 |
10.64 |
2.7 |
4.1 |
9.63 |
|
2011 |
532984811 |
10155695359 |
9.55 |
1.56 |
4.1 |
8.95 |
|
2012 |
329200932 |
10843641372 |
7.86 |
2.29 |
4.1 |
8.07 |
|
2013 |
3160825659 |
10955524800 |
7.77 |
2.12 |
4.05 |
7.38 |
|
2014 |
4132731079 |
10368861849 |
7.43 |
2.52 |
4.1 |
6.17 |
|
2015 |
6531354953 |
11148780747 |
7.04 |
2.95 |
4 |
5.28 |
|
2016 |
6595917640 |
11375225455 |
6.85 |
1.82 |
4 |
4.87 |
|
2017 |
8038549882 |
11075387520 |
6.95 |
2.46 |
3.9 |
4.36 |
|
2018 |
8929044967 |
11892160011 |
6.75 |
2.97 |
4.93 |
3.9 |
|
2019 |
8999073482 |
11363360766 |
5.95 |
2.58 |
5.15 |
3.67 |
|
2020 |
1710830601 |
2113386800 |
2.24 |
-2.16 |
5.61 |
8.06 |
|
2021 |
6065906999 |
4483016589 |
8.45 |
6.06 |
5.11 |
5.35 |
|
2022 |
957181467 |
7369914732 |
2.95 |
2.51 |
5.5 |
3.65 |
|
2023 |
877342892 |
8907111984 |
5.25 |
2.89 |
5.2 |
3.64 |
|
2024 |
674927760 |
8570012657 |
5 |
2.8 |
5.1 |
4.1 |
Note: Box‑office figures are expressed in U.S. dollars (billions). Macro‑economic indicators are annual percentage rates.
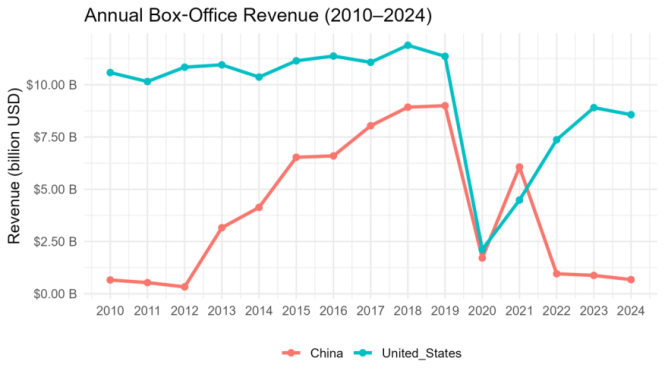
Both markets share three inflection points. Expansion (2010–2018): U.S. receipts hover around USD 10–11 bn, while China grows from below USD 1 bn to nearly USD 9 bn. Peak (2019): local maximum for both. Collapse (2020): revenue falls by about 80% in both countries. Post-2020, the U.S. market showed a steadier recovery (but still ~25 % below 018 levels by 2024), while China’s recovery was sharper in 2021 but plateaued near USD 1 bn thereafter, reflecting stronger U.S. reslience once restrictions eased.
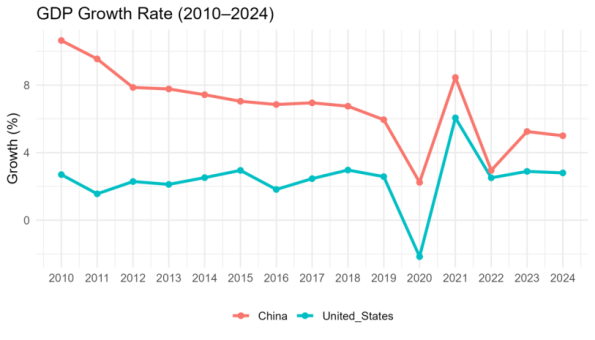
China’s GDP decelerated from 10 % (2010) to ~5 % (2019), dropped to 2.2 % in 2020, rebounded to 8.4 % in 2021, and stablized around 5%. U.S. growth hovered near 2–3% pre-pandemic, plunged to –2.2% in 2020, jumped to 6.1 % in 2021, then settled below 3% by 2024. Box-office trends align visually with GDP swings observed in Figure 1: collapse during downturns, partial recovery during rebounds, though recovery speed differed.
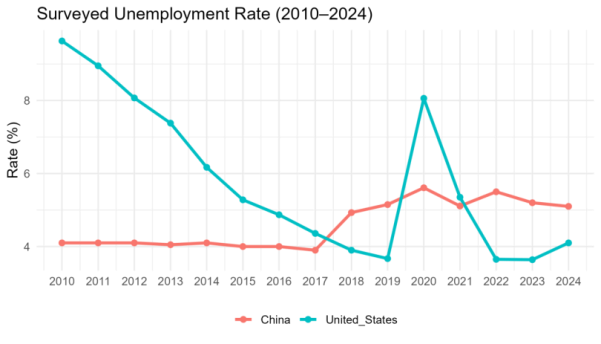
In Figure 3, two curves move in opposite directions to the box-office profiles shown earlier. The jobless rate in U. S. Falls steadily from 9.6 % in 2010 to 3.6 % in 2019, surges to 8.1 % during the 2020 lockdown, and then retreats to about 4 % by 2024—still above the pre-pandemic trough.
As for China, unemployment hovers near 4 % through 2017, rises to the mid-5 % range after growth slows in 2019, peaks at 5.6 % in 2020, and remains elevated relative to the earlier decade. The mirror-image relationship between unemployment and the revenue trend in Figure 1 reinforces the demand-side narrative: higher joblessness coincides with lower cinema spending, particularly during the pandemic shock.
4.2. Descriptive comparison before and after the 2019 downturn
|
Country |
Group |
Box_Office |
GDP_Growth |
Unemployment |
|||
|
Mean |
SD |
Mean |
SD |
Mean |
SD |
||
|
China |
Full Sample |
3.88 |
3.33 |
6.71 |
2.23 |
4.6 |
0.63 |
|
China |
Pre-2019 |
4.32 |
3.36 |
7.87 |
1.35 |
4.14 |
0.3 |
|
China |
Post-2019 |
3.21 |
3.49 |
4.97 |
2.22 |
5.28 |
0.22 |
|
US |
Full Sample |
9.41 |
2.8 |
2.4 |
1.61 |
5.61 |
2.06 |
|
US |
Pre-2019 |
10.9 |
0.53 |
2.38 |
0.48 |
6.51 |
2.06 |
|
US |
Post-2019 |
7.13 |
3.33 |
2.45 |
2.63 |
4.25 |
1.7 |
Table 2 compares means (μ) and standard deviations (σ) of key variables pre- and post-2019. Box-office contraction: Average receipts fell by 26% in China (4.32 → 3.21 bn) and 35% in the U.S. (10.90 → 7.13 bn). U.S. revenue volatility increased sharply (σ = 0.53 → 3.33). GDP deceleration: China’s mean growth dropped from 7.87% to 4.97%. U.S. growth appeared stable (2.38 → 2.45 %) but adjusting for the 2021 rebound reveals a hidden decline (to ~1.3%), consistent with a downturn narrative. Labor-market divergence: China’s unemployment rose from 4.14% to 5.28% after 2019, whereas U.S. unemployment fell from 6.51% to 4.25%, reflecting post-pandemic labor tightening.
Overall, box-office contraction aligned with weaker macro fundamentals, but single-year outliners notably 2021, distort simple means. Hence, subsequent analysis focus on year-by-year visual patterns.
4.3. Box-office vs. macro indicators: China vs United States
Figure 4-5 plot box-office revenue (red, left axis) against GDP growth (green, right axis) and unemployment (blue, right axis) for each country.
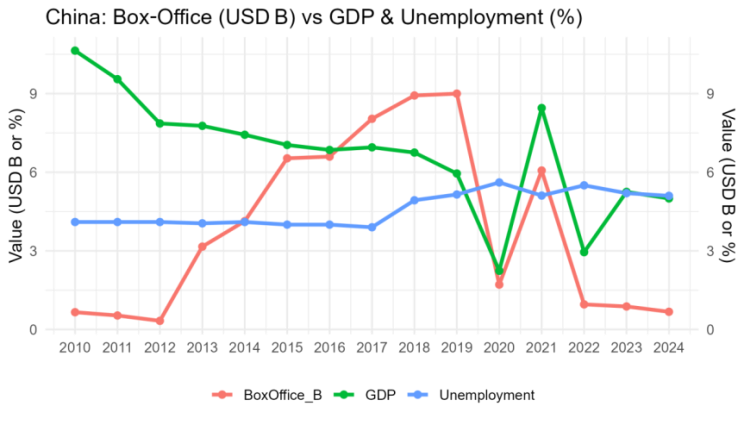
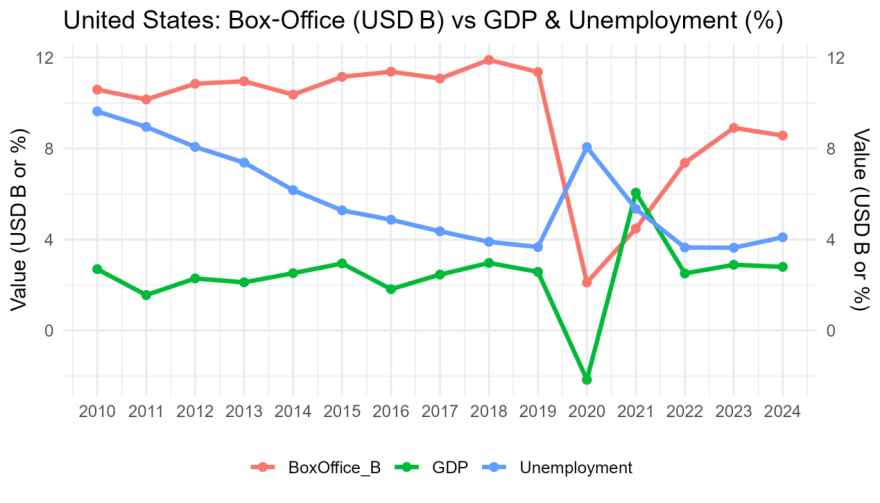
In both countries, box-office receipts positively correlate with GDP growth and negatively correlate with unemployment since 2019. China’s receipts respond strongly to growth: every one-percentage-point decline in GDP from 2010-2019 roughly halves the incremental box-office gain, while U.S. revenues remain flat in the same macro range. The 2020 collapse is equally deep (≈–80 %) in both markets, but the underlying drivers differ: China endures positive yet weak growth (+2 %) with cinemas shut; the United States faces a simultaneous supply shock and GDP contraction (–2 %).
China posts a V-shaped rebound in 2021 on the back of an 8 % growth spike, then levels off as GDP returns to ~5 % and unemployment stays above its pre-shock floor. The United States shows a slower, incomplete climb: even with a one-off 6 % GDP jump in 2021 and unemployment back near 4 %, box-office is still one-quarter below its 2018 peak by 2024.
5. Conclusion
This study combines macroeconomic indicators with film industry data to analyze China and the United States from 2010 to 2024. The research shows that theatrical revenues follow economic cycles which match both GDP growth patterns and labor market changes. The synchronized market decline in 2020 and subsequent different recovery patterns between markets demonstrate how institutional frameworks and policy interventions and market structure influence outcomes. The study refutes basic industry resilience theories by showing that cultural industries need complex analysis to understand their economic shock responses.
The findings extend beyond the current results. The study reveals important implications for industry practitioners. Economic downturns need to be treated as serious risks by industry practitioners who should develop proactive response strategies including diversified release platforms and flexible scheduling. The evidence demonstrates that policymakers should provide specific support to cultural industries when economies face stress because independent and small exhibitors lack resilience. The development of local content production together with digital distribution expansion helps create long-term resilience.
The research also contains certain limitations. The annual data collection method prevents researchers from identifying both short-term market changes and the immediate effects of policy implementations. The descriptive approach provides clear results but fails to establish whether supply-side restrictions or demand-side income changes are the cause of observed effects. Future research should use quarterly data instead of annual data and researchers should include streaming penetration rates and regional-level interventions as additional explanatory variables. The analysis would benefit from using panel regression techniques and other advanced statistical models to establish stronger causal relationships.
Overall, the research confirms that macroeconomic conditions together with policy environments and market structures determine how the film industry develops. The development of effective strategies for industry stability and cultural vitality in an uncertain world requires a deep understanding of these complex interactions.
References
[1]. Ren, Y. , Zong, C. , & Zhan, X. (2024). Trade war, national sentiment and consumption substitution of cultural products: evidence from China’s film market. Empirical Economics, 66(2), 503-538.
[2]. Liu, H. , & Shi, H. (2024). Analysis report on the development of the Chinese Film Industry in 2023. Journal of Chinese Film Studies, 4(1), 121-151.
[3]. Gil, R. , Ho, C. Y. , Xu, L. , & Zhou, Y. (2024). Vertical integration and market foreclosure in media markets: Evidence from the Chinese motion picture industry. The Journal of Law and Economics, 67(1), 143-193.
[4]. Orme, T. , & Vogel, H. L. (2020). Is the motion-pictures industry recession proof? International Advances in Economic Research, 26(4), 363-375.
[5]. Beaty, B. (2010). The recession and the American comic book industry: From inelastic cultural good to economic integration. Popular Communication, 8(3), 203-207.
[6]. Grodach, C. , & Seman, M. (2013). The cultural economy in recession: Examining the US experience. Cities, 33, 15-28.
[7]. Díaz-González, M. J. , & González-del-Valle, A. (2021). Film policies and film production in Spain during the economic crisis (2007-2017). Palabra Clave, 24(1).
[8]. Moldoveanu, M. , & Ioan-Franc, V. (2011). The impact of the economic crisis on culture. Review of General Management, 14(2), 15-35.
[9]. Gautney, H. , & Rhomberg, C. (2015). The runaway production complex? The film industry as a driver of urban economic revitalization in the United States. City & Community, 14(3), 262-285.
[10]. Medina, M. , & Barron, L. (2013). The impact of the recession on the TV industry in Mexico and Spain. Communication & Society, 26(2), 27-46.
[11]. Oliete-Aldea, E. (2017). Global financial crisis in local filmic scenarios: Transnational cinema of the Great Recession. In Global Finance on Screen (pp. 179-197). Routledge.
[12]. Seman, M. , & Carroll, M. C. (2017). The creative economies of Texas metropolitan regions: a comparative analysis before, during, and after the recession. Growth and Change, 48(4), 831-852.
[13]. Bray, M. , & Calatayud, A. (2005). The French film industry's current financial crisis and its impact on creation: the example of Jacques Doillon's Raja (2003). Studies in European Cinema, 2(3), 199-212.
Cite this article
Yin,Q. (2025). Using Statistical Methods to Analyze the Impact of Economic Recession on the Film Industry in China and the United States. Advances in Economics, Management and Political Sciences,196,14-22.
Data availability
The datasets used and/or analyzed during the current study will be available from the authors upon reasonable request.
Disclaimer/Publisher's Note
The statements, opinions and data contained in all publications are solely those of the individual author(s) and contributor(s) and not of EWA Publishing and/or the editor(s). EWA Publishing and/or the editor(s) disclaim responsibility for any injury to people or property resulting from any ideas, methods, instructions or products referred to in the content.
About volume
Volume title: Proceedings of ICEMGD 2025 Symposium: The 4th International Conference on Applied Economics and Policy Studies
© 2024 by the author(s). Licensee EWA Publishing, Oxford, UK. This article is an open access article distributed under the terms and
conditions of the Creative Commons Attribution (CC BY) license. Authors who
publish this series agree to the following terms:
1. Authors retain copyright and grant the series right of first publication with the work simultaneously licensed under a Creative Commons
Attribution License that allows others to share the work with an acknowledgment of the work's authorship and initial publication in this
series.
2. Authors are able to enter into separate, additional contractual arrangements for the non-exclusive distribution of the series's published
version of the work (e.g., post it to an institutional repository or publish it in a book), with an acknowledgment of its initial
publication in this series.
3. Authors are permitted and encouraged to post their work online (e.g., in institutional repositories or on their website) prior to and
during the submission process, as it can lead to productive exchanges, as well as earlier and greater citation of published work (See
Open access policy for details).
References
[1]. Ren, Y. , Zong, C. , & Zhan, X. (2024). Trade war, national sentiment and consumption substitution of cultural products: evidence from China’s film market. Empirical Economics, 66(2), 503-538.
[2]. Liu, H. , & Shi, H. (2024). Analysis report on the development of the Chinese Film Industry in 2023. Journal of Chinese Film Studies, 4(1), 121-151.
[3]. Gil, R. , Ho, C. Y. , Xu, L. , & Zhou, Y. (2024). Vertical integration and market foreclosure in media markets: Evidence from the Chinese motion picture industry. The Journal of Law and Economics, 67(1), 143-193.
[4]. Orme, T. , & Vogel, H. L. (2020). Is the motion-pictures industry recession proof? International Advances in Economic Research, 26(4), 363-375.
[5]. Beaty, B. (2010). The recession and the American comic book industry: From inelastic cultural good to economic integration. Popular Communication, 8(3), 203-207.
[6]. Grodach, C. , & Seman, M. (2013). The cultural economy in recession: Examining the US experience. Cities, 33, 15-28.
[7]. Díaz-González, M. J. , & González-del-Valle, A. (2021). Film policies and film production in Spain during the economic crisis (2007-2017). Palabra Clave, 24(1).
[8]. Moldoveanu, M. , & Ioan-Franc, V. (2011). The impact of the economic crisis on culture. Review of General Management, 14(2), 15-35.
[9]. Gautney, H. , & Rhomberg, C. (2015). The runaway production complex? The film industry as a driver of urban economic revitalization in the United States. City & Community, 14(3), 262-285.
[10]. Medina, M. , & Barron, L. (2013). The impact of the recession on the TV industry in Mexico and Spain. Communication & Society, 26(2), 27-46.
[11]. Oliete-Aldea, E. (2017). Global financial crisis in local filmic scenarios: Transnational cinema of the Great Recession. In Global Finance on Screen (pp. 179-197). Routledge.
[12]. Seman, M. , & Carroll, M. C. (2017). The creative economies of Texas metropolitan regions: a comparative analysis before, during, and after the recession. Growth and Change, 48(4), 831-852.
[13]. Bray, M. , & Calatayud, A. (2005). The French film industry's current financial crisis and its impact on creation: the example of Jacques Doillon's Raja (2003). Studies in European Cinema, 2(3), 199-212.